. 2018 Oct 10;100(1):201-215.e9.
doi: 10.1016/j.neuron.2018.08.038. Epub 2018 Oct 2.

An Input-Specific Orphan Receptor GPR158-HSPG Interaction Organizes Hippocampal Mossy Fiber-CA3 Synapses

Affiliations

An Input-Specific Orphan Receptor GPR158-HSPG Interaction Organizes Hippocampal Mossy Fiber-CA3 Synapses

Giuseppe Condomitti et al. Neuron. .

Abstract

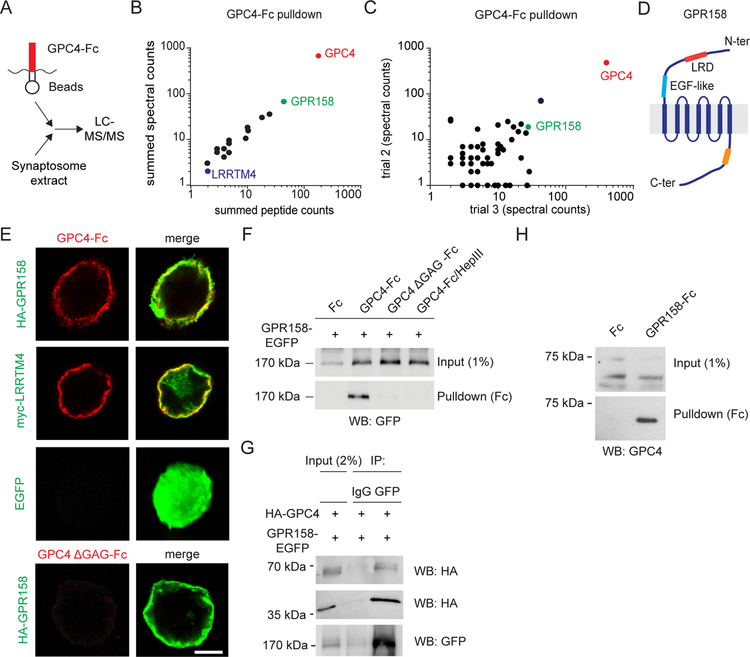
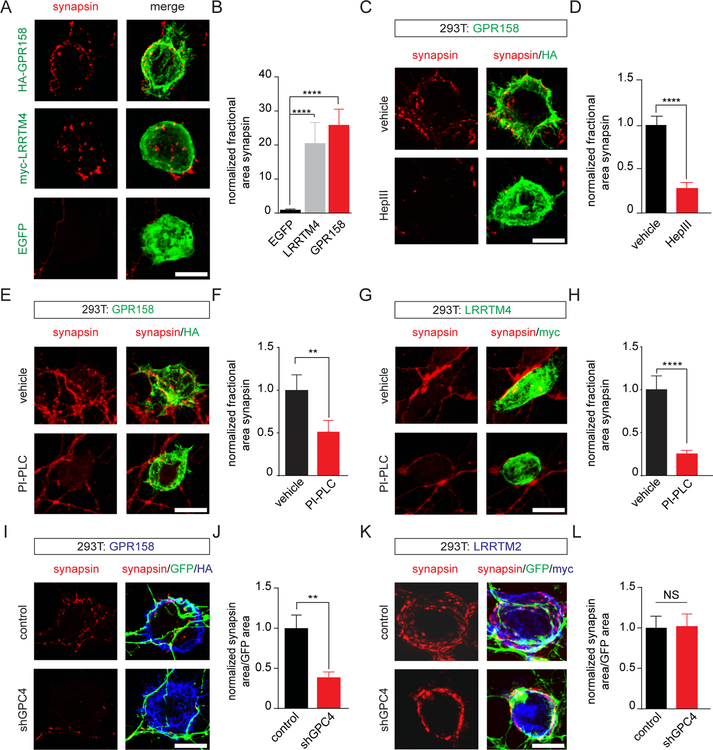
Pyramidal neuron dendrites integrate synaptic input from multiple partners. Different inputs converging on the same dendrite have distinct structural and functional features, but the molecular mechanisms organizing input-specific properties are poorly understood. We identify the orphan receptor GPR158 as a binding partner for the heparan sulfate proteoglycan (HSPG) glypican 4 (GPC4). GPC4 is enriched on hippocampal granule cell axons (mossy fibers), whereas postsynaptic GPR158 is restricted to the proximal segment of CA3 apical dendrites receiving mossy fiber input. GPR158-induced presynaptic differentiation in contacting axons requires cell-surface GPC4 and the co-receptor LAR. Loss of GPR158 increases mossy fiber synapse density but disrupts bouton morphology, impairs ultrastructural organization of active zone and postsynaptic density, and reduces synaptic strength of this connection, while adjacent inputs on the same dendrite are unaffected. Our work identifies an input-specific HSPG-GPR158 interaction that selectively organizes synaptic architecture and function of developing mossy fiber-CA3 synapses in the hippocampus.

Keywords: active zone; glutamatergic transmission; heparan sulfate proteoglycan; hippocampus; mossy fiber synapse; orphan receptor; postsynaptic density; pyramidal neuron; synaptic specificity; synaptogenesis.


Conflict of interest statement

Declaration of Interests

The authors declare no competing interests.

Figures

Figure 1.
Figure 1.. GPR158 is a heparan sulfate-dependent GPC4 binding partner
(A) Proteomic workflow for the identification of GPC4-interacting proteins. (B) Identification of GPR158 as a GPC4 interactor by tandem mass spectrometry. GPC4-Fc protein was used as bait and synaptosome extract from P21 rat brains as prey. Graph shows summed peptide and spectral counts for all surface proteins after Fc background subtraction (n = 3 independent experiments). (C) Freqency of detection of peptides (spectral count) for all proteins identified in two independent GPC4-Fc affinity purification experiments after Fc background subtraction. (D) GPR158 domain organization. LRD, Leucine-Rich Domain; EGF-like, EGF-like Ca2+ binding motif. Yellow region, RGS7-binding site. (E) Cell-surface binding assays in HEK293T cells. GPC4-Fc (red), but not GPC4 ΔGAG-Fc, binds the GPR158 ectodomain (green) expressed on the cell membrane. LRRTM4 and EGFP serve as positive and negative controls, respectively. (F) Pulldown assay in HEK293T cells. GPC4-Fc, but not Fc alone, binds GPR158. HS removal by mutagenesis (GPC4 ΔGAG-Fc) or Heparinase III treatment (GPC4-Fc/HepIII) abolishes the interaction. (G) GPC4 and GPR158 interact in trans. GPC4 co-immunoprecipitates with GPR158 following expression in separately transfected and co-cultured HEK293T cells. 65 kDa band represents full-length GPC4; 40 kDa band the N-terminal proteolytic fragment. IgG serves as negative control. (H) Pulldown assay in hippocampal lysate. GPR158-Fc, but not Fc alone, binds endogenous GPC4. Scale bar in (E) 10 µm. See also Figure S1.
Figure 2.
Figure 2.. GPR158 is expressed in CA3 pyramidal neurons and enriched in stratum lucidum
(A) Targeting strategy used to generate Gpr158 KO mouse. Boxes indicate coding exons. (B) Gpr158 expression analysis using X-gal staining (blue) in Gpr158 heterozygous hippocampus. (C) Representative insets of β-galactosidase immunofluorescence (green) in GC, CA3 and CA1 regions. Upper panels (greyscale) are inverted for visualization. Hoechst (blue), nuclear marker. (D) Quantification of ß-gal expression in P14 principal hippocampal neurons (GC 0.065 ± 0.005 (N=3 mice, n=4051 cells) vs CA3 3.55 ± 0.06 (N=3, n=1864) vs CA1 0.98 ± 0.03 (N=3, n=1827)); ****p<0.0001, one-way ANOVA with multiple comparisons. (E) Lamina-specific GPR158 immunoreactivity (green) in CA3 SL (arrowheads) in P28 WT hippocampus. No signal is detected in Gpr158 KO hippocampus. PSD95, postsynaptic marker (red); Bassoon, presynaptic marker (Bsn; blue). SP, stratum pyramidale; SL, stratum lucidum; SR, stratum radiatum. (F) Higher magnification of GPR158 immunoreactivity in CA3 SL in WT and Gpr158 KO. (G) Western blot analysis of rat brain fractionation probed for GPR158, PSD95 and presynaptic marker synaptophysin (SYP). GPR158-specific band is at 150 kDa, asterisk indicates aspecific band. (H) HA-GPR158 (red) localization in EGFP-positive (green) P21 hippocampal CA3 pyramidal neuron in utero electroporated with EGFP--T2A--HA-GPR158. HA-GPR158 localizes to the proximal portion of the CA3 apical dendrite in SL. (I) HA-GPR158 puncta localize to dendritic spine heads (arrowheads). (J) Quantification of HA-GPR158 distribution in CA3 dendrites (SL 1.28 ± 0.17 (N=3 mice, n=13 dendrites/ 13 cells) vs SR 0.01 ± 0.0046 (N=3, n=8/8)); ****p<0.0001, Welch ‘s t-test. Bar graphs show mean ± SEM. Scale bar represents 300 µm in (B); 150 µm in (E); 50 µm in (F); 10 µm in (C), (H); and 5 µm in (I). See also Figure S2.
Figure 3.
Figure 3.. GPR158 induces presynaptic differentiation via cell-surface GPC4
(A) The HA-GPR158 ectodomain (green) expressed on the surface of HEK293T cells co-cultured with 7DIV (days in vitro) hippocampal neurons induces clustering of the presynaptic marker synapsin (red) in axons. LRRTM4, positive control; EGFP, negative control. (B) Quantification of (A). Fractional synapsin area: synapsin area per HA/myc-labeled surface area normalized to EGFP-expressing control cells; EGFP 1.00 ± 0.24 (n=17 cells) vs LRRTM4 20.6 ± 6.1 (n=21) and vs GPR158 25.9 ± 4.6 (n=34). ****p<0.0001, Kruskal-Wallis test, Dunn’s multiple comparisons post hoc test. (C) Heparinase III (HepIII) treatment reduces GPR158-mediated synapsin clustering. (D) Quantification of (C); vehicle 1.00 ± 0.16 (n=26 cells) vs HepIII 0.32 ± 0.06 (n=31); ****p<0.0001, Mann-Whitney test. (E) PI-PLC treatment reduces GPR158-mediated synapsin clustering. (F) Quantification of (E); vehicle 1.00 ± 0.17 (n=26 cells) vs PI-PLC 0.54 ± 0.12 (n=26); **p<0.001, Mann-Whitney test. (G) PI-PLC treatment impairs LRRTM4-mediated presynaptic differentiation. (H) Quantification of (G); vehicle 1.00 ± 0.1 (n=22 cells) vs PI-PLC 0.26 ± 0.04 (n=26); ****p<0.0001, Mann-Whitney test. (I) Neuronal GPC4 knockdown (KD) decreases synapsin clustering in GFP-positive axons contacting GPR158-expressing cells (blue). The KD vector contains an EGFP reporter to visualize neuronal processes. (J) Quantification of (I); control 1.00 ± 0.16 (n=23 cells) vs shGPC4 0.39 ± 0.07 (n=22); **p<0.001, Mann-Whitney test. (K) Neuronal GPC4 KD does not affect LRRTM2-mediated presynaptic differentiation. (L) Quantification of (K); control 1.00 ± 0.15 (n=21 cells) vs shGPC4 1.03 ± 0.15 (n=25); NS, p=0.93, Mann-Whitney test. Bar graphs show mean ± SEM. Scale bar represents 10 µm in (A), (C), (E), (G), (I) and (K). See also Figure S3 and S4.
Figure 4.
Figure 4.. GPR158-mediated synaptic differentiation requires the presynaptic receptor LAR
(A) Neuronal LAR KD does not impair synapsin (red) clustering in axons contacting LRRTM4-expressing HEK293T cells (green). (B) Quantification of (A); control 1.00 ± 0.15 (n=25 cells) vs shLAR 1.26 ± 0.13 (n=26); NS, p=0.11, Mann-Whitney test. (C) Neuronal LAR KD reduces synapsin clustering in axons contacting co-cultured GPR158-expressing HEK293T cells. (D) Quantification of (C); control 1.00 ± 0.17 (n=25 cells) vs shLAR 0.66 ± 0.17 (n=25); *p<0.01, Mann-Whitney test. (E) Neuronal PTPσ KD, but not PTPδ KD, impairs LRRTM4-mediated presynaptic differentiation. (F) Quantification of (E); control 1.00 ± 0.11 (n=29 cells) vs shPTPδ 0.99 ± 0.12 (n=29) vs shPTPσ 0.61 ± 0.12 (n=27); *p<0.01,one-way ANOVA with multiple comparisons. (G) Neuronal PTPσ KD, but not PTPδ KD, increases GPR158-mediated presynaptic differentiation. (H) Quantification of (G); control 1.00 ± 0.17 (n=26 cells) vs shPTPδ 1.27 ± 0.18 (n=26) vs shPTPσ 2.02 ± 0.29 (n=21); *p<0.01,one-way ANOVA with multiple comparisons. Bar graphs show mean ± SEM. Scale bar represents 10 µm in (A), (C), (E) and (G). See also Figure S5.
Figure 5.
Figure 5.. GPR158 regulates MF-CA3 synapse density and size
(A) Representative images of Alexa568-filled CA3 apical dendrites in stratum lucidum (SL) of P21 WT and Gpr158 KO littermates. (B) Quantification of spine density in CA3 SL; WT 1.38 ± 0.11 spine/µm (N=3 mice, n=22 dendrites/18 cells) vs Gpr158 KO 1.89 ± 0.08 spine/µm (N=3, n=20/15); ***p<0.0001, Welch’s t test. (C) Representative images of CA3 dendrites in stratum radiatum (SR) of P21 WT and Gpr158 KO littermates. (D) Quantification of spine density in CA3 SR; WT 1.67 ± 0.07 spine/µm (N=3 mice, n=19 dendrites/18 cells) vs Gpr158 KO 1.55 ± 0.07 spine/µm (N=3, n=17/15); NS, p=0.25; Welch’s t test. (E) Representative images of GFP-electroporated CA3 apical dendrites in SL of P21 WT and Gpr158 KO mice. (F) Quantification of spine density in CA3 SL; WT 1.14 ± 0.09 spine/µm (N=3 mice, n=19 dendrites/17 cells) vs Gpr158 KO 1.94 ± 0.17 spine/µm (N=5, n=19/15); ****p<0.0001, Mann-Whitney test. (G) Representative images of CA3 dendrites in stratum radiatum (SR) of P21 WT and Gpr158 KO mice. (H) Quantification of spine density in CA3 SR; WT 1.51 ± 0.18 spine/µm (N=3 mice, n=14 dendrites/12 cells) vs Gpr158 KO 1.46 ± 0.08 spine/µm (N=5, n=14/13); NS, p=0.734; Mann-Whitney test. (I) Electron micrographs of P14 WT and Gpr158 KO MF-CA3 synapses. Orange, presynaptic element. Lower panel, masked boutons (white). (J, K) Quantification of MF-CA3 synapse density (WT 0.018 ± 0.001 (N=3 mice, n=50 synapses) vs Gpr158 KO 0.037 ± 0.002 (N=3, n=41)) [J], and presynaptic area (WT 6.84 ± 0.40 µm2 (N=3, n=87) vs Gpr158 KO 3.074 ± 0.17 µm2 (N=3, n=138)) [K]. ****p<0.00001; Mann-Whitney test. (L) SBF-SEM 3D reconstructions of P14 WT and Gpr158 KO MF boutons. (M, N) Quantification of MF bouton surface area (WT 62.9 ± 8.20 µm2 (N=2 mice, n=13 boutons) vs Gpr158 KO 34.8 ± 4.79 µm2 (N=2, n=12)) [M], and volume (WT 13.6 ± 1.68 µm3 (N=2 mice, n=13 boutons) vs Gpr158 KO 6.27 ± 0.94 µm2 (N=2, n=12)) [N]. **p<0.001; Mann-Whitney test. Bar graphs show mean ± SEM. Scale bar represents 10 µm in (A) (C), (E) and (G), 2 µm in (I) and (L). See also Figure S6.
Figure 6.
Figure 6.. GPR158 organizes MF-CA3 synaptic architecture
(A) Electron micrographs of P14 WT and Gpr158 KO MF-CA3 synapses. Orange, presynaptic element. Lower panel, masked bouton outline (red) and PSDs (white). (B, C) Quantification of the number of PSDs per MF-CA3 presynaptic profile (WT 11.7 ± 0.76 (N=3 mice, n=50 synapses) vs KO 25.2 ± 1.54 (N=3, n=41)) [B], and PSD area (WT 0.034 ± 0.0008 µm2 (N=3 mice, n=581 PSDs) vs KO 0.015 ± 0.0003 µm2 (N=3, n=1033)) [C]. ****p<0.0001, Mann-Whitney test. (D) Electron micrographs of non-MF synapses in P14 WT and Gpr158 KO CA3 SR. Orange, presynaptic; green, postsynaptic element. (E) Quantification of the number of PSDs per non-MF synapse in CA3 SR (WT 1.23 ± 0.05 (N=3 mice, n=47 synapses) vs KO 1.16 ± 0.06 (N=3, n=39)). NS, p=0.10, Mann-Whitney test. (F) Electron micrographs of PTA-stained synapses in P14 WT and Gpr158 KO CA3 SL. Enlarged images show boxed regions. (G, H) Quantification of PSD length (WT 0.29 ± 0.01 µm (N=3 mice, n=121 PSDs) vs KO 0.22 ± 0.005 µm (N=3, n=221)) [G], and AZ length (WT 0.27 ± 0.01 µm (N=3 mice, n=121 AZs) vs KO 0.20 ± 0.005 µm (N=3, n=221)) [H]. ****p<0.0001, Mann-Whitney test. (I, J) Quantification of DP number per synapse (WT 3.31 ± 0.11 (N=3 mice, n=54 DPs) vs KO 2.1 ± 0.11 (N=3, n=49)) [I], and DP area (WT 1961 ± 46.5 nm2 (N=3 mice, n=212 DPs) vs KO 1588 ± 47.9 nm2 (N=3, n=115)) [J]. ****p<0.0001, Mann-Whitney test. Bar graphs show mean ± SEM. Scale bar in (A) 1 µm; (D) 0.2 µm; (F) 0.1 µm. See also Figure S6.
Figure 7.
Figure 7.. GPR158 regulates MF-CA3 synaptic transmission
(A) Representative sEPSC traces from CA3 pyramidal neurons in P21 WT (grey) and Gpr158 KO (red) acute hippocampal slices. (B) Cumulative distribution of sEPSC inter-event intervals in WT and Gpr158 KO CA3 neurons. (C) Quantification of sEPSC frequency (WT 4.61±0.75 Hz (N=3 mice, n=18 cells) vs KO 3.10±0.62 Hz (N=3, n=19)). *p<0.05, Mann-Whitney test. (D) Cumulative distribution of sEPSC amplitudes in WT and Gpr158 KO CA3 neurons. (E) Quantification of sEPSC amplitude (WT 56.7±3.7 pA (N=3 mice, n=18 cells) vs KO 44.3±3.1 pA (N=3, n=19)). **p<0.01, Mann Whitney test. (F) Representative traces and quantification of AMPAR-mediated EPSC amplitude at MF-CA3 synapses (WT 303.4±45.8 pA (N=3 mice, n=18 cells) vs KO 154.6±15.9 pA (N=3, n=19)). *p<0.05, Mann Whitney test. (G) Representative traces and quantification of NMDAR-mediated EPSC amplitude at MF-CA3 synapses (WT 78.5±11.8 pA (N=3 mice, n=9 cells) vs KO 47.8±5.3 pA (N=3, n=9)). *p<0.05, Mann Whitney test. (H) AMPAR/NMDAR ratio (WT 4.11±0.49 (N=3 mice, n=9 cells) vs KO 3.41±0.43 (N=3, n=9)). NS, p=0.302. Two-tailed Student’s t-test. (I) Representative traces and quantification of paired pulse ratio of MF-CA3 synapses (N=3 mice, n=18 cells). ***p<0.001, **p<0.01, *p<0.05, Mann Whitney test. (J) Representative traces and quantification of paired pulse ratio of A/C-CA3 synapses (N=3, n=12 cells). NS, p>0.05. Two tailed Student’s t-test. Bar graphs show mean ± SEM. See also Figure S7.

References

    1. Acuna C, Liu X, and Südhof TC (2016). How to Make an Active Zone: Unexpected Universal Functional Redundancy between RIMs and RIM-BPs. Neuron 91, 792–807. - PubMed
    1. Allen NJ, Bennett ML, Foo LC, Wang GX, Chakraborty C, Smith SJ, and Barres BA (2012). Astrocyte glypicans 4 and 6 promote formation of excitatory synapses via GluA1 AMPA receptors. Nature 486, 410–414. - PMC - PubMed
    1. Anderson GR, Maxeiner S, Sando R, Tsetsenis T, Malenka RC, and Südhof TC (2017). Postsynaptic adhesion GPCR latrophilin-2 mediates target recognition in entorhinal-hippocampal synapse assembly. J Cell Biol 216, 3831–3846. - PMC - PubMed
    1. Ango F, di Cristo G, Higashiyama H, Bennett V, Wu P, and Huang ZJ (2004). Ankyrin- Based Subcellular Gradient of Neurofascin, an Immunoglobulin Family Protein, Directs GABAergic Innervation at Purkinje Axon Initial Segment. Cell 119, 257–272. - PubMed
    1. Bjarnadóttir TK, Fredriksson R, and Schiöth HB (2005). The gene repertoire and the common evolutionary history of glutamate, pheromone (V2R), taste(1) and other related G protein-coupled receptors. Gene 362, 70–84. - PubMed

Publication types

Substances