. 2018 Oct 16;49(4):666-677.e6.
doi: 10.1016/j.immuni.2018.07.015. Epub 2018 Oct 2.

Regulatory T Cells Promote Macrophage Efferocytosis during Inflammation Resolution

Affiliations

Regulatory T Cells Promote Macrophage Efferocytosis during Inflammation Resolution

Jonathan D Proto et al. Immunity. .

Abstract

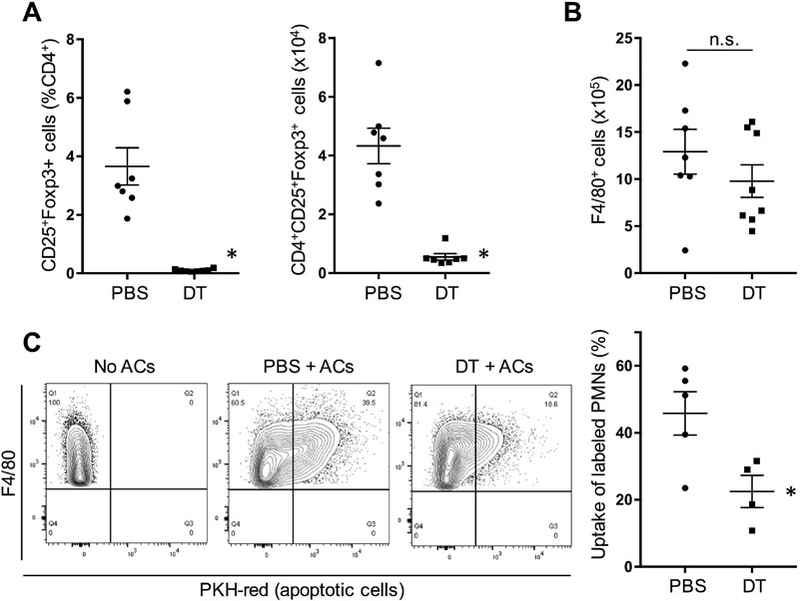
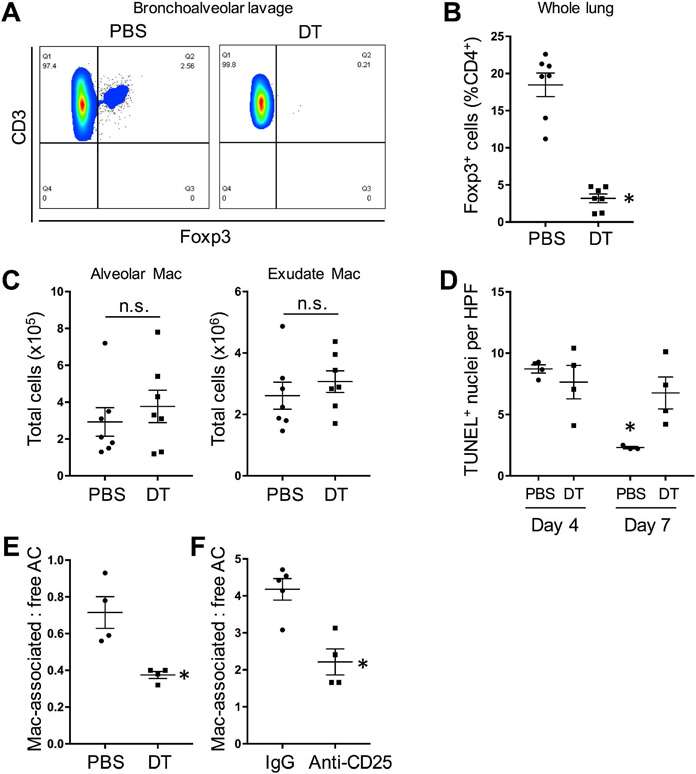
Regulatory T (Treg) cell responses and apoptotic cell clearance (efferocytosis) represent critical arms of the inflammation resolution response. We sought to determine whether these processes might be linked through Treg-cell-mediated enhancement of efferocytosis. In zymosan-induced peritonitis and lipopolysaccharide-induced lung injury, Treg cells increased early in resolution, and Treg cell depletion decreased efferocytosis. In advanced atherosclerosis, where defective efferocytosis drives disease progression, Treg cell expansion improved efferocytosis. Mechanistic studies revealed the following sequence: (1) Treg cells secreted interleukin-13 (IL-13), which stimulated IL-10 production in macrophages; (2) autocrine-paracrine signaling by IL-10 induced Vav1 in macrophages; and (3) Vav1 activated Rac1 to promote apoptotic cell engulfment. In summary, Treg cells promote macrophage efferocytosis during inflammation resolution via a transcellular signaling pathway that enhances apoptotic cell internalization. These findings suggest an expanded role of Treg cells in inflammation resolution and provide a mechanistic basis for Treg-cell-enhancement strategies for non-resolving inflammatory diseases.

Keywords: efferocytosis; inflammation resolution; macrophages; regulatory T cells.


Figures

Figure 1.
Figure 1.. Treg cell depletion following zymosan-induced peritonitis reduces the efferocytic capacity of peritoneal macrophages.
Foxp3-human DTR mice were injected i.p. with 0.1 mg zymosan at day 0 and then with 50 µg/kg DT at day 4 and 15 µg/kg DT at days 6 and 8. The vehicle control for DT was PBS. (A-B) Peritoneal lavage fluid of one cohort of DT and PBS mice sacrificed at day 11 was analyzed for Treg cells as either percent of CD4 that were CD25+ Foxp3+ or as absolute number per mouse and for the total number of peritoneal F4/80+ macrophages (n = 7 mice per group; *P < 0.05, 2-tailed Student’s t test; n.s., nonsignificant). Data displayed represent one of 5 independent experiments and are means + SEM. (C) At day 11, another cohort of DT and PBS mice was injected i.p. with PKH-red-labeled apoptotic neutrophils (ACs), and 45 min later lavage fluid was analyzed by flow for the percentage of F4/80+ macrophages that had incorporated the labeled neutrophils (n = 4–5 mice per group; *P < 0.05, 2-tailed Student’s t test). Data displayed represent one of 2 independent experiments and are means + SEM.
Figure 2.
Figure 2.. Treg cell depletion decreases efferocytosis by macrophages in LPS-induced acute lung injury (ALI).
Foxp3-human DTR mice were treated with intranasal LPS on day 0 and then given DT injections (or PBS) on day 1 (A-C, E) or days 1, 3, and 5 (D). (A) Representative flow cytometry plots of Foxp3+ Treg cells in the bronchoalveolar lavage fluid of PBS- and DT-treated mice at day 4. Data displayed represent one of 3 independent experiments. (B) Quantification of percent of Foxp3+ T cells in whole lung of PBS- and DT-treated mice at day 4 (n = 7 mice per group; *P < 0.05, 2-tailed Student’s t test). Data are represented as means + SEM. (C) Quantification of alveolar and exudate macrophages (Mac) of PBS- and DT-treated mice at day 4 (n = 7 mice per group; n.s., not significant by 2-tailed Student’s t test). (D) Quantification of TUNEL+ cells in lung sections per high-power field (HPF) of mice at days 4 and 7 (n = 3–4 mice per group; *P < 0.05 vs. all other groups, two-way ANOVA, Sidak’s multiple comparisons test). Data are represented as means + SEM. (E) Quantification of day 4 lung tissue for TUNEL+ apoptotic cells (AC) that were either associated with F4/80+ macrophages or not associated with macrophages (“free”) (n = 4 mice per group; *P < 0.05, 2-tailed Student’s t test). Data are represented as means + SEM. (F) As in (E), except Treg cells were depleted in LPS-ALI wild-type mice using anti-CD25 antibody (with IgG as control), as described in Methods; see Supplemental Figure 2 (n = 4–5 mice per group; *P < 0.05, 2-tailed Student’s t test). Data displayed represent one of 2 independent experiments and are means + SEM. Please also see Figure S1.
Figure 3.
Figure 3.. Macrophages from Treg cell-depleted mice show decreased AC uptake subsequent to binding and impaired Rac1 activation.
(A) Macrophages were isolated at day 11 from the peritoneal lavage fluid of zymosan-treated Foxp3-hDTR mice treated with PBS or DT, as in Figure 1. The cells were then incubated with labeled apoptotic cells at 37oC or 4oC (n = 4 mice per group; *P < 0.05, n.s., not significant by 2-tailed Student’s t test). Data displayed represent one of 2 independent experiments and are means + SEM. (B) A similar set of macrophages was incubated with or without polystyrene beads for 15 mins and then assayed for GTP-bound Rac1 (n = 4 mice per group; *P < 0.05 vs. all other groups, two-way ANOVA, Sidak’s multiple comparisons test). Data displayed represent one of 2 independent experiments and are means + SEM. (C) Bone marrow-derived macrophages were incubated with or without splenic Treg cells for 48 h and then assayed for efferocytosis (37oC) or apoptotic cell binding (4oC) (n = 3 wells; *P < 0.05, n.s., not significant by 2-tailed Student’s t test). Data displayed represent one of 3 independent experiments and are means + SEM. (D) As in C, except GTP-bound Rac1 was assayed before or 5 or 10 min after the addition of beads (n = 4 wells; *P < 0.05 vs. PBS/time 0 and **P < 0.05 for Treg cell vs. Veh, two-way ANOVA, Sidak’s multiple comparisons test). Data displayed represent one of 2 independent experiments and are means + SEM. Please also see Figure S2.
Figure 4.
Figure 4.. Treg cell-mediated enhancement of efferocytosis requires macrophage IL-10 expression.
(A) Efferocytosis of i.p.-injected labeled neutrophils was assayed at day 11 in zymosan-treated wild-type (WT) or Il10−/− mice as in Figure 1C (n = 9–10 mice per group; *P < 0.05, 2-tailed Student’s t test). Data are represented as means + SEM. (B) WT mice were injected i.p., with neutralizing antibody to IL-10 or control IgG, and 48 hours later, peritoneal macrophages were harvested and then assayed for efferocytosis ex vivo (n = 3 wells per condition; *P < 0.05, 2-tailed Student’s t test). Data are represented as means + SEM. (C) WT mice were injected i.p. with Treg cells from WT or Il10−/− mice or vehicle control (PBS). Peritoneal macrophages from these mice were than assayed for efferocytosis ex vivo (n = 5 mice per group; *P < 0.05 vs. PBS; n.s., non-significant, one-way ANOVA, Tukey’s post-hoc analysis). Data displayed represent one of 2 independent experiments and are means + SEM. (D) Bone marrow-derived macrophages from WT, or Il10−/− mice were incubated with or without splenic Treg cells from WT mice and then assayed for efferocytosis in vitro as in Figure 3C (n = 3 wells; *P < 0.05 vs. all other groups, two-way ANOVA, Sidak’s multiple comparisons test). Data are represented as means + SEM. (E) Bead-induced GTP-bound Rac1 was assayed in WT or Il10−/− macrophages incubated with or without Treg cells, as in Figure 3D (n = 4 wells; *P < 0.05 vs. no beads and **P < 0.05 for the indicated pairings, two-way ANOVA, Sidak’s multiple comparisons test). Data displayed represent one of 2 independent experiments and are means + SEM. (F) WT or Il10−/− bone marrow-derived macrophages were incubated with or without Treg cells and then assayed for Il10 mRNA (n = 3–4 wells; *P < 0.05, 2-tailed Student’s t test) or Bcl3 mRNA (n = 3–4 wells, *P < 0.05 vs. all other groups, two-way ANOVA, Sidak’s multiple comparisons test). Data are represented as means + SEM. (G) Bone marrow-derived macrophages were pre-treated for 48 h with the indicated concentrations of rIL-10 and then assayed for efferocytosis (n = 3 wells; *P < 0.05 vs. Veh, one-way ANOVA, Tukey’s post-hoc analysis). Data are represented as means + SEM. (H) Bone marrow-derived macrophages were pre-treated for 48 h with 10 ng/ml rIL-10 and then assayed for GTP-bound Rac1 10 mins after exposure to beads as in Figure 4D (n = 3 wells; *P < 0.001 vs. no beads and **P < 0.001 for rIL-10 vs. Veh, two-way ANOVA, Sidak’s multiple comparisons test). Data displayed represent one of 2 independent experiments and are means + SEM. Please also see Figure S3.
Figure 5.
Figure 5.. Treg cell expansion improves lesional efferocytosis in Western diet (WD)-fed Ldlr−/− mice in an IL-10-dependent manner.
Ldlr−/− mice were fed WD for 12 weeks and then treated with a complex of recombinant IL-2 and anti-IL2 (IL2C) or vehicle control for 3 consecutive days and then once every five days thereafter for a 3-week period, during which time the mice were continued on WD. The mice were also treated twice weekly with an IL-10 neutralizing antibody (nAb) or an IgG control antibody during this 3-week period. (A-B) Circulating Treg cells 5 days after initiation of the treatment and splenic Treg cells 3 weeks after antibody treatment in the four groups of mice (n = 7–13 mice per group; *P < 0.05 vs. groups without IL-2C, one-way ANOVA, Sidak’s multiple comparisons test). Data are represented as means + SEM. (C) Splenocytes from the four groups of mice were assayed for phospho-STAT3 by flow cytometry and quantified as mean fluorescence intensity (MFI) (n = 7–13 mice per group; *P < 0.05 vs. all other groups, one-way ANOVA, Sidak’s multiple comparisons test). Data are represented as means + SEM. (D) Aortic root lesions of the four groups of mice were assayed for in situ efferocytosis by quantifying the ratio of apoptotic cells (AC) that were associated with lesional macrophages or free (n = 7–13 mice per group; *P < 0.05 vs. all other groups, one-way ANOVA, Sidak’s multiple comparisons test). Data are represented as means + SEM. Please also see Figure S4.
Figure 6.
Figure 6.. Treg cell-derived IL-13 stimulates macrophage efferocytosis in an IL-10-dependent manner.
(A) Treg cells were isolated from spleens of wild type mice and incubated with the indicated stimuli overnight. Concentrated cell supernatants were assayed for IL-13 by ELISA (n = 3 wells; *P < 0.001, 2-tailed Student’s t test). Data displayed represent one of 3 independent experiments and are means + SEM. (B) Bone marrow-derived macrophages were incubated with the indicated concentrations of rIL-13 for 2 hours and then assayed for Il10 mRNA (n = 4 wells; *P < 0.05 vs. Veh, one-way ANOVA, Sidak’s multiple comparisons test). Data are represented as means + SEM. (C) Bone marrow-derived macrophages from WT or Il10rb−/− mice were incubated for 2 days with 10 ng/ml rIL-13 or vehicle control and then assayed for efferocytosis (n = 3 wells; *P < 0.05 vs. WT/Veh, two-way ANOVA, Sidak’s multiple comparisons test). Data are represented as means + SEM. (D) Left: Macrophages were co-cultured with either WT or Il13−/− Treg cells and then assayed for efferocytosis. Right: Macrophages were plated on the upper chamber inserts of a 24-well Transwell dish with either media, WT Treg cells, or IL13−/− Treg cells in the bottom chambers. After 48 hours, the upper chamber inserts (macrophages) were transferred to a well containing fresh media, and efferocytosis was assayed (n = 3–4 wells per group; *P < 0.05 vs. the other groups, one-way ANOVA, Sidak’s multiple comparisons test). Data displayed represent one of 2 independent experiments and are means + SEM. (E) Mice were injected i.p. with or without Treg cells and with anti-IL-13 or control IgG, as indicated. Peritoneal macrophages from these mice were than assayed for efferocytosis ex vivo (n = 6 wells; *P < 0.05 vs. the other groups, one-way ANOVA, Sidak’s multiple comparisons test). Data are represented as means + SEM. (F) Naïve Foxp3-human DTR mice were injected with PBS or 50 µg/kg DT at day 0 and then 15 µg/kg DT on the morning of day one. On the afternoon of day one, 5 × 10⁵ splenic Treg cells from WT or Il13−/− mice, or PBS control, were isolated and delivered intraperitoneally to the mice as indicated. After 48 hours, mice were injected i.p. with PKH-red-labeled apoptotic neutrophils, and 45 min later lavage fluid was analyzed by flow cytometry for the percentage of F4/80+ macrophages that had incorporated the labeled neutrophils (n = 4 mice per group; groups with different symbols are statistically different from each other, with p value at least <0.05 using two-way ANOVA, Sidak’s multiple comparisons). Data are represented as means + SEM. (G) Foxp3-human DTR mice were treated with intranasal LPS on day 0 and then given DT injections (or PBS) on day one. 2 × 10⁶ WT or Il13−/− Treg cells (or PBS) were delivered intranasally to mice on the afternoon of day one. TUNEL+ apoptotic cells (AC) that were either associated with Mac-3+ macrophages or not associated with macrophages (“free”) were quantified (n = 3–4 mice per group; groups with different symbols are statistically different from each other, with P value at least <0.05 by two-way ANOVA, Sidak’s multiple comparisons). Data are represented as means + SEM. Please also see Figure S5 and S6.
Figure 7.
Figure 7.. IL-10 and Treg cells induce the Rac1 GEF Vav1 in macrophages, which is necessary for the enhancement of Rac1 activation and efferocytosis.
(A) Bone marrow-derived macrophages were incubated with rIL-10 or vehicle control in the absence or presence of the STAT3 inhibitor, 6-nitro-benzo[b]thiophene-1,1-dioxide (“Stattic”, 6 µM) (n = 3 wells; *P < 0.05 vs. all other groups, two-way ANOVA, Sidak’s multiple comparisons test). Data are represented as means + SEM. (B) WT or Il10−/− macrophages were incubated with or without Treg cells and then assayed for Vav1 mRNA (n = 3–4 wells; *P < 0.05 vs. all other groups, twoway ANOVA, Sidak’s multiple comparisons test). Data are represented as means + SEM. (C) Macrophages treated with Vav1 or scrambled siRNA were incubated with or without IL-10 and then assayed for efferocytosis (n = 3 wells; *P < 0.05, two-way ANOVA, Sidak’s multiple comparisons test). Data displayed represent one of 2 independent experiments and are means + SEM. (D) Macrophages treated with Vav1 or scrambled siRNA were incubated with or without apoptotic cells and/or IL-10 and then assayed for GTP-bound Rac1 (n = 4 wells; *P < 0.05 vs. all other groups, one-way ANOVA, Sidak’s multiple comparisons test). Data displayed represent one of 2 independent experiments and are means + SEM. Please also see Figure S7.

Comment in

References

    1. Aggarwal NR, Tsushima K, Eto Y, Tripathi A, Mandke P et al. (2014). Immunological priming requires regulatory T cells and IL-10-producing macrophages to accelerate resolution from severe lung inflammation. J. Immunol 192, 4453–4464. - PMC - PubMed
    1. Ait-Oufella H, Salomon BL, Potteaux S, Robertson AK, Gourdy P et al. (2006). Natural regulatory T cells control the development of atherosclerosis in mice. Nat. Med 12, 178–180. - PubMed
    1. Arandjelovic S & Ravichandran KS (2015). Phagocytosis of apoptotic cells in homeostasis. Nat. Immunol 16, 907–917. - PMC - PubMed
    1. Arpaia N, Green JA, Moltedo B, Arvey A, Hemmers S et al. (2015). A distinct function of regulatory T cells in tissue protection. Cell 162, 1078–1089. - PMC - PubMed
    1. Boyman O, Kovar M, Rubinstein MP, Surh CD, & Sprent J (2006). Selective stimulation of T cell subsets with antibody-cytokine immune complexes. Science 311, 1924–1927. - PubMed

Publication types

MeSH terms