

A Novel Intervention Including Individualized Nutritional Recommendations Reduces Hemoglobin A1c Level, Medication Use, and Weight in Type 2 Diabetes
- PMID: 30291062
- PMCID: PMC6238887
- DOI: 10.2196/diabetes.6981
A Novel Intervention Including Individualized Nutritional Recommendations Reduces Hemoglobin A1c Level, Medication Use, and Weight in Type 2 Diabetes
Abstract
Background: Type 2 diabetes (T2D) is typically managed with a reduced fat diet plus glucose-lowering medications, the latter often promoting weight gain.
Objective: We evaluated whether individuals with T2D could be taught by either on-site group or remote means to sustain adequate carbohydrate restriction to achieve nutritional ketosis as part of a comprehensive intervention, thereby improving glycemic control, decreasing medication use, and allowing clinically relevant weight loss.
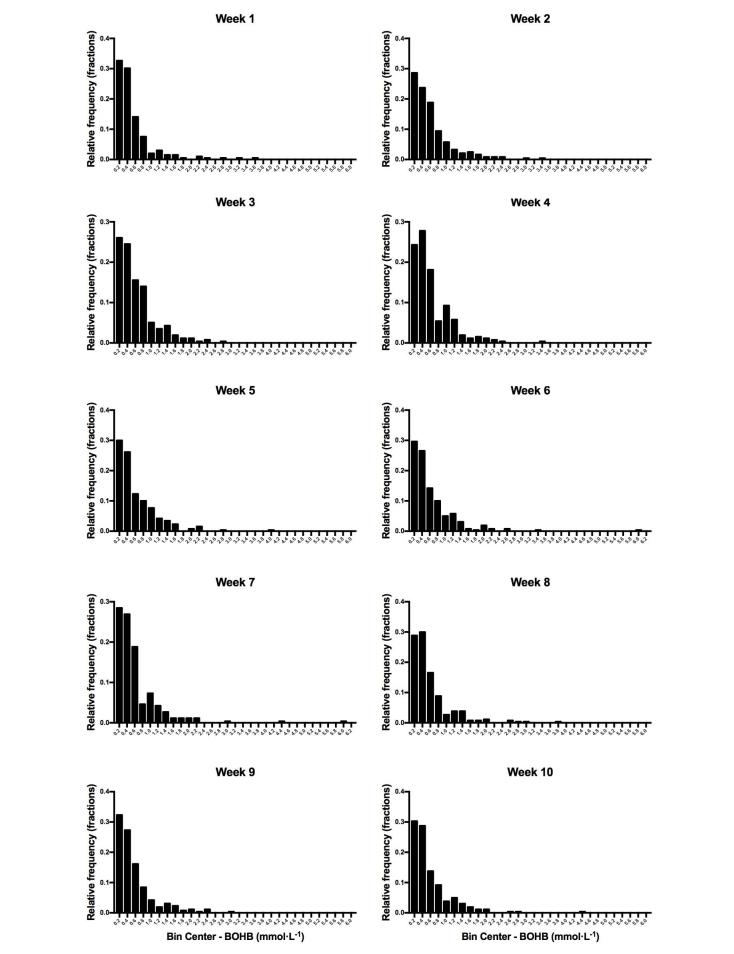
Methods: This study was a nonrandomized, parallel arm, outpatient intervention. Adults with T2D (N=262; mean age 54, SD 8, years; mean body mass index 41, SD 8, kg·m-2; 66.8% (175/262) women) were enrolled in an outpatient protocol providing intensive nutrition and behavioral counseling, digital coaching and education platform, and physician-guided medication management. A total of 238 participants completed the first 10 weeks. Body weight, capillary blood glucose, and beta-hydroxybutyrate (BOHB) levels were recorded daily using a mobile interface. Hemoglobin A1c (HbA1c) and related biomarkers of T2D were evaluated at baseline and 10-week follow-up.
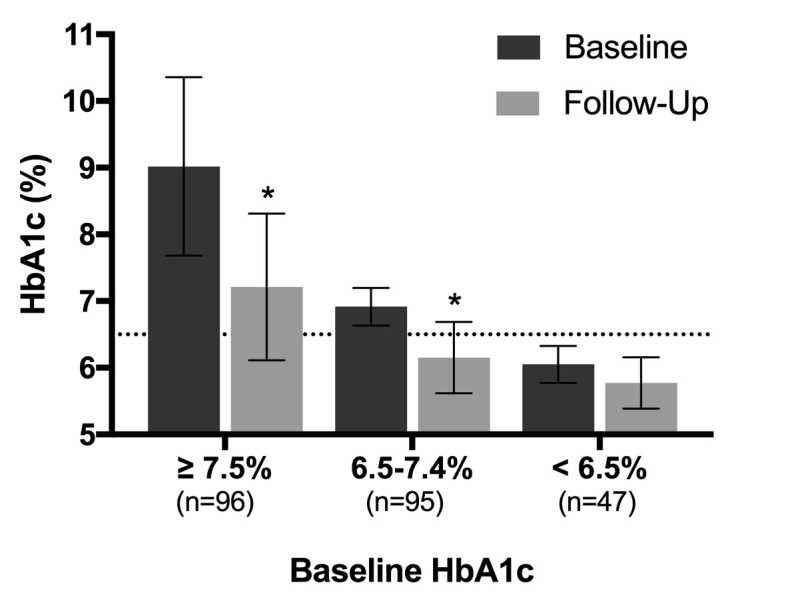
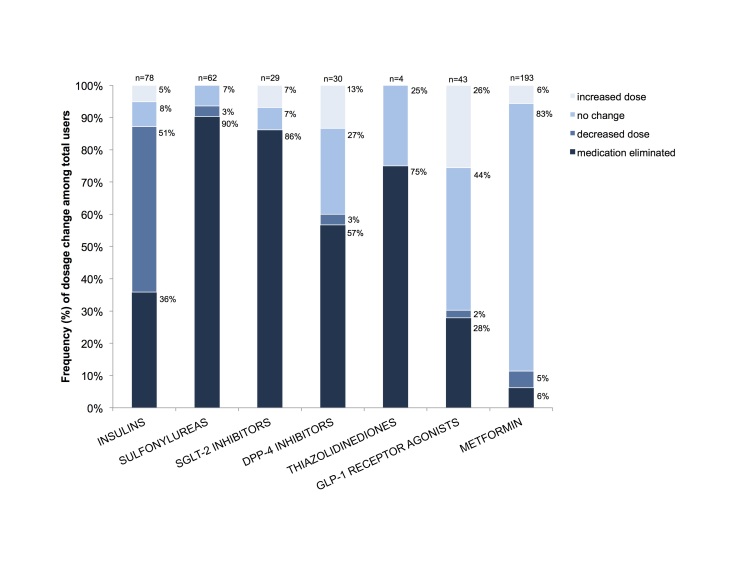
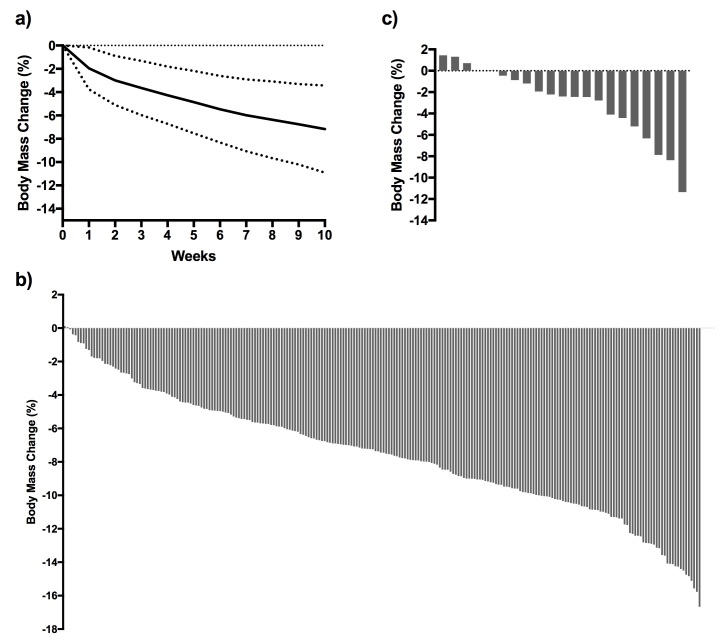
Results: Baseline HbA1c level was 7.6% (SD 1.5%) and only 52/262 (19.8%) participants had an HbA1c level of <6.5%. After 10 weeks, HbA1c level was reduced by 1.0% (SD 1.1%; 95% CI 0.9% to 1.1%, P<.001), and the percentage of individuals with an HbA1c level of <6.5% increased to 56.1% (147/262). The majority of participants (234/262, 89.3%) were taking at least one diabetes medication at baseline. By 10 weeks, 133/234 (56.8%) individuals had one or more diabetes medications reduced or eliminated. At follow-up, 47.7% of participants (125/262) achieved an HbA1c level of <6.5% while taking metformin only (n=86) or no diabetes medications (n=39). Mean body mass reduction was 7.2% (SD 3.7%; 95% CI 5.8% to 7.7%, P<.001) from baseline (117, SD 26, kg). Mean BOHB over 10 weeks was 0.6 (SD 0.6) mmol·L-1 indicating consistent carbohydrate restriction. Post hoc comparison of the remote versus on-site means of education revealed no effect of delivery method on change in HbA1c (F1,260=1.503, P=.22).
Conclusions: These initial results indicate that an individualized program delivered and supported remotely that incorporates nutritional ketosis can be highly effective in improving glycemic control and weight loss in adults with T2D while significantly decreasing medication use.
Keywords: Hb A1c; ketosis; mobile health; type 2 diabetes; weight loss.
©Amy L McKenzie, Sarah J Hallberg, Brent C Creighton, Brittanie M Volk, Theresa M Link, Marcy K Abner, Roberta M Glon, James P McCarter, Jeff S Volek, Stephen D Phinney. Originally published in JMIR Diabetes (http://diabetes.jmir.org), 07.03.2017.
Conflict of interest statement
Conflicts of Interest: Virta Health Corp. funded this study, and all authors have a financial relationship with the study sponsor. ALM, SJH, BCC, BMV, TML, MKA, RMG, JPM, and SJP are employed by Virta. JSV serves as a consultant to Virta. JSV and SDP are cofounders of Virta. All authors have stock options in Virta. The organization contributed to study design, the collection, analysis, and interpretation of data, and approval of the final manuscript. Potentially related conflicts of interest are as follows: SDP serves as a consultant to Atkins Nutritionals and has received royalties as an author of two science-based low-carbohydrate books published by Beyond Obesity LLC. JSV serves as a consultant to Atkins Nutritionals, Metagenics, and UCAN, has received grants from the National Dairy Council and Malaysian Palm Oil Board, and has received royalties as an author of two science-based low-carbohydrate books published by Beyond Obesity LLC. SJH serves as a consultant to Atkins Nutritionals.
Figures

References
-
- UK Prospective Diabetes Study Group Intensive blood-glucose control with sulphonylureas or insulin compared with conventional treatment and risk of complications in patients with type 2 diabetes (UKPDS 33). UK Prospective Diabetes Study (UKPDS) Group. Lancet. 1998 Sep 12;352(9131):837–53. - PubMed
-
- Karter AJ, Nundy S, Parker MM, Moffet HH, Huang ES. Incidence of remission in adults with type 2 diabetes: the diabetes & aging study. Diabetes Care. 2014 Dec;37(12):3188–95. doi: 10.2337/dc14-0874. http://europepmc.org/abstract/MED/25231895 - DOI - PMC - PubMed
-
- Turner RC, Cull CA, Frighi V, Holman RR. Glycemic control with diet, sulfonylurea, metformin, or insulin in patients with type 2 diabetes mellitus: progressive requirement for multiple therapies (UKPDS 49). UK Prospective Diabetes Study (UKPDS) Group. J Am Med Assoc. 1999 Jun 02;281(21):2005–12. - PubMed
LinkOut - more resources
Full Text Sources
Medical
Miscellaneous
