. 2018 Nov 21;38(47):10129-10142.
doi: 10.1523/JNEUROSCI.1131-18.2018. Epub 2018 Oct 5.

Temporal Contingencies Determine Whether Adaptation Strengthens or Weakens Normalization

Affiliations

Temporal Contingencies Determine Whether Adaptation Strengthens or Weakens Normalization

Amir Aschner et al. J Neurosci. .

Abstract

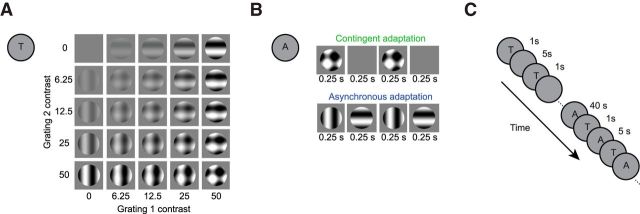
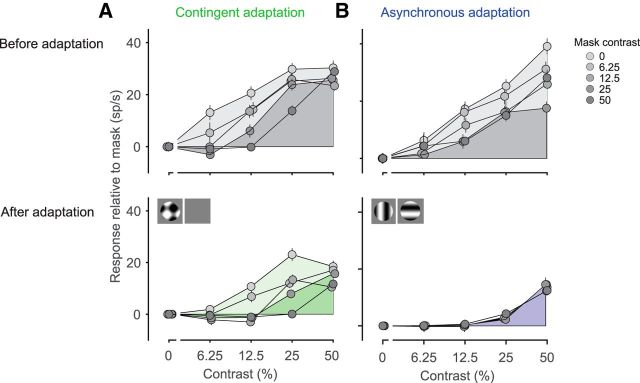
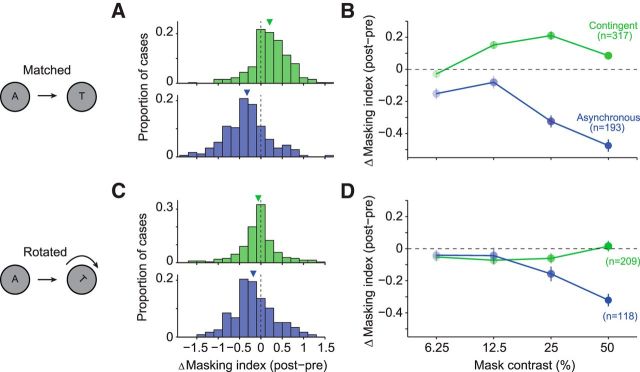
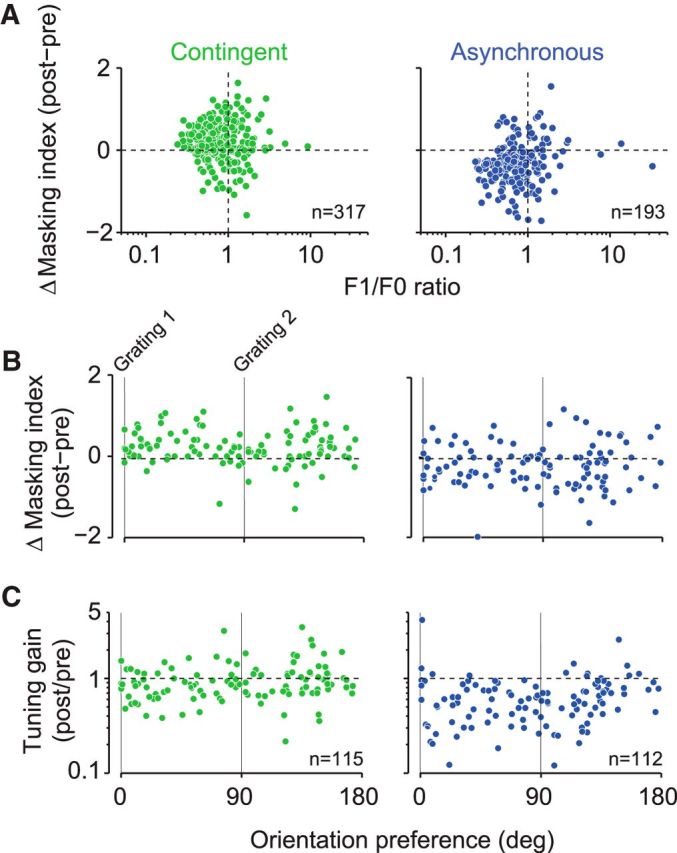
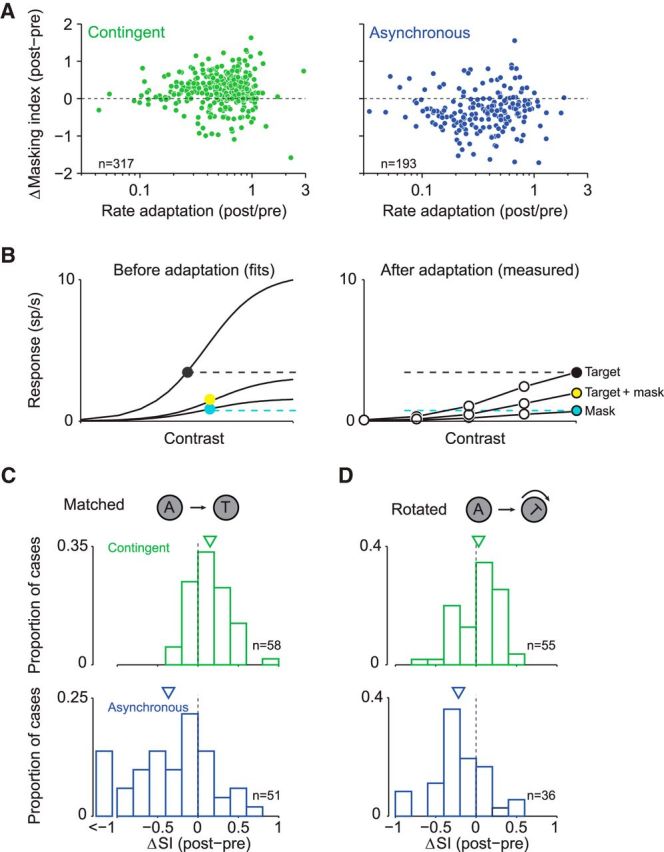
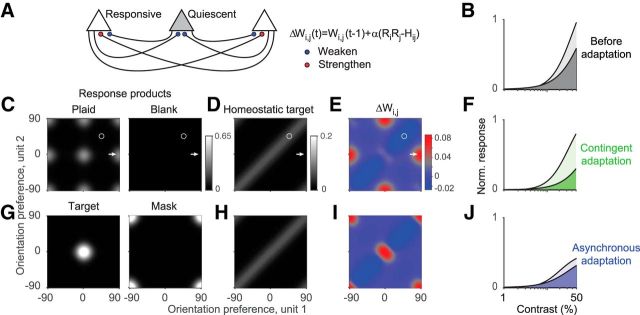
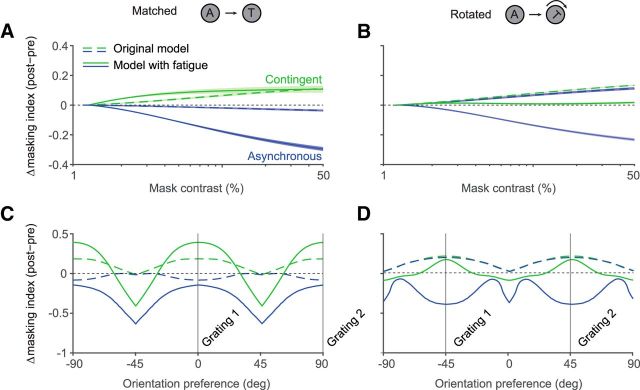
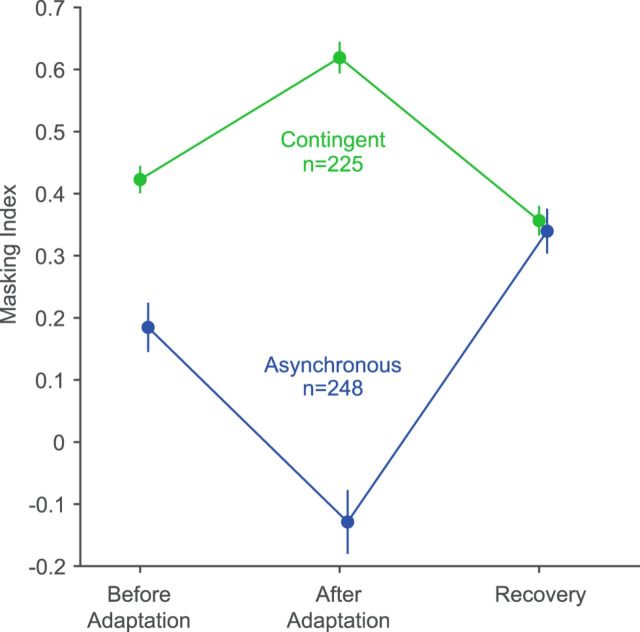
A fundamental and nearly ubiquitous feature of sensory encoding is that neuronal responses are strongly influenced by recent experience, or adaptation. Theoretical and computational studies have proposed that many adaptation effects may result in part from changes in the strength of normalization signals. Normalization is a "canonical" computation in which a neuron's response is modulated (normalized) by the pooled activity of other neurons. Here, we test whether adaptation can alter the strength of cross-orientation suppression, or masking, a paradigmatic form of normalization evident in primary visual cortex (V1). We made extracellular recordings of V1 neurons in anesthetized male macaques and measured responses to plaid stimuli composed of two overlapping, orthogonal gratings before and after prolonged exposure to two distinct adapters. The first adapter was a plaid consisting of orthogonal gratings and led to stronger masking. The second adapter presented the same orthogonal gratings in an interleaved manner and led to weaker masking. The strength of adaptation's effects on masking depended on the orientation of the test stimuli relative to the orientation of the adapters, but was independent of neuronal orientation preference. Changes in masking could not be explained by altered neuronal responsivity. Our results suggest that normalization signals can be strengthened or weakened by adaptation depending on the temporal contingencies of the adapting stimuli. Our findings reveal an interplay between two widespread computations in cortical circuits, adaptation and normalization, that enables flexible adjustments to the structure of the environment, including the temporal relationships among sensory stimuli.SIGNIFICANCE STATEMENT Two fundamental features of sensory responses are that they are influenced by adaptation and that they are modulated by the activity of other nearby neurons via normalization. Our findings reveal a strong interaction between these two aspects of cortical computation. Specifically, we show that cross-orientation masking, a form of normalization, can be strengthened or weakened by adaptation depending on the temporal contingencies between sensory inputs. Our findings support theoretical proposals that some adaptation effects may involve altered normalization and offer a network-based explanation for how cortex adjusts to current sensory demands.

Keywords: V1; adaptation; cross-orientation suppression; macaque.


Figures

Figure 1.
Figure 1.
Stimulus protocol. A, Ensemble of test stimuli (T). B, Temporal structure and form of the contingent and asynchronous adapters (A). C, Temporal structure of the experiment, which involved measuring responses before adaptation, adapting, and then measuring responses using a top-up/test paradigm.
Figure 2.
Figure 2.
Example neurons. A, Example unit for contingent adaptation. Top, Contrast–response functions for target stimuli presented in isolation or with masks of different contrasts (indicated by symbols with different shades of gray). Responses are measured relative to the response evoked by each mask. Fill indicates the AUC used to calculate the MI. Positions of the symbols along the abscissa have been jittered slightly to improve visibility. Bottom, Responses of the same cell after contingent adaptation. B, Example unit for asynchronous adaptation following the conventions of A. Error bars indicate 1 SEM.
Figure 3.
Figure 3.
Population summary. A, Change in MI for the 25% contrast mask (postadaptation values − preadaptation values) when test stimuli are matched in orientation to the adapter. Data for contingent adaptation are shown in green; those for asynchronous adaptation in blue. Values larger than zero indicate stronger masking; those less than zero indicate weaker masking. Arrowheads indicate mean of the distributions. B, Mean change in MI after contingent (green) or asynchronous (blue) adaptation as a function of mask contrast. C, D, Effects of contingent and asynchronous adaptation on test stimuli with orientation rotated by 45° from the adapter following the conventions of A and B. Error bars indicate 1 SEM.
Figure 4.
Figure 4.
Dependence of changes in masking on neuronal properties. A, Relationship between adaptation-induced changes in MI and phase sensitivity, as measured by the F1/F0 response ratio. Each dot represents effects for 25% contrast masks for one unit. B, Relationship between adaptation-induced changes in MI and each neuron's orientation preference, where 0° and 90° indicate preferences aligned with the component gratings (indicated by vertical thin black lines). C, Relationship between adaptation-induced changes in tuning gain and each neuron's orientation preference following the conventions of B.
Figure 5.
Figure 5.
Controlling for rate adaptation. A, Relationship between the change in MI and responsivity change measured as the ratio of response to the high-contrast target after versus before adaptation. Masking was measured using 25% contrast masks. Each dot indicates one unit. B, Method for calculating rate-matched SI. Filled symbols in the right panel indicate the measured responses to the 50% contrast target (black), the 50% contrast mask (cyan), and the plaid formed by their combination (yellow). Filled symbols in the left panel indicate the target and mask contrasts that evoked matched responses (indicated by dashed horizontal lines) and the plaid formed by their combination. C, Histogram of the change in rate-matched SI after contingent (green) and asynchronous (blue) adaptation. Arrowheads indicate distribution mean. D, Histogram of the change in rate-matched SI for test stimuli with orientation rotated by 45° from the adapters. Conventions are as in C.
Figure 6.
Figure 6.
Hebbian normalization model. A, Schematic of the normalization model and the learning rule (Westrick et al., 2016). The normalization signal received by each neuron arises from the weighted responses of other neurons in the population. The weights between neurons that are consistently coactivated (white triangles) are strengthened (red dots), whereas the weights are weakened between neurons that are driven asynchronously (blue dots). B, Simulated contrast–response function before adaptation to the target alone (light gray) and the target presented with a 50% mask (dark gray) for a neuron preferring the orientation of the target grating. C, Response products to the plaid contingent adapter. Lighter color indicates stronger response products. Arrow indicates neuron pair preferring 0° and 90°. Circle indicates neuron pair preferring 45°. D, Homeostatic target defined as the average response products to a uniform distribution of oriented gratings. Markers indicate the same neuron pairs as in C. E, Change in normalization weights after contingent adaptation. Markers indicate the same pairs as in C. F, Contrast–response function after contingent adaptation using the same convention as B. GJ, The same conventions as CF, but after asynchronous adaptation.
Figure 7.
Figure 7.
Model predictions for changes in masking after contingent or asynchronous adaptation. A, Left, Changes in MI in simulated neurons as a function of mask contrast after contingent (green) and asynchronous (blue) adaptation for test stimuli matched in orientation to the adapters. Dotted lines indicate mean of simulated population of model neurons averaged across all orientation preferences. Solid lines indicate mean of simulated population of neurons from the extended model (i.e., with a fatigue mechanism). Shading indicates SD across model neurons with different orientation preferences. B, Same as A for test stimuli offset in orientation from the adapters. Dashed curve for asynchronous adaptation has been scaled slightly for visualization. C, Change in MI for the 50% contrast mask as a function of model unit orientation preference for test stimuli matched in orientation to the adapter. D, Same as C for test stimuli offset in orientation from the adapters. Dashed curve for asynchronous adaptation has been scaled slightly for visualization.
Figure 8.
Figure 8.
Recovery from adaptation. The average MI is shown for the 25% contrast mask before adaptation, after contingent (green) or asynchronous (blue) adaptation, and 10–15 min later, after the continuous presentation of a gray screen. Adaptation-induced changes in masking dissipated entirely during the recovery period; in fact, they often showed a slight rebound effect, with masking in the recovery period slightly weaker (stronger) than the preadaptation measurements for contingent (asynchronous) adaptation. Error bars indicate 1 SEM. Contingent and asynchronous lines were separated by which adaptation paradigm was recorded first (both were always run back to back). Units shown are a subset of the full dataset, representing neurons with isolation that was stable throughout the recovery period.

Similar articles

Cited by

References

    1. Abbott LF, Nelson SB (2000) Synaptic plasticity: taming the beast. Nat Neurosci 3:1178–1183. 10.1038/81453 - DOI - PubMed
    1. Abbott LF, Regehr WG (2004) Synaptic computation. Nature 431:796–803. 10.1038/nature03010 - DOI - PubMed
    1. Barlow HB. (1990) A theory about the functional role and synaptic mechanism of visual aftereffects. In: Vision: coding and efficiency (Blakemore CB, ed), pp 363–375. New York: Cambridge University.
    1. Barlow HB, Földiák P (1989) Adaptation and decorrelation in the cortex. In: The computing neuron (Durbin R, Miall C, Mitchison G, eds), pp 54–72. New York: Addison-Wesley.
    1. Beck JM, Latham PE, Pouget A (2011) Marginalization in neural circuits with divisive normalization. J Neurosci 31:15310–15319. 10.1523/JNEUROSCI.1706-11.2011 - DOI - PMC - PubMed

Publication types

LinkOut - more resources