. 2019 Feb;17(2):356-369.
doi: 10.1158/1541-7786.MCR-18-0718. Epub 2018 Oct 5.

AXL Is a Putative Tumor Suppressor and Dormancy Regulator in Prostate Cancer

Affiliations

AXL Is a Putative Tumor Suppressor and Dormancy Regulator in Prostate Cancer

Haley D Axelrod et al. Mol Cancer Res. 2019 Feb.

Abstract

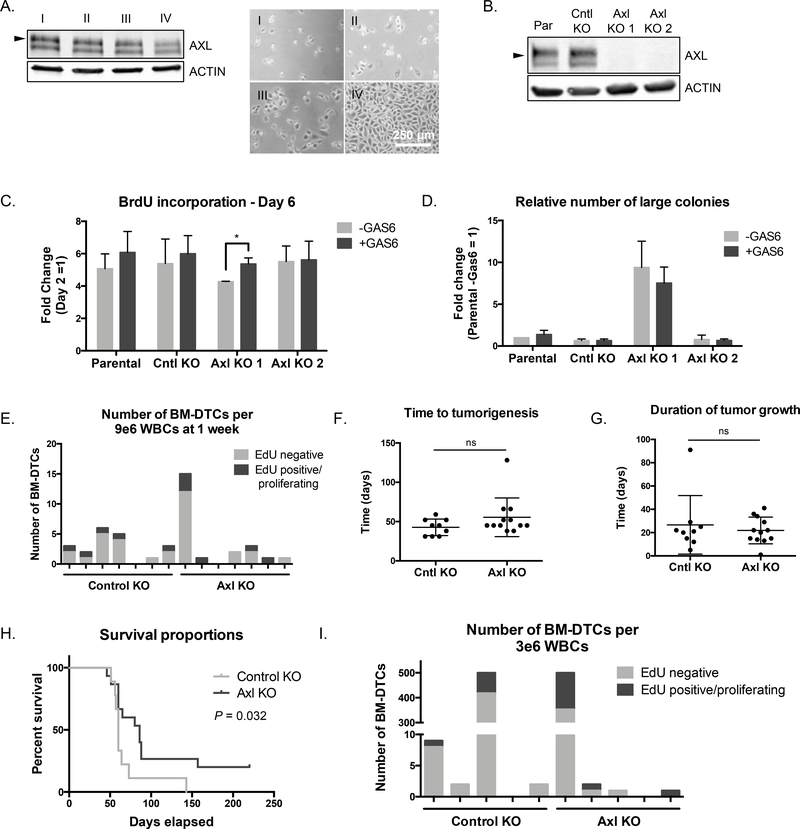
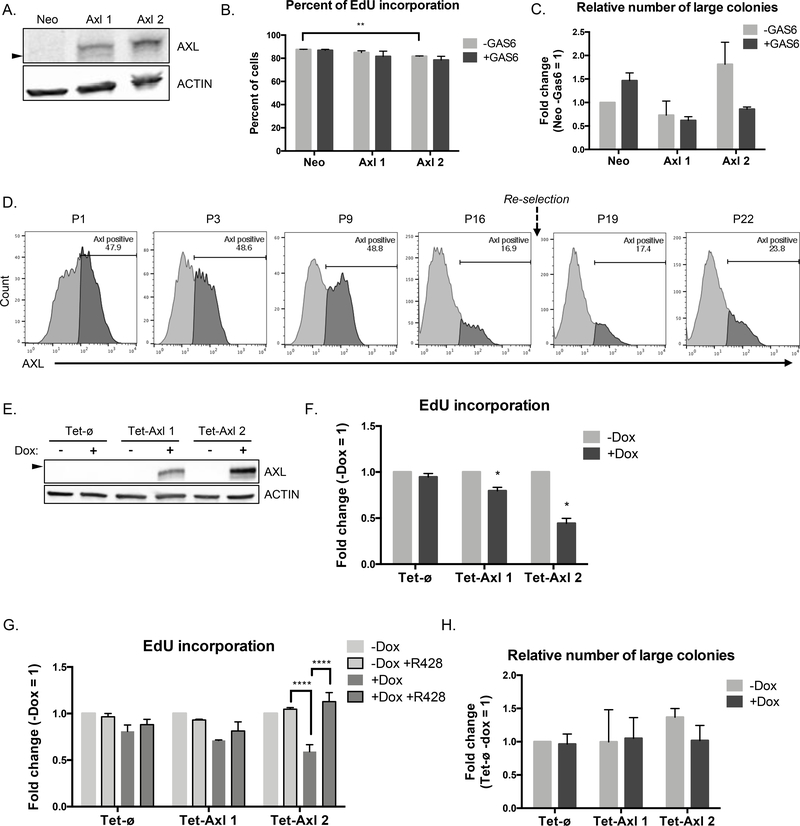
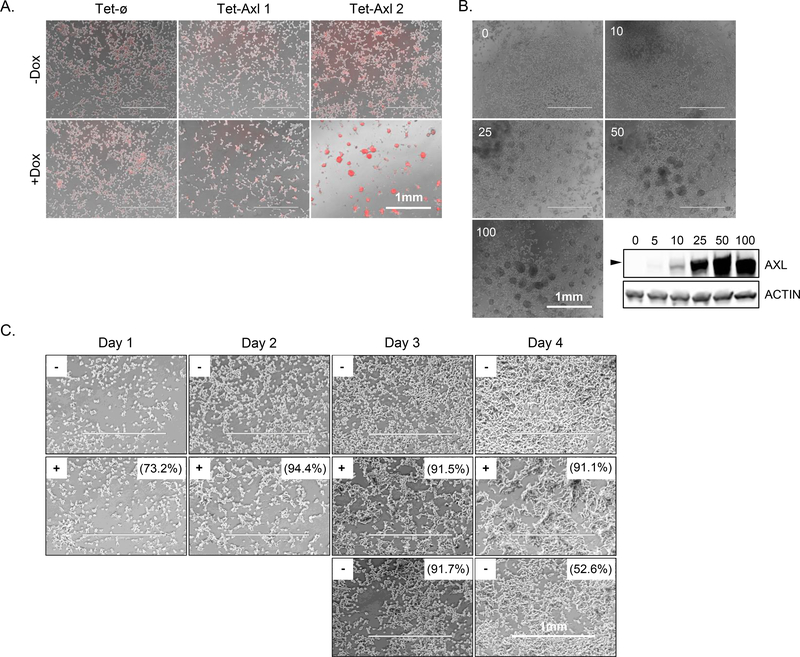
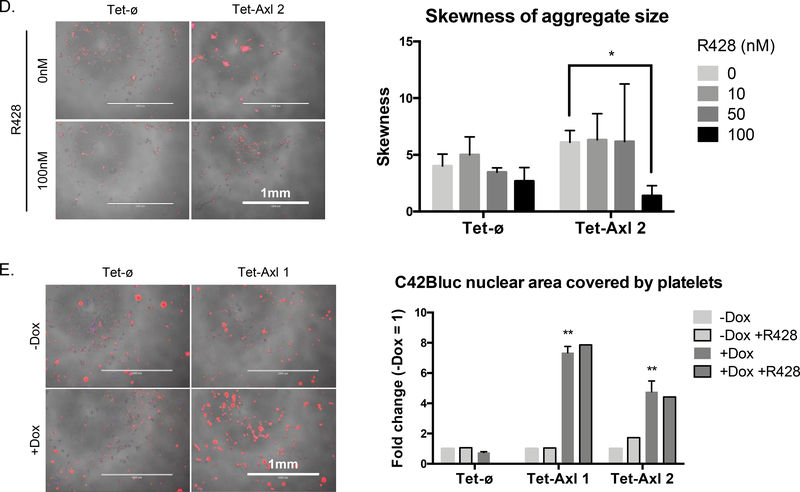
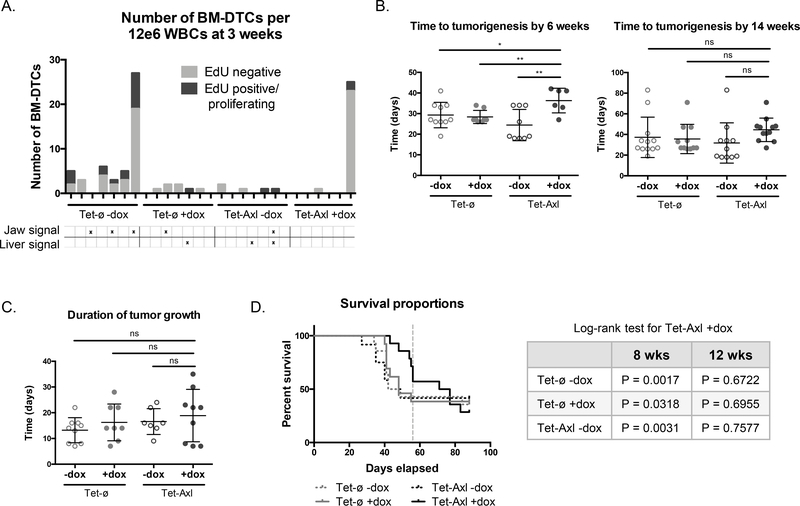
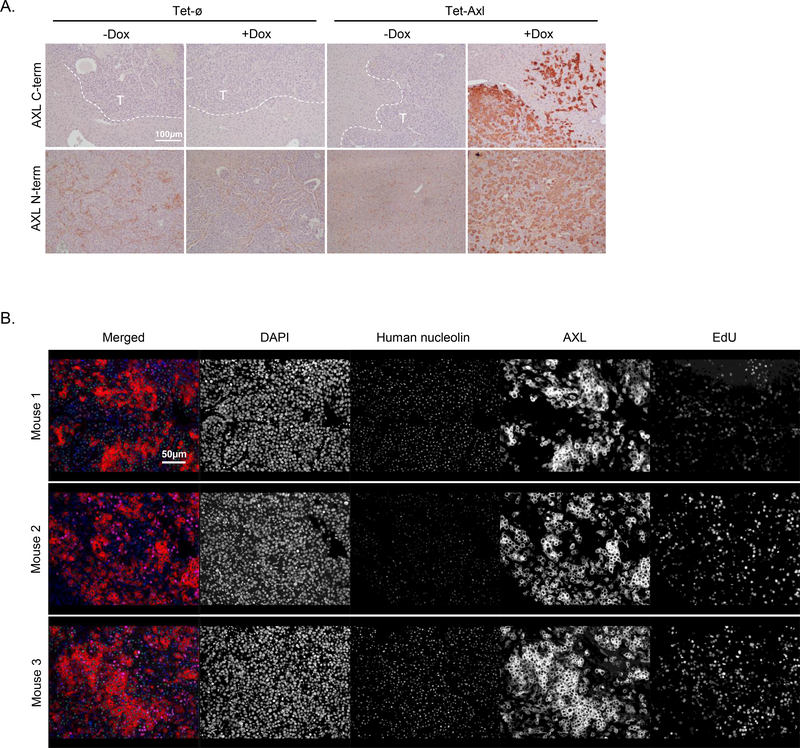
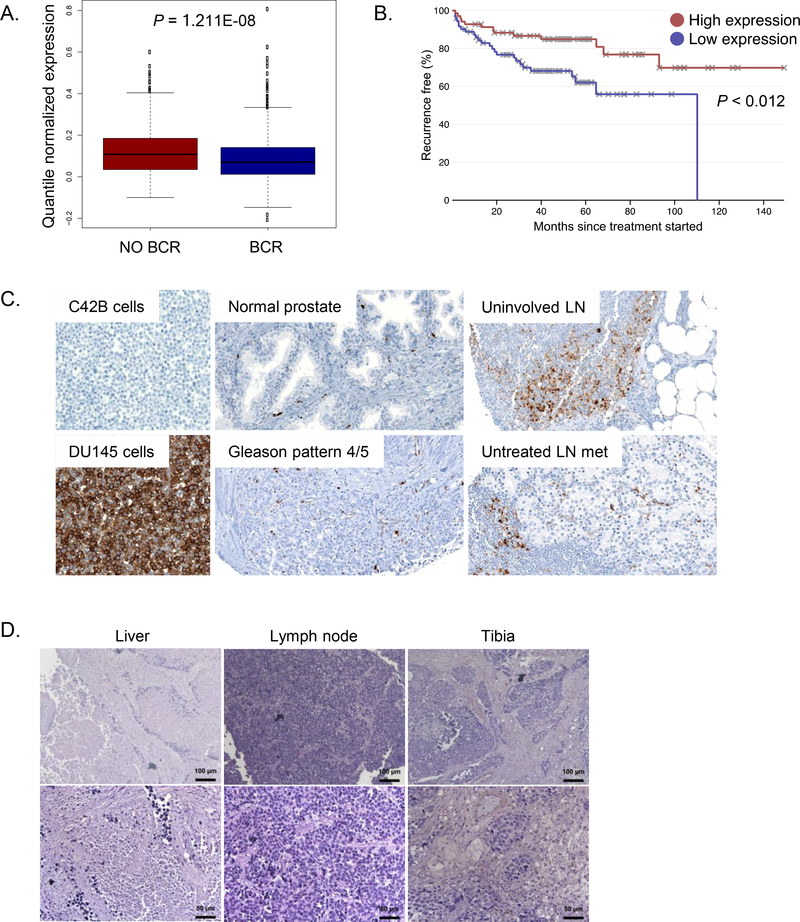
Prostate cancer bone metastasis remains lethal and incurable, and often arises years after elimination of the primary tumor. It is unclear what underlies the decades-long clinical latency before recurrence, but evidence points to the existence of dormant residual tumor cells that disseminated before the primary tumor was eliminated. To design therapies to prevent progression of disseminated tumor cells (DTC) into lethal metastases, it is crucial to understand the mechanism(s) underlying this dormancy. The current study functionally validated our previous observation that implicated the GAS6/AXL axis in mediating DTC dormancy in the bone marrow. AXL-null and AXL-overexpressing prostate cancer cell lines were generated to determine if AXL was necessary and/or sufficient for dormancy. Characterization of these cells in vitro and using in vivo mouse models of DTC growth demonstrated that AXL was indeed sufficient to induce dormancy, but was unable to maintain it long-term and was not absolutely required for a dormancy period. Clinically, AXL expression correlated with longer survival in prostate cancer patients, and AXL was not expressed by cancer cells in primary or metastatic tissue. These data point to a tumor-suppressive role for AXL in prostate cancer, and future work is required to determine if AXL is expressed on human bone marrow DTCs. IMPLICATIONS: The ability of AXL to initiate but not maintain dormancy, coupled with its dispensability, suggests that targeting AXL alone will not prevent lethal metastatic outgrowth, and likely a cooperative network of factors exists to mediate long-term cellular dormancy.


Conflict of interest statement

Disclosure of potential conflicts of interest

The authors declare no potential conflicts of interest.

Figures

Figure 1.
Figure 1.
AXL knockout does not prevent dormancy. A, Western blot showing AXL expression (left) in PC3 cells seeded at various densities (right, phase images) (n = 1). Arrow represents 125 kDa. Scale bar, 500 μm. B, AXL expression by western blot in PC3 cells (Par), a control knockout clone (Cntl KO), and two AXL knockout clones (Axl KO1, Axl KO 2) (n = 1). Arrow represents 125 kDa. C, BrdU incorporation over 24 hrs in control and knockout cell lines +/− GAS6. Results represent fold change between the incorporation readout on day 6 to day 2 (n = 3). Error bars, mean ± SEM; P values calculated using t-test between Axl KO and Cntl KO, and within each cell line between treatments. D, Quantification of the number of large colonies (number of colonies in the top 65% of the range of colony size) in soft agar +/− GAS6, relative to reference sample Par -GAS6 (n = 3). Error bars, mean ± SEM; P values calculated using multiple t-tests to assess differences due to treatment. E, Number and proliferation status of bone marrow DTCs detected in mice at 1 week after intracardiac injection. Each bar represents 1 mouse (n = 7 per group). F, Time in days to tumorigenesis after intracardiac injection. Tumorigenesis was defined as BLI signal over control PBS-injected mice (Cntl KO, n = 9; Axl KO, n = 12; each dot represents one mouse; mean ± SD). G, Duration of tumor growth of each group after intracardiac injection. Duration of growth was defined as the time between the onset of tumorigenesis and time to lethal tumor burden (Cntl KO, n = 9; Axl KO, n = 12; each dot represents one mouse; mean ± SD). H, Survival proportions for each group of mice over time (Cntl KO, n = 9 mice; Axl KO, n = 12 mice). P value calculated by Log-rank test. For relevant experiments GAS6 was added at 100 ng/mL at the time of seeding. For mouse tumor growth P values were calculated by t-test. I, Number and proliferation status of bone marrow DTCs detected in mice at the time of death. Counting stopped after the first 500 BM-DTCs (n = 5 for each group).
Figure 2.
Figure 2.
AXL overexpression decreases proliferation in vitro. A, AXL expression by western blot in C42B control Neomycin resistant cells (Neo), and two AXL overexpression clones (Axl 1, Axl 2) (n = 1). Arrow represents 125 kDa. B, EdU incorporation over 24 hrs in C42B Axl 1 and 2 cells compared to Neo control +/− GAS6 by IF. Individual cells were counted manually in 3 fields of view per sample (n = 2). P values calculated using t-test between cell lines and their control, and within each cell line between treatments. C, Quantification of the number of large colonies (number of colonies in the top 16% of the range of colony size) in soft agar +/− GAS6, relative to reference sample Neo -GAS6 (n = 2). D, AXL expression after dead cell exclusion by flow cytometry in an AXL overexpression clone over increasing passage number. Cells were re-selected with Neomycin over 2 passages between passage 16 and 19 (n = 1). E, AXL expression by western blot in conditionally overexpressing AXL clones (Tet-Axl 1, Tet-Axl 2) compared to empty vector control (Tet-ø) +/− doxycycline (n = 1). Arrow represents 125 kDa. F, EdU incorporation over 2 hrs in Tet-Axl 1 and 2 cells compared to Tet-ø control +/− doxycycline by flow cytometry (n = 3). P values calculated using one-sample t-test against the null hypothesis (log fold change = 0) was performed between treated samples. G, EdU incorporation over 2 hrs in all cell lines +/− doxycycline and AXL inhibitor R428 by flow cytometry; fold change is relative to untreated (Tet-ø and Tet-Axl 2, n = 3; Tet-Axl 1, n = 2). P values calculated using Dunnett’s multiple comparison test against +Dox samples for each cell line, excluding -Dox samples. H, Quantification of the number of large colonies (number of colonies in the top 13% of the range of colony size) in soft agar +/− doxycycline, relative to reference sample Tet-ø -Dox (n = 2). For each experiment treatments were initiated at the time of cell seeding; GAS6: 100 ng/mL, doxycycline: 100 ng/mL, R428: 50 nM. Error bars, mean ± SEM. For soft agar assays, P values were calculated using multiple t-tests to assess differences due to treatment.
Figure 3.
Figure 3.
High AXL expression leads to cell aggregation. A, Overlay of phase and nuclear labeling (NucLight Rapid Red Reagent) images of conditional AXL overexpression cell lines seeded +/− doxycycline for 4 days (n = 1). B, Tet-Axl cells (pooled population prior to Tet-Axl 1 and 2 cloning) seeded with increasing concentrations of doxycycline as indicated (ng/mL) were grown for 3 days and were imaged or collected for protein expression analysis by western blot (n = 1). Arrow represents 125 kDa. C, Phase images of Tet-Axl 1 cells seeded without doxycycline (−) over 4 days (top row), with 100 ng/mL doxycycline (+) over 4 days (middle row), and after doxycycline withdrawal on day 2 (bottom row). Numbers indicate the percent of AXL-positive cells in each condition by flow cytometry (n = 1). Images were taken on indicated days and contrast was enhanced to the same degree for each image to more easily visualize cells. D, Representative phase and nuclear labeling (NucLight Rapid Red Reagent) overlay images of Tet-ø and Tet-Axl 2 cells seeded with doxycycline (100 ng/mL) for 5 days +/− AXL inhibitor R428 (left) and quantification of skewness of aggregate size with increasing concentrations of R428 (right) (n = 3). P values calculated using t-test between R428 treated and untreated. E, Left: Representative images of Tet-ø and Tet-Axl 1 cells (phase, NucBlue Live Cell Stain) +/− doxycycline (100 ng/mL) and cocultured with human platelets (red). Right: Fold change of quantified colocalization of nuclear area (blue) and platelet signal (red) relative to -Dox (n = 2 for samples without R428 treatment, n = 1 for samples with R428 treatment (50 nM)). P values calculated using t-test to compare Tet-Axl to Tet-ø for +Dox samples only. Error bars, mean ± SEM. Scale bars, 1 mm.
Figure 3.
Figure 3.
High AXL expression leads to cell aggregation. A, Overlay of phase and nuclear labeling (NucLight Rapid Red Reagent) images of conditional AXL overexpression cell lines seeded +/− doxycycline for 4 days (n = 1). B, Tet-Axl cells (pooled population prior to Tet-Axl 1 and 2 cloning) seeded with increasing concentrations of doxycycline as indicated (ng/mL) were grown for 3 days and were imaged or collected for protein expression analysis by western blot (n = 1). Arrow represents 125 kDa. C, Phase images of Tet-Axl 1 cells seeded without doxycycline (−) over 4 days (top row), with 100 ng/mL doxycycline (+) over 4 days (middle row), and after doxycycline withdrawal on day 2 (bottom row). Numbers indicate the percent of AXL-positive cells in each condition by flow cytometry (n = 1). Images were taken on indicated days and contrast was enhanced to the same degree for each image to more easily visualize cells. D, Representative phase and nuclear labeling (NucLight Rapid Red Reagent) overlay images of Tet-ø and Tet-Axl 2 cells seeded with doxycycline (100 ng/mL) for 5 days +/− AXL inhibitor R428 (left) and quantification of skewness of aggregate size with increasing concentrations of R428 (right) (n = 3). P values calculated using t-test between R428 treated and untreated. E, Left: Representative images of Tet-ø and Tet-Axl 1 cells (phase, NucBlue Live Cell Stain) +/− doxycycline (100 ng/mL) and cocultured with human platelets (red). Right: Fold change of quantified colocalization of nuclear area (blue) and platelet signal (red) relative to -Dox (n = 2 for samples without R428 treatment, n = 1 for samples with R428 treatment (50 nM)). P values calculated using t-test to compare Tet-Axl to Tet-ø for +Dox samples only. Error bars, mean ± SEM. Scale bars, 1 mm.
Figure 4.
Figure 4.
AXL overexpression delays but does not prevent tumorigenesis in a mouse model of disseminated tumor cell growth. A, Number and proliferation status of bone marrow DTCs detected in mice at 3 weeks after intracardiac injection. Each bar represents 1 mouse; positive BLI signal is indicated below (AXL-off groups, n = 7; AXL-on group, n = 6). B, Time in days to tumorigenesis of each group after intracardiac injection at the 6 week (Tet-ø -Dox, n = 10; Tet-ø +Dox, n = 8; Tet-Axl -Dox, n = 9; Tet-Axl +Dox, n = 6) and 14 week (Tet-ø -Dox, n = 12; Tet-ø +Dox, n = 11; Tet-Axl -Dox, n = 11; Tet-Axl +Dox, n = 12) timepoints. Tumorigenesis was defined as BLI signal over control PBS-injected mice; each dot represents one mouse. C, Duration of tumor growth after intracardiac injection. Duration of growth was defined as the time between the onset of tumorigenesis and time to lethal tumor burden; each dot represents one mouse (Tet-ø -Dox, n = 9; Tet-ø +Dox, n = 8; Tet-Axl -Dox, n = 7; Tet-Axl +Dox, n = 9). D, Survival proportions for each group of mice over time (left) with tabulated Log-rank test results for each group compared to Tet-Axl +Dox group at the 8 or 12 week timepoint (right). Vertical dashed line indicates 8 weeks (Tet-ø -Dox, n = 14; Tet-ø +Dox, n = 13; Tet-Axl -Dox, n = 12; Tet-Axl +Dox, n = 14). Error bars, mean ± SD. For mouse tumor growth P values were calculated by t-test.
Figure 5.
Figure 5.
AXL-on tumors are heterogeneous for AXL expression and EdU incorporation. A, Representative IHC staining to detect either the C-terminus or N-terminus of AXL in liver tumors from each group. Dashed white lines depict the border between tumor and liver tissue; ‘T’ indicates the tumor region (n = 3 per group; scale bar, 100 μm). B, Multiplex IF staining for DAPI, human nucleolin, AXL (C-terminus), and EdU incorporation in liver tumors from 3 different AXL-on mice; scale bar, 50 μm.
Figure 6.
Figure 6.
AXL is not expressed in human prostate tumors. A, AXL expression prostate cancer patients who did and did not experience a biochemical recurrence (n = 1405 patients, GenomeDx GRID dataset). P value was calculated using the Wilcoxon rank test. B, Recurrence-free survival of patients with high (above the median) and low (below the median) AXL expression (n = 571 patients, Taylor et al, 2010 visualized and analyzed with Project Betastasis). C, Representative images of AXL IHC staining of a prostate tissue microarray; LN, lymph node. C42B cells served as a negative control, DU145 as a positive control. All images at original magnification x 200. D, AXL IHC staining in metastatic patient tissue; upper panel scale bar, 100 μm; lower panel scale bar, 50 μm.

Similar articles

Cited by

References

    1. Prostate Cancer: Statistics. Vol. 2018. (ASCO, Cancer.Net).
    1. Pound CR, Partin AW, Epstein JI & Walsh PC. Prostate-specific antigen after anatomic radical retropubic prostatectomy. Patterns of recurrence and cancer control. Urol Clin North Am. 1997;24:395–406. - PubMed
    1. Mehra R, Kumar-Sinha C, Shankar S, Lonigro RJ, Jing X, Philips NE, et al. Characterization of bone metastases from rapid autopsies of prostate cancer patients. Clin Cancer Res. 2011;17:3924–3932. - PMC - PubMed
    1. Norgaard M, Jensen AO, Jacobsen JB, Cetin K, Fryzek JP & Sorensen HT. Skeletal related events, bone metastasis and survival of prostate cancer: a population based cohort study in Denmark (1999 to 2007). J Urol. 2010;184:162–167. - PubMed
    1. Willis RA. The Spread of Tumours in the Human Body. London: J&A: Churchill; 1934;

Publication types

MeSH terms

Substances