. 2018 Oct 5;9(1):4112.
doi: 10.1038/s41467-018-06567-6.

Copy number load predicts outcome of metastatic colorectal cancer patients receiving bevacizumab combination therapy

Affiliations

Copy number load predicts outcome of metastatic colorectal cancer patients receiving bevacizumab combination therapy

Dominiek Smeets et al. Nat Commun. .

Abstract

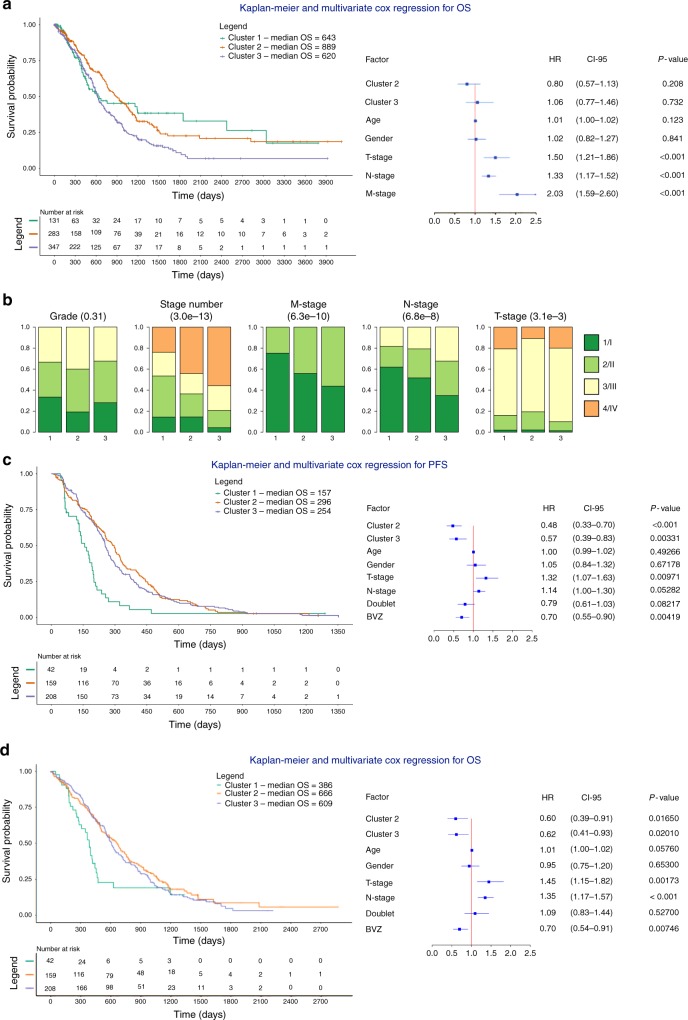
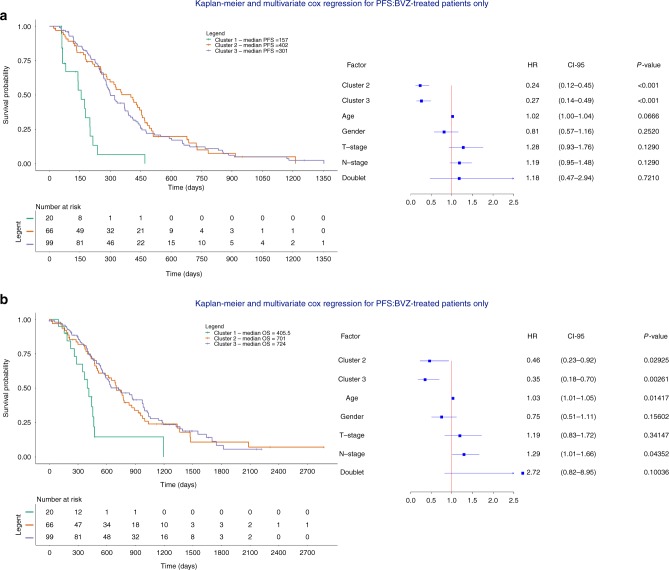
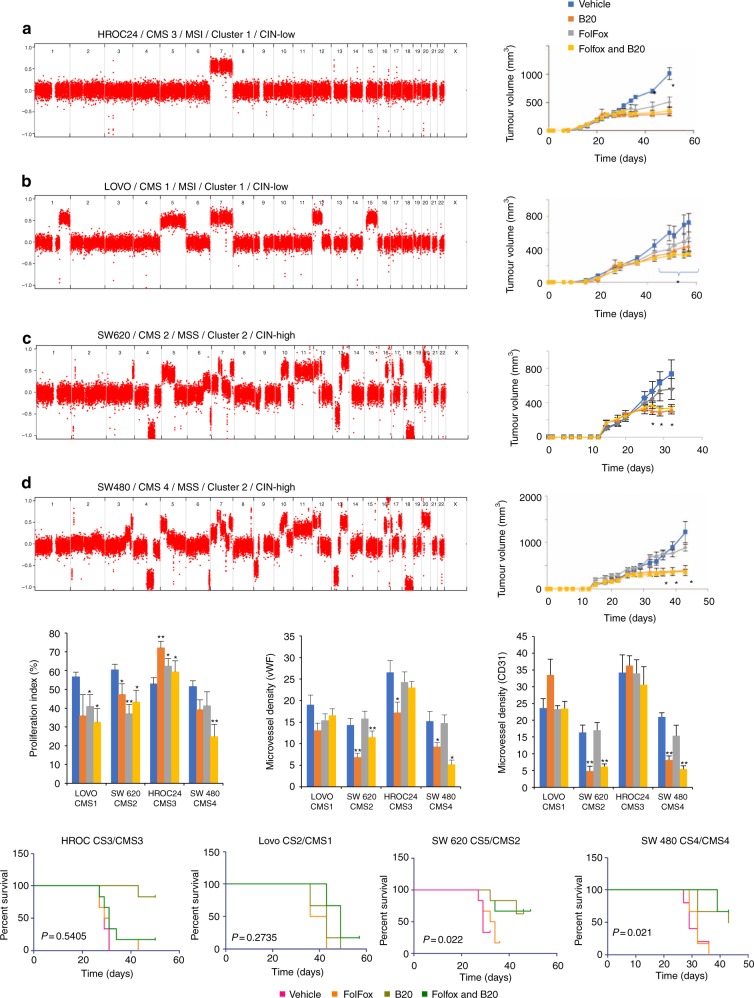
Increased copy number alterations (CNAs) indicative of chromosomal instability (CIN) have been associated with poor cancer outcome. Here, we study CNAs as potential biomarkers of bevacizumab (BVZ) response in metastatic colorectal cancer (mCRC). We cluster 409 mCRCs in three subclusters characterized by different degrees of CIN. Tumors belonging to intermediate-to-high instability clusters have improved outcome following chemotherapy plus BVZ versus chemotherapy alone. In contrast, low instability tumors, which amongst others consist of POLE-mutated and microsatellite-instable tumors, derive no further benefit from BVZ. This is confirmed in 81 mCRC tumors from the phase 2 MoMa study involving BVZ. CNA clusters overlap with CRC consensus molecular subtypes (CMS); CMS2/4 xenografts correspond to intermediate-to-high instability clusters and respond to FOLFOX chemotherapy plus mouse avastin (B20), while CMS1/3 xenografts match with low instability clusters and fail to respond. Overall, we identify copy number load as a novel potential predictive biomarker of BVZ combination therapy.


Conflict of interest statement

D.L., D.S., and A.T.B. are named as inventors on a patent related to this work (WO 2017/182656). The remaining authors declare no competing interests.

Figures

Fig. 1
Fig. 1
Clustering of primary and metastatic colorectal cancer. a Unsupervised hierarchical clustering of copy number profiles of primary and metastatic CRC (n = 908) tumors into 3 consensus CNA subgroups (termed CNA clusters 1, 2, and 3) based on recurrent CNAs as determined by GISTIC. Presence of recurrent amplifications (red) and deletions (blue) for each sample is shown. The 908 tumors represent 204 APD, 205 CAIRO and 499 TCGA tumors for which copy number data were available. b IGV plot showing how frequent each of the chromosomal regions (Y-axis) is affected by amplifications (red) or deletions (blue) in tumors belonging to CNA cluster 1, 2 and 3. c Genomic characterization of the 3 clusters for: the fraction of the genome affected by CNAs, the number of breakpoints and the number of mutations. Box plots show the median, the 25th and 75th percentiles, Tukey whiskers (median ± 1.5 times interquartile range). d Frequency of affected samples per cluster for each of the 102 significant amplifications or deletions (X-axis). e Distributions of the mutation frequency of PIK3CA, BRAF, KRAS, APC, TP53, POLD1/POLE, hypermutators, and MSI status for each cluster. The presence of a mutation or positive status for MSI or hypermutator is depicted in red and absence in grey. Fisher P-values are indicated between parentheses
Fig. 2
Fig. 2
Multivariate Cox regression and clinical characteristics of CNA clusters. a Kaplan-Meier plots and multivariate Cox regression with hazard ratios, 95% confidence intervals and P-values for CNA clusters are shown while correcting for the relevant covariates in all (n = 908) CRC samples. Cluster 1 is considered a reference. There is no difference for cluster identity, instead T-stage, N-stage, and M-stage are significant covariates in the model. b Clinical characterization of the CNA clusters. Clusters 2 and 3 are enriched for tumors with high T-stage, N-stage, and M-stage. Chi-squared P-values are presented between parentheses. c, d Kaplan-Meier plots and multivariate Cox regression with hazard ratios, 95% confidence intervals and P-values for CNA clusters are shown while correcting for the relevant covariates in mCRC samples treated ± BVZ (n = 409). Cluster 1 is considered a reference. Doublet stands for mono-chemotherapy (FP) or a combination of chemotherapy (FP-OX, FP-IRI). Clusters 2 and 3 are correlated with better PFS and OS independent of the other covariates
Fig. 3
Fig. 3
Multivariate Cox regression of the different clusters BVZ-treated mCRC samples. a, b Kaplan-Meier plots and multivariate Cox regression with hazard ratios, 95% confidence intervals and P-values for CNA clusters are shown while correcting for the relevant covariates in mCRC samples treated with chemotherapy + BVZ (n = 185). Cluster 1 is considered a reference. Doublet stands for mono-chemotherapy (FP) or a combination of chemotherapy (FP-OX, FP-IRI). Clusters 2 and 3 are correlated with significantly better PFS (a) and OS (b) independent of clinical covariates. Doublet chemotherapy is not significant in either of the two analyses
Fig. 4
Fig. 4
Multivariate Cox regression assessing the effect BVZ while stratifying for CNA cluster membership. ad Kaplan-Meier plots and multivariate Cox regression with hazard ratios, 95% confidence intervals and P-values are shown while correcting for the relevant covariates in mCRC receiving chemotherapy + BVZ while stratifying for CNA cluster 1 (a), cluster 2 (b), cluster 3 (c) and cluster 2 + 3 versus cluster 1 (d). Effects were only significant for the latter 3 comparisons. Doublet stands for mono-chemotherapy (FP) or a combination of chemotherapy (FP-OX, FP-IRI)
Fig. 5
Fig. 5
Multivariate Cox regression in microsatellite-instable (n = 11) or -stable (n = 18) cluster 1 tumors. a, b Kaplan-Meier plots and multivariate Cox regression with hazard ratios, 95% confidence intervals and P-values are shown while correcting for the relevant covariates in CNA cluster 1 tumors receiving chemotherapy + BVZ stratified for tumors that were either MSI-positive (n = 11) (a) or MSI-stable (n = 18) (b). In none of the two groups there was a significant treatment effect of BVZ
Fig. 6
Fig. 6
Multivariate Cox regression assessing the effect BVZ in CIN-high and CIN-low tumors. ad Patients (n = 409) were stratified in CIN-high and CIN-low tumors based on CNAs. CIN-high tumors are defined as having ≥25% of the chromosomal regions affected by CNAs. Kaplan-Meier and multivariate Cox regression with hazard ratios, 95% confidence intervals and P-values for PFS are shown while correcting for the relevant covariates for a patients treated with BVZ having high CIN versus low CIN, b patients treated with standard-of-care chemotherapy having high CIN versus low CIN, c patients with high CIN comparing chemotherapy + BVZ versus chemotherapy alone, and d patients with low CIN comparing chemotherapy + BVZ versus chemotherapy alone
Fig. 7
Fig. 7
Replication cohort, pathway expression and overlap with the consensus molecular subtypes. a Application of the random forest classification model to the replication cohort (n = 81) classified the samples in 3 different CNA clusters. Multivariate Cox regression with hazard ratios, 95% confidence intervals and P-values are shown for the 3 CNA clusters while correcting for the relevant covariates. Both CNA clusters 2 and 3 were characterized by improved PFS. b Multivariate Cox regression with hazard ratios, 95% confidence intervals and P-values are shown for the high CIN versus low CIN tumors while correcting for the relevant covariates. High CIN tumors were characterized by improved PFS. c Heatmap plot showing which pathways were overrepresented in genes differentially expressed in one cluster versus all other clusters. d Overlap between CNA clusters and the CRC molecular subtypes. CMS subtypes could only be established for 362 (out of 499) TCGA tumors for which expression data were available. 82.5% tumors from cluster 1 were CMS1 (55.7%) or CMS3 (26.8%), while 77.4 and 91.4% of cluster 2 or 3 tumors respectively, were CMS2 (52.6 and 53.1%) or CMS4 (24.8 and 38.3%)
Fig. 8
Fig. 8
In vivo experiments and IHC analyses on xenografts. ad Whole-genome copy number profile and growth curves of xenografts and analysis of the tumor sizes for four out of the seven cell lines. Error bars represent s.e.m. of six animals per group. Student's t-test *p < 0.05. e Immunohistochemical staining to determine the proliferation index (Ki67) and microvessel densities (vWF and CD31). Error bars represent s.e.m. Student’s t-test *p < 0.05, **p < 0.01. f KM-plots for PFS based on modified RECIST criteria. Regression was defined as a 50% decrease in tumor size and progression as a 35% increase in tumor size

References

    1. Siegel RL, et al. Colorectal cancer statistics, 2017. Cancer J. Clin. 2017;67:177–193. doi: 10.3322/caac.21395. - DOI - PubMed
    1. Hurwitz H, et al. Bevacizumab plus irinotecan, fluorouracil, and leucovorin for metastatic colorectal cancer. N. Engl. J. Med. 2004;350:2335–2342. doi: 10.1056/NEJMoa032691. - DOI - PubMed
    1. Saltz LB, et al. Bevacizumab in combination with oxaliplatin-based chemotherapy as first-line therapy in metastatic colorectal cancer: a randomized phase III study. J. Clin. Oncol. 2008;26:2013–2019. doi: 10.1200/JCO.2007.14.9930. - DOI - PubMed
    1. Potti A, Schilsky RL, Nevins JR. Refocusing the war on cancer: the critical role of personalized treatment. Sci. Transl. Med. 2010;2:28cm13–28cm13. doi: 10.1126/scitranslmed.3000643. - DOI - PubMed
    1. Lambrechts D, Lenz HJ, de Haas S, Carmeliet P, Scherer SJ. Markers of response for the antiangiogenic agent bevacizumab. J. Clin. Oncol. 2013;31:1219–1230. doi: 10.1200/JCO.2012.46.2762. - DOI - PubMed

Publication types

Substances