

Dynamic intercellular transport modulates the spatial patterning of differentiation during early neural commitment
- PMID: 30291250
- PMCID: PMC6173785
- DOI: 10.1038/s41467-018-06693-1
Dynamic intercellular transport modulates the spatial patterning of differentiation during early neural commitment
Erratum in
-
Author Correction: Dynamic intercellular transport modulates the spatial patterning of differentiation during early neural commitment.Nat Commun. 2018 Nov 16;9(1):4901. doi: 10.1038/s41467-018-07442-0. Nat Commun. 2018. PMID: 30446658 Free PMC article.
Abstract
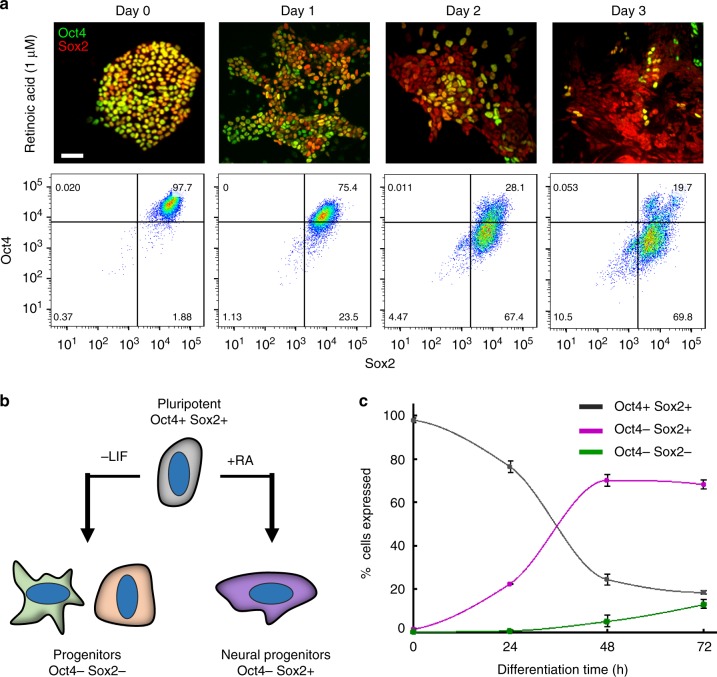
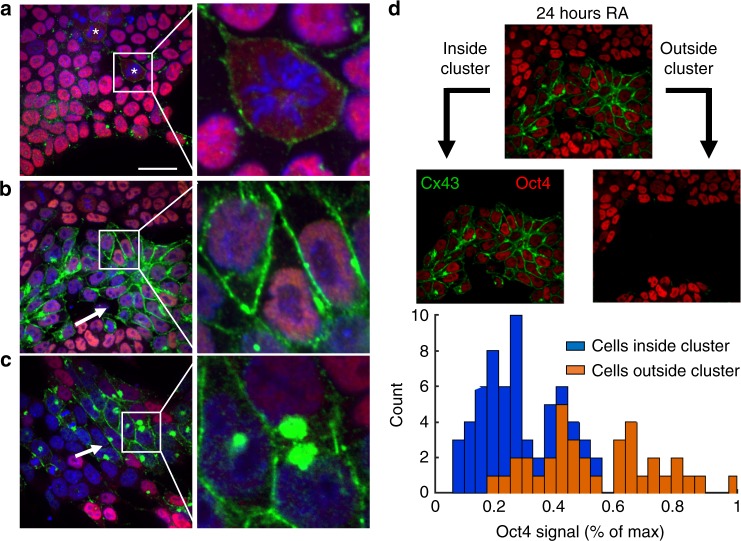
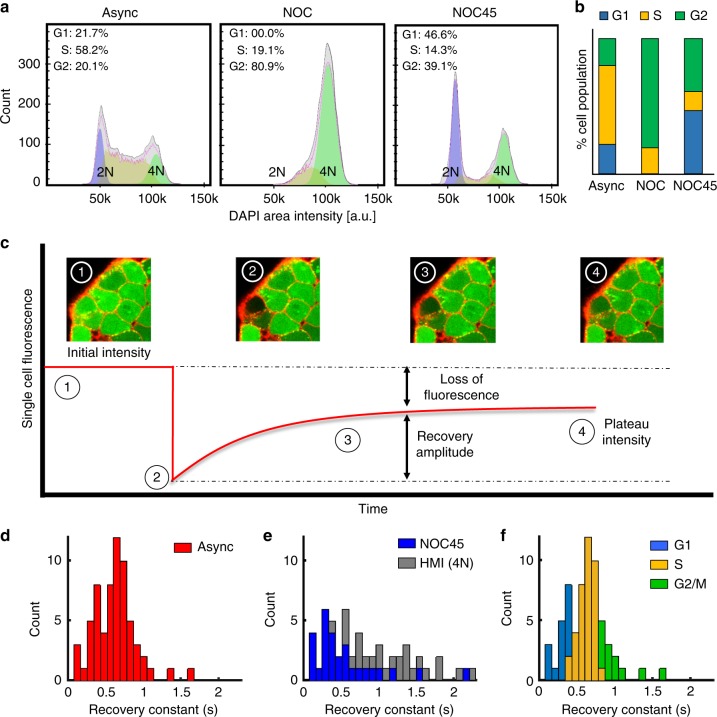
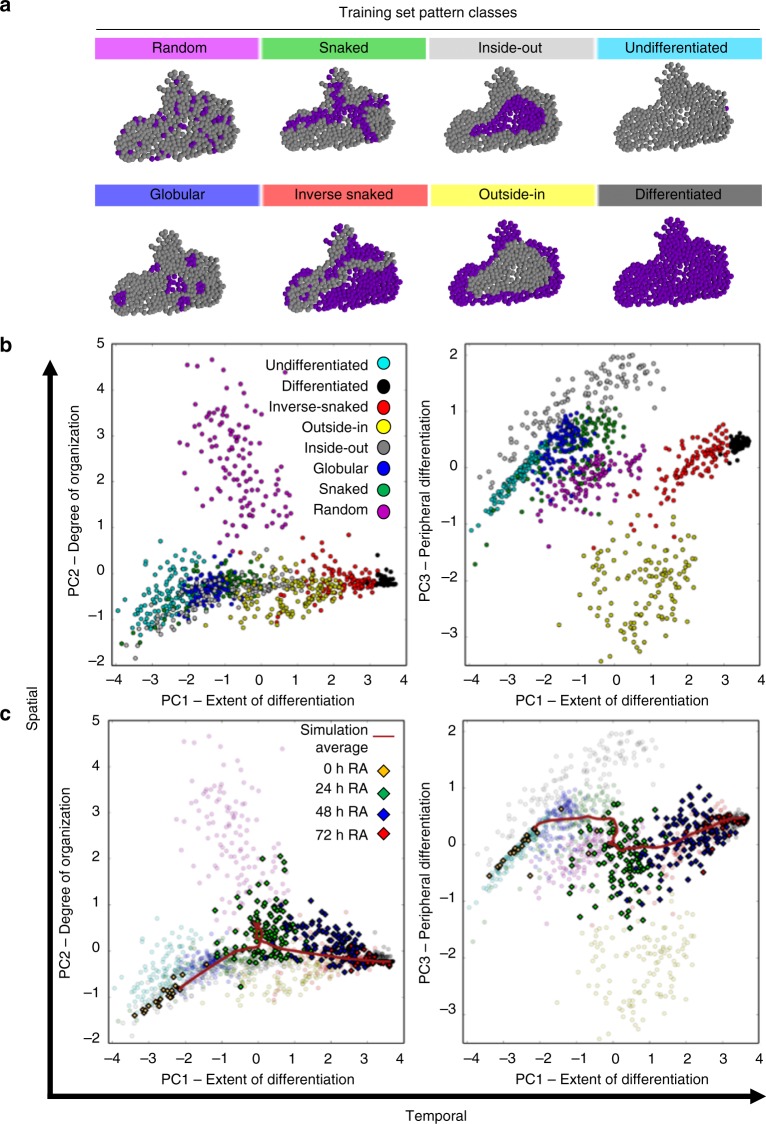
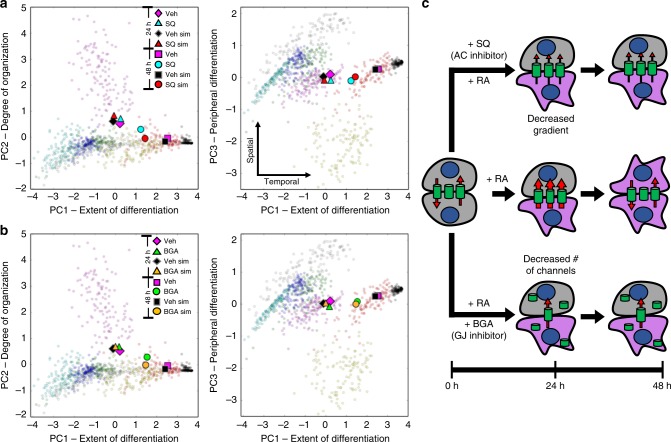
The initiation of heterogeneity within a population of phenotypically identical progenitors is a critical event for the onset of morphogenesis and differentiation patterning. Gap junction communication within multicellular systems produces complex networks of intercellular connectivity that result in heterogeneous distributions of intracellular signaling molecules. In this study, we investigate emergent systems-level behavior of the intercellular network within embryonic stem cell (ESC) populations and corresponding spatial organization during early neural differentiation. An agent-based model incorporates experimentally-determined parameters to yield complex transport networks for delivery of pro-differentiation cues between neighboring cells, reproducing the morphogenic trajectories during retinoic acid-accelerated mouse ESC differentiation. Furthermore, the model correctly predicts the delayed differentiation and preserved spatial features of the morphogenic trajectory that occurs in response to intercellular perturbation. These findings suggest an integral role of gap junction communication in the temporal coordination of emergent patterning during early differentiation and neural commitment of pluripotent stem cells.
Conflict of interest statement
The authors declare no competing interests.
Figures

Similar articles
-
Neuronal differentiation requires a biphasic modulation of gap junctional intercellular communication caused by dynamic changes of connexin43 expression.Eur J Neurosci. 2013 Jul;38(2):2218-28. doi: 10.1111/ejn.12219. Epub 2013 Apr 22. Eur J Neurosci. 2013. PMID: 23607708
-
Quantitative multivariate analysis of dynamic multicellular morphogenic trajectories.Integr Biol (Camb). 2015 Jul;7(7):825-33. doi: 10.1039/c5ib00072f. Integr Biol (Camb). 2015. PMID: 26095427 Free PMC article.
-
Gap junction blockage interferes with neuronal and astroglial differentiation of mouse P19 embryonal carcinoma cells.Dev Genet. 1999;24(1-2):69-81. doi: 10.1002/(SICI)1520-6408(1999)24:1/2<69::AID-DVG8>3.0.CO;2-M. Dev Genet. 1999. PMID: 10079512
-
Regulation of gap junction intercellular communication by the ubiquitin system.Cell Signal. 2010 Sep;22(9):1267-73. doi: 10.1016/j.cellsig.2010.03.005. Epub 2010 Mar 4. Cell Signal. 2010. PMID: 20206687 Review.
-
Regulation of connexins by the ubiquitin system: Implications for intercellular communication and cancer.Biochim Biophys Acta. 2016 Apr;1865(2):133-46. doi: 10.1016/j.bbcan.2016.02.001. Epub 2016 Feb 12. Biochim Biophys Acta. 2016. PMID: 26855059 Review.
Cited by
-
EZH2 inhibition sensitizes retinoic acid-driven senescence in synovial sarcoma.Cell Death Dis. 2024 Nov 16;15(11):836. doi: 10.1038/s41419-024-07176-6. Cell Death Dis. 2024. PMID: 39550391 Free PMC article.
-
Deep neural net tracking of human pluripotent stem cells reveals intrinsic behaviors directing morphogenesis.Stem Cell Reports. 2021 May 11;16(5):1317-1330. doi: 10.1016/j.stemcr.2021.04.008. Stem Cell Reports. 2021. PMID: 33979602 Free PMC article.
-
Modeling somatic computation with non-neural bioelectric networks.Sci Rep. 2019 Dec 9;9(1):18612. doi: 10.1038/s41598-019-54859-8. Sci Rep. 2019. PMID: 31819119 Free PMC article.
-
Topological data analysis of pattern formation of human induced pluripotent stem cell colonies.Sci Rep. 2025 Apr 4;15(1):11544. doi: 10.1038/s41598-025-90592-1. Sci Rep. 2025. PMID: 40185811 Free PMC article.
-
A Co-registration Pipeline for Multimodal MALDI and Confocal Imaging Analysis of Stem Cell Colonies.J Am Soc Mass Spectrom. 2020 Apr 1;31(4):986-989. doi: 10.1021/jasms.9b00094. Epub 2020 Mar 19. J Am Soc Mass Spectrom. 2020. PMID: 32176489 Free PMC article.
References
-
- Camp JG, et al. Multilineage communication regulates human liver bud development from pluripotency. Nature. 2017;546:533–538. - PubMed
Publication types
MeSH terms
Substances
LinkOut - more resources
Full Text Sources
Other Literature Sources
Miscellaneous
