. 2018 Oct 5;9(1):4113.
doi: 10.1038/s41467-018-06606-2.

Aberrant expression of CITED2 promotes prostate cancer metastasis by activating the nucleolin-AKT pathway

Affiliations

Aberrant expression of CITED2 promotes prostate cancer metastasis by activating the nucleolin-AKT pathway

Seung-Hyun Shin et al. Nat Commun. .

Abstract

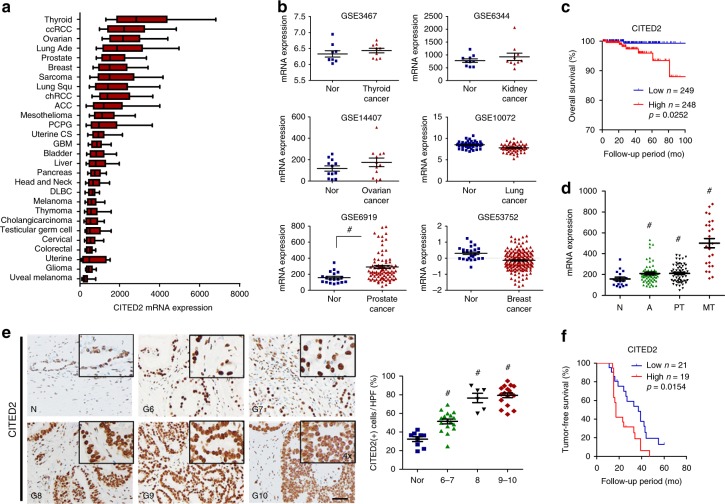
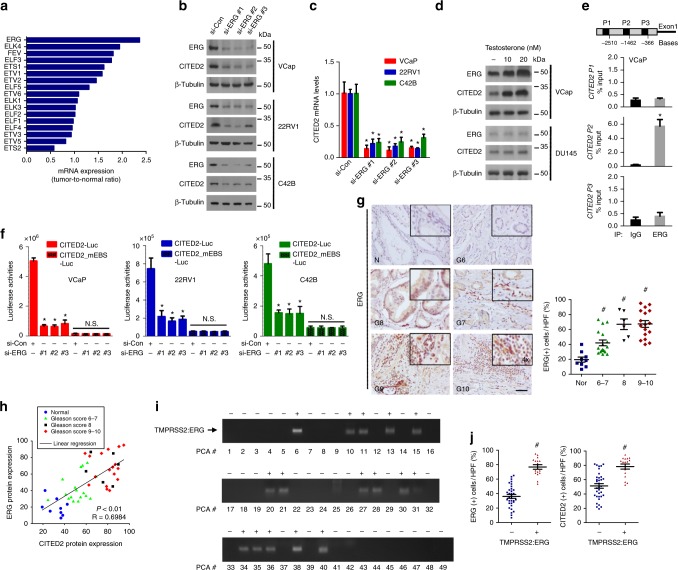
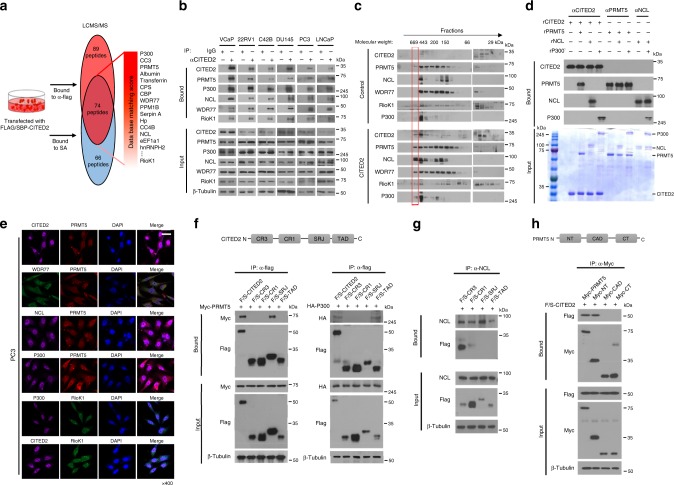
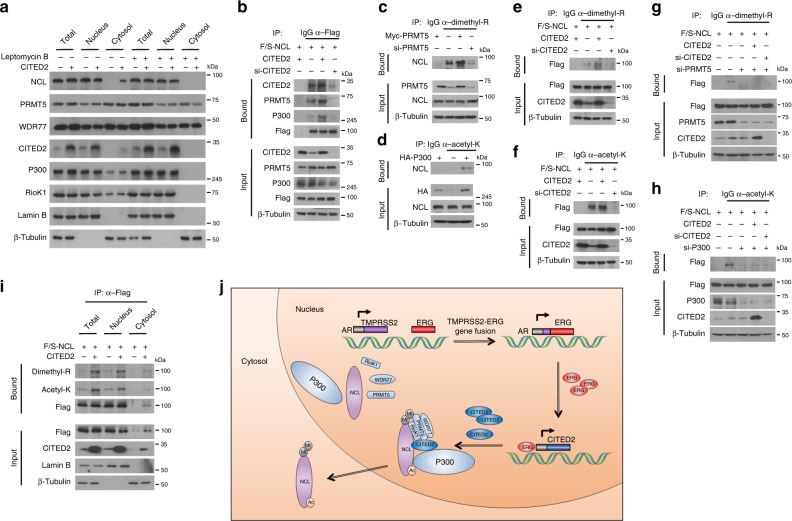
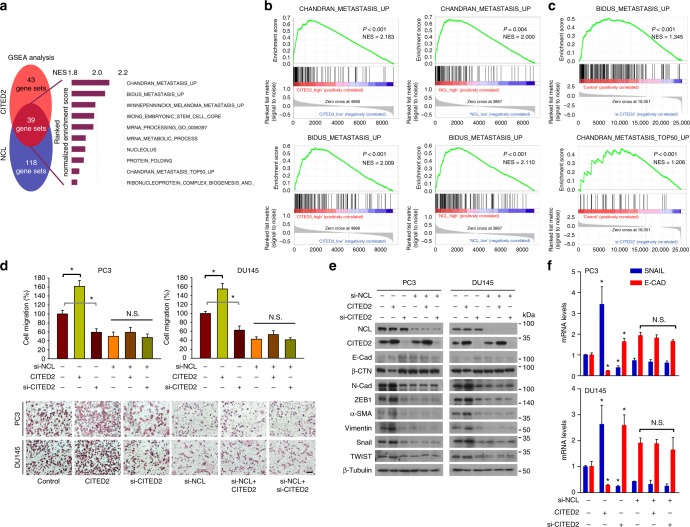
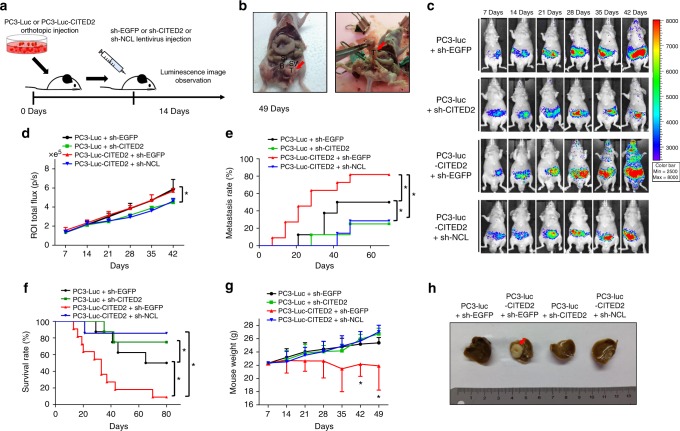
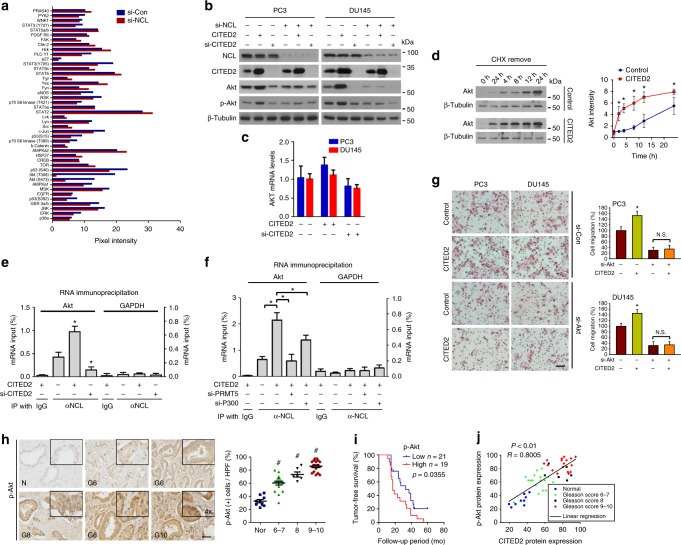
Despite many efforts to develop hormone therapy and chemotherapy, no effective strategy to suppress prostate cancer metastasis has been established because the metastasis is not well understood. We here investigate a role of CBP/p300-interacting transactivator with E/D-rich carboxy-terminal domain-2 (CITED2) in prostate cancer metastasis. CITED2 is highly expressed in metastatic prostate cancer, and its expression is correlated with poor survival. The CITED2 gene is highly activated by ETS-related gene that is overexpressed due to chromosomal translocation. CITED2 acts as a molecular chaperone to guide PRMT5 and p300 to nucleolin, thereby activating nucleolin. Informatics and experimental data suggest that the CITED2-nucleolin axis is involved in prostate cancer metastasis. This axis stimulates cell migration through the epithelial-mesenchymal transition and promotes cancer metastasis in a xenograft mouse model. Our results suggest that CITED2 plays a metastasis-promoting role in prostate cancer and thus could be a target for preventing prostate cancer metastasis.


Conflict of interest statement

The authors declare no competing interests.

Figures

Fig. 1
Fig. 1
CITED2 overexpression is associated with poor prognosis in prostate cancer. a CITED2 mRNA expression in 28 different types of cancer as determined by RNA-Seq V2 RSEM. Box plots indicate the distribution of values and the middle thick line in the box shows mean value and whiskers represent 10–90th percentile. Results were obtained from The Cancer Genome Atlas (TCGA) cancer provisional data sets based on TCGA Research Network (http://cancergenome.nih.gov). The abbreviations and the number of patients are described in the Methods section. b CITED2 mRNA levels in normal (blue squares) and cancer tissues (red triangles) of thyroid, kidney, ovarian, lung, prostate, and breast (GSE data sets). c Kaplan–Meier overall survival analysis of prostate cancer patients on TCGA. P value was calculated by log-rank test. d CITED2 mRNA levels in human prostate cancer tissues of data set GES6919. N normal prostate tissue (blue squares), A normal prostate tissue adjacent tumor tissue (green triangles), PT prostate primary tumor tissue (black inverted triangles), MT metastatic prostate tumor tissue (red diamond). e Representative images of human prostate adenocarcinoma tissues immunostained with anti-CITED2 antibody. Abbreviations at the left bottoms of images: N normal prostate tissue (blue squares), G6–10 (6–7, green triangles; 8, black inverted triangles; 9–10, red diamond) Gleason scores 6–10 of prostate cancer (left panel). The immunostaining scores were calculated by counting stained cells and presented as dot plots (right panel). The scale bar represents 50 μm. f Kaplan–Meier tumor-free survival analysis of prostate cancer patients. P value was calculated by log-rank test. The horizontal lines in all dot plots represent the means ± SE and #P < 0.05 versus the normal tissue group by Mann–Whitney statistical analysis
Fig. 2
Fig. 2
ERG gene activation is responsible for CITED2 overexpression in prostate cancer. a The mRNA levels of the ETS family members in GSE6919 data set. Each bar represents the ratio of tumor level to normal level. b Indicated cells were transfected with non-targeting siRNA (si-Con) or three different ERG-targeting siRNAs (si-ERG #1, #2 and #3) at an 80 nM concentration. Cell lysates were immunoblotted using the indicated antibodies. c RT-qPCR was performed to analyze CITED2 mRNA levels in prostate cancer cells transfected with the indicated siRNAs. Each bar represents the mean + SD (n = 3). d VCaP and DU145 cells were treated with testosterone, and the cell lysates were immunoblotted with anti-ERG, anti-CITED2, or anti-β-tubulin antibody. e The ERG binding to three CITED2 promotor regions (P1, P2 and P3) was detected by ChIP-qPCR using anti-ERG antiserum or non-immunized serum (IgG). The co-precipitated CITED2 promotor regions was quantified using RT-qPCR. Results (the mean ± SD, n = 3) were represented as percentages of IP signal/input signal (% input). *P < 0.05 versus the IgG control group. f The indicated siRNAs were cotransfected with the CITED2-luciferease or CITED2_mEBS (mutated ERG-binding sequence, patterned) reporter plasmid. Luciferase activities (mean + SD, n = 3) were measured by a luminometer. g Representative images of human prostate adenocarcinoma tissues immunostained with anti-ERG antibody. Abbreviations at the left bottoms of images: N normal prostate tissue (blue squares), G6–10 (6–7, green triangles; 8, black inverted triangles; 9–10, red diamond) Gleason scores 6–10 of prostate cancer (left panel). The immunostaining scores were calculated by counting stained cells and presented as dot plots (right panel). The scale bar represents 50 μm. h Protein expression scatter diagrams of ERG versus CITED2. Linear regression and correlation of ERG versus CITED2. R2 means coefficient of determination calculated by Pearson’s correlation. i DNAs extracted from prostate cancer tissues were subjected to PCR using a forward primer binding to the TMPRSS2 promoter and a reverse primer binding to the ERG gene. The PCR products of the TMPRSS2–ERG fusion gene (+, positive; −, negative) are indicated as an arrow. j The immunostaining scores were calculated by counting stained cells. Blue and red symbols indicate ERG (right panel) and CITED2 (left panel) levels in the TMPRSS2–ERG fusion negative (blue squares) and positive (red triangles) group. The horizontal lines in all dot plots represent the means ± SE and #P < 0.05 versus the normal group by Mann–Whitney statistical analysis; *P < 0.05 versus the si-Con group by Student’s t-test; N.S. ‘not significantly different’ among the groups
Fig. 3
Fig. 3
CITED2 forms a multimeric complex with nucleolin, p300, and PRMT5 subunits. a HEK293T cells were transfected with the Flag/SBP-CITED2 plasmid. CITED2-interacting proteins were precipitated using anti-Flag tag antibody or streptavidin, and identified by LC-MS/MS analyses. The proteins identified commonly in two precipitates are listed. b Prostate cancer cell lysates were immunoprecipitated with anti-CITED2 antibody or IgG, and the precipitates were immunoblotted with the indicated antibodies. c HEK293T cells were transfected with pcDNA or CITED2, and the cell lysates were subjected to FPLC. The FPLC elutes were immunoblotted with the indicated antibodies. The red box indicates a bigger-sized complex (600 to 700 kDa) that is formed by CITED2 overexpression. d In vitro binding analysis. Recombinant protein CITED2, PRMT5, NCL, and P300 were put together in a test tube. Proteins in tube were immunoprecipitated with indicated antibodies, and the precipitates were immunoblotted. Input levels were verified by electrophoresis and Coomassie staining. e Representative immunofluorescence images. PC3 cells were grown on coverslips, fixed with methanol, and stained with the indicated antibodies. All samples were stained with DAPI to visualize nuclei. The scale bar represents 20 μm. f The Flag/SBP-CITED2 constructs are shown in the top panel. HEK293T cells were cotransfected with one of the CITED2 constructs and Myc-PRMT5, HA-P300, and Flag/SBP-peptides were immunoprecipitated with anti-Flag and Myc-PRMT5 and HA-P300 were detected by western blotting. g HEK293T cells were transfected with the CITED2 constructs, and cell lysates were immunoprecipitated with anti-NCL and Flag/SBP-CITED2 peptides were detected by western blotting. h The Myc-PRMT5 constructs are shown in the top panel. HEK293T cells were cotransfected with one of the PRMT5 construct and Flag/SBP-CITED2, and Myc-peptides were immunoprecipitated with anti-Myc and Flag/SBP-CITED2 were detected by western blotting. All experiments were carried out at three distinct samples
Fig. 4
Fig. 4
CITED2 is essential for post-translational modifications of NCL. a HEK293T cells were transfected with pcDNA or CITED2 and treated with Leptomycin B (200 nM), and the cell lysates were fractionated to cytosolic and nuclear components. The cell fractions were immunoblotted with the indicated antibodies. b HEK293T cells were cotransfected with Flag/SBP-NCL and CITED2 or si-CITED2. Cell lysates were immunoprecipitated with anti-Flag and immunoblotted with the indicated antibodies. c HEK293T cells were transfected with Myc-PRMT5 and/or si-PRMT5. Cell lysates were immunoprecipitated with anti-dimethyl arginine antibody and precipitated NCL was immunoblotted. d HEK293T cells were transfected with HA-p300. Cell lysates were immunoprecipitated with anti-acetyl lysine antibody and precipitated NCL was immunoblotted. e, f HEK293T cells were cotransfected with Flag/SBP-NCL and CITED2 or si-CITED2. Cell lysates were immunoprecipitated with anti-dimethyl arginine or anti-acetyl lysine antibody and precipitated NCL was immunoblotted. g, h HEK293T cells were cotransfected with the indicated plasmids and siRNAs. Cell lysates were immunoprecipitated with anti-dimethyl arginine or anti-acetyl lysine antibody and precipitated NCL was immunoblotted. i HEK293T cells were cotransfected with Flag/SBP-NCL and CITED2, and the cell lysates were fractionated to cytosolic and nuclear components. The cell fractions were immunoprecipitated with anti-Flag antibody and immunoblotted with the indicated antibodies. j The ERG–CITED2–PRMT5/p300–NCL pathway in prostate cancer. ERG is upregulated due to the TMPRSS2–ERG gene fusion and transactivates the CITED2 gene in prostate cancer cells. Overexpressed CITED2 induces the methylation and acetylation of NCL in the nucleus by recruiting PRMT5 and p300, then modified NCL is translocated to the cytoplasm. All experiments were carried out at three distinct samples
Fig. 5
Fig. 5
CITED2 enhances metastatic potential NCL-dependently in prostate cancer. a Gene Set Enrichment Analysis (GSEA). Venn diagram depicts 39 gene sets upregulated (P < 0.05 and FDR < 0.30) commonly by CITED2 and NCL expression. Of them, top 10 gene sets are listed. b Representative enrichment plots of the metastasis-related gene set which positively correlate with CITED2 (left panel) or NCL (right panel). c PC3 cells were transfected with control or CITED2-targeting siRNA. Total RNAs were extracted using Trizol and subjected to RNA-sequencing analyses. The experiments were performed three times independently. The graphs show representative enrichment plots of the metastasis-related gene set which positively correlate with CITED2 in PC3 cell. d Cell migration was analyzed using a transwell chamber. PC3 and DU145 cells (1 × 104/well), which had been transfected as indicated, were placed on the upper chamber. After 12 h, cells passing through the interface membrane were stained (bottom) and counted (top). Each bar represents the mean + SD (n = 3). The scale bar represents 25 μm. e PC3 and DU145 cells were transfected with CITED2 or si-CITED2, and/or si-NCL. Representative EMT markers were immunoblotted. f RNAs were extracted from PC3 or DU145 cells which were transfected with CITED2 or si-CITED2 and/or si-NCL. The SNAIL and E-CAD mRNA levels were measured by RT-qPCR. Each bar represents the mean + SD (n = 3). *P < 0.05 versus the control group; N.S. not significantly different’ among the groups by Student’s t-test
Fig. 6
Fig. 6
CITED2 promotes prostate cancer metastasis NCL-dependently in mice. a Schematic diagram of in vivo prostate metastasis model. b Representative photographs of prostate tumors 10 weeks after cell implantation. The luciferase-expressing PC3 cells (0.5 × 106) were suspended in 20 μL of sterile PBS and injected into the prostates of Balb/cSlc-nu/nu mice. c Bioluminescent images of primary tumors and metastases were monitored using Xenogen IVIS® Lumina 100. Color scale bars represent tumor intensity from purple (low) to red (high). d Growth curves of primary tumors were plotted based on bioluminescence intensities. Data are presented as the mean + SD, and *P < 0.05 between two groups by Mann–Whitney statistical analysis. Mouse numbers are 8 in the sh-EGFP group, 8 in the sh-CITED2 group, 11 in the CITED2+sh-EGFP, and 7 in the CITED2+sh-NCL group. e Metastasis rate was retrieved according to the Kaplan–Meier method and *P < 0.05 between two groups. Metastasis defined as ROI flux value was larger than 1.0 × e5. f Kaplan–Meier overall survival rate analyses were followed up until 80 days after xenograft and *P < 0.05 between two groups. g Tumor-bearing mice were weighed in the indicated times. Data are presented as the mean + SD, and *P < 0.05 between two groups by Mann–Whitney statistical analysis. h Representative photographs of livers with metastatic carcinoma nodules (indicated by arrow)
Fig. 7
Fig. 7
CITED2 facilitates AKT synthesis through post-translational modifications of NCL. a The blot spot pixel densities were analyzed by the ImageJ program. b Immunoblotting of NCL, CITED2, AKT, p-AKT, and β-tubulin in cells that were transfected with CITED2 or si-CITED2 and si-NCL. c The AKT mRNA levels in cells were measured by RT-qPCR. d DU145 cells, which had been transfected with pcDNA or CITED2, were pretreated with 100 μM cycloheximide for 12 h. After washing out cycloheximide, cells were incubated for the indicated times. AKT synthesis levels were detected by western blotting and quantified using ImageJ. Each point represents the mean ± SD (n = 3). e, f RNA-IP was performed to analyze the NCL binding to AKT mRNA. DU145 cells were transfected as indicated and the cell lysates were immunoprecipitated with anti-NCL or IgG. The co-precipitated AKT or GAPDH (a negative control) mRNA was quantified using RT-qPCR. Results (the mean ± SD, n = 3) were represented as percentages of IP signal/input signal (% input). g Cells that had been transfected with CITED2 and/or si-AKT were subjected to cell migration assay. Cells passing through the interface membrane were stained and counted. The relative cell migration is presented as a bar graph (the mean + SD, n = 3). N.S. ‘not significantly different’ among the groups. The scale bar represents 25 μm. h Representative images of human prostate adenocarcinoma tissues immunostained with anti-phospho-AKT antibody. Abbreviations at the left bottoms of images: N normal prostate tissue (blue squares), G6–10 (6–7, green triangles; 8, black inverted triangles; 9–10, red diamond) Gleason scores 6–10 of prostate cancer (left panel). The immunostaining scores were calculated by counting stained cells and presented as dot plots (right panel). The horizontal lines in dot plot represent the means ± SE and #P < 0.05 versus the normal group by Mann–Whitney statistical analysis. The scale bar represents 50 μm. i Kaplan–Meier tumor-free survival analysis of prostate cancer patients. P value was calculated by log-rank test. j Scatter diagrams for p-AKT expression versus CITED2 expression. R value is Pearson’s correlation coefficient. *P < 0.05 versus control group by Student’s t-test

Similar articles

Cited by

References

    1. Attard G, et al. Prostate cancer. Lancet. 2016;387:70–82. doi: 10.1016/S0140-6736(14)61947-4. - DOI - PubMed
    1. Hwang C. Overcoming docetaxel resistance in prostate cancer: a perspective review. Ther. Adv. Med. Oncol. 2012;4:329–340. doi: 10.1177/1758834012449685. - DOI - PMC - PubMed
    1. Tomlins SA, et al. Recurrent fusion of TMPRSS2 and ETS transcription factor genes in prostate cancer. Science. 2005;310:644–648. doi: 10.1126/science.1117679. - DOI - PubMed
    1. Tomlins SA, et al. Role of the TMPRSS2-ERG gene fusion in prostate cancer. Neoplasia. 2008;10:177–188. doi: 10.1593/neo.07822. - DOI - PMC - PubMed
    1. Vanaja DK, Cheville JC, Iturria SJ, Young CY. Transcriptional silencing of zinc finger protein 185 identified by expression profiling is associated with prostate cancer progression. Cancer Res. 2003;63:3877–3882. - PubMed

Publication types

MeSH terms