. 2018 Oct 5;8(1):14864.
doi: 10.1038/s41598-018-33115-5.

Site-Specific Labelling of Multidomain Proteins by Amber Codon Suppression

Affiliations

Site-Specific Labelling of Multidomain Proteins by Amber Codon Suppression

Christina S Heil et al. Sci Rep. .

Abstract

The access to information on the dynamic behaviour of large proteins is usually hindered as spectroscopic methods require the site-specific attachment of biophysical probes. A powerful emerging tool to tackle this issue is amber codon suppression. Till date, its application on large and complex multidomain proteins of MDa size has not been reported. Herein, we systematically investigate the feasibility to introduce different non-canonical amino acids into a 540 kDa homodimeric fatty acid synthase type I by genetic code expansion with subsequent fluorescent labelling. Our approach relies on a microplate-based reporter assay of low complexity using a GFP fusion protein to quickly screen for sufficient suppression conditions. Once identified, these findings were successfully utilized to upscale both the expression scale and the protein size to full-length constructs. These fluorescently labelled samples of fatty acid synthase were subjected to initial biophysical experiments, including HPLC analysis, activity assays and fluorescence spectroscopy. Successful introduction of such probes into a molecular machine such as fatty acid synthases may pave the way to understand the conformational variability, which is a primary intrinsic property required for efficient interplay of all catalytic functionalities, and to engineer them.


Conflict of interest statement

The authors declare no competing interests.

Figures

Figure 1
Figure 1
Overview of animal fatty acid synthesis. (A) Fatty acid synthesis as occurring in animals. The fatty acid, typically palmitic acid, is produced from the substrates acetyl-CoA, malonyl-CoA and NADPH. The acetyl moiety is sequentially elongated and modified by several domains until a certain chain length (C16) is reached and the final product is released from the enzyme as a free fatty acid. During the whole process, all intermediates remain covalently attached to the enzyme, mainly to the ACP domain, which requires a high conformational freedom of FAS to facilitate productive interactions between the ACP domain and all catalytically active sites. Domain nomenclature: KS (ketoacyl synthase), KR (ketoacyl reductase), DH (dehydratase), ER (enoyl reductase), ACP (acyl carrier protein), TE (thioesterase), MAT (malonyl/acetyltransferase). (B) Cartoon depiction of the dimeric “X”-shaped structure of porcine FAS. α-Helices are shown as cylinders. One half of the dimer is coloured according to the attached domain overview. Owing to their high positional variability, ACP and TE could not be traced in electron density, but are schematically drawn for clarity. KR and MT (methyltransferase) refer to non-catalytic folds, which have structural tasks and may confine the ACP during substrate shuttling. (C) Conformational dynamics of animal FAS. Swinging and swivelling motions around the flexible hinge region have been observed by single particle EM and high-speed atomic force microscopy,. Full rotation of the condensing wing by 180° was further confirmed by mutagenesis studies.
Figure 2
Figure 2
Amber codon suppression at site Leu54 in the ACP-GFP fusion construct screened in reporter assay. (A) Overview of ncAAs used in this study. (B) Best expression efficiency of different ncAAs (left panel) and comparison of some representatives of the screening (right panel). Respective plasmids used for incorporation of ncAAs are indicated by plasmid number (#; listed in Supplementary Table S2). A compilation of all results from the reporter assay can be found in Supplementary Fig. S2. Expression efficiency is read out by GFP fluorescence of 2 mL E. coli cell cultures and compared to wild type reference (taken as 100%). For incorporation, 2 mM ncAAs were supplemented to the medium. Cultures lacking ncAAs were taken as negative control to determine background signal. Dots refer to values of the biological samples. The averages of biological samples are plotted together with standard deviations. Technical errors were below 10%.
Figure 3
Figure 3
Screening of amber codon mutation sites. (A) Cartoon representation of the ACP-GFP fusion construct (upper panel; pink: rat ACP (PDB: 2png) and green: eGFP (PDB: 2y0g)) used in the reporter assay. The five amber mutation sites are labelled and depicted in stick representation (Gly01, Leu54, Gln70, Glu71 and Ala79). Different orientations of the ACP domain (shown in a sphere-filling model) demonstrate the positioning of all amber mutation sites on the surface of the domain (lower panel). Amber mutation sites are coloured in red. (B) Sequence alignment of six different ACP domains of animal FASs. UniProtKB accession codes: mouse FAS: P19096; rat FAS: P12785; pig FAS: A5YV76; human FAS: P49327; bovine FAS: Q71SP7 and chicken FAS: P12276. The five amber mutation sites are highlighted by arrows, and a star highlights the active serine residue. Secondary structure elements received from the rat ACP model (PDB: 2png) are depicted (α-helices shown as cylinders). (C) Expression efficiencies of six different AzPhe mutants (upper panel) and six different NorLys2 mutants (lower panel) in comparison to the wild type reference, read out by the GFP fluorescence of 2 mL cultures of E. coli cells. For incorporation, 2 mM ncAAs were supplemented to the medium. Cultures lacking ncAAs were taken as negative control to determine background signal. The averages of biological replicates are plotted together with standard deviations and the distribution of individual values is indicated as dots. Technical errors were below 10%.
Figure 4
Figure 4
Large scale expression and purification of ACP-GFP mutants (upper panels AzPhe mutants, lower panels NorLys2 mutants). (A) Comparison of the results from large scale expression cultures (protein yield was read out by GFP fluorescence of a 2 mL sample and by the yield of purified protein) with previous results from the reporter assay. Data compare expression efficiency of wild type and five different AzPhe mutants (upper panel), and expression efficiency of wild type and five different NorLys2 mutants (lower panel). All expression efficiencies are related to the wild type reference. For incorporation, 2 mM ncAA were supplemented to the medium. The averages of biological replicates are plotted together with standard deviations and the distribution of individual values is indicated as dots. Technical errors were below 10%. (B) SDS-PAGE (NuPAGE Bis-Tris 4–12%) gel of ACP-GFP mutants purified by Ni-chelating chromatography. Lanes have been assembled for clarity (indicated by dashed lines), but scans of the original gels can be found in Supplementary Fig. S9. SDS-PAGE shows one set of purified proteins (one biological replicate). (C) Preparative SEC of ACP-GFP mutants performed with a Superdex 200 Increase 10/300 GL column (the set of proteins shown in (B)). Peaks at an elution volume of 16 mL correspond to the ACP-GFP variants. The void volume of the column is at ca. 9 mL.
Figure 5
Figure 5
Fluorescent labelling of ACP-GFP mutants. (A) DOL of ACP-GFP mutants in respect to the amber mutation site determined by relative in-gel fluorescence intensities at wavelength 650 nm. The ACP-GFP construct was enzymatically modified by a fluorescent CoA647-label with Sfp and served as the wild type reference. Hence, it was put to 100% fluorescence intensity. AzPhe mutants were labelled with 80 equiv. of BCN-POE3-NH-DY649P1 (BCN-649), NorLys2 mutants were labelled with 80 equiv. of 6-methyl-tetrazine-ATTO-647N (Tet-647) in 10 µL reaction volume. All fluorescence intensities were corrected by the quantum efficiency of the respective fluorophore and correlated to the protein bands of the Coomassie-stained gel (lanes have been assembled for clarity, as indicated by dashed lines). Scans of the original gels are presented in Supplementary Fig. S10. Biological replicates were performed for the Leu54 mutants, comparing DOL determined for three parallel labelling reactions analysed on different fluorescent gels (inserted box). Individual results were gathered from gels in A and Supplementary Fig. S4. (B) DOL determined by UV-Vis spectroscopy. 25 equiv. of fluorophore were used in labelling reactions of ACP-GFP mutants in 50 µL reaction volume. Free fluorophore was removed by purification over Ni-NTA magnetic beads. UV-Vis absorbance spectra were normalized to GFP absorbance at wavelength 485 nm. DOL is read out by comparing absorbance of the fluorophore at 650 nm to absorbance of GFP at 485 nm.
Figure 6
Figure 6
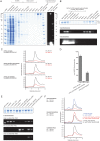
Physicochemical analysis of fluorescently labelled mFAS. (A) SDS-PAGE (NuPAGE Bis-Tris 4–12%) of a representative purification of the ncAA-modified mFAS mutant (Gly2113AzPhe with additional ACP knock-out mutation Ser2150Ala). The portion of truncated polypeptide chains after the tandem purification strategy was quantified to roughly 30%. Truncated proteins reflect insufficient amber suppression and are co-purified by heterodimer formation. In-gel fluorescence demonstrates successful labelling with fluorophore BCN-649. (B) Purification of three full-length mFAS variants (Gly2113AzPhe, Gly2113AzPhe with Ser2150Ala, and wild type) in preparative 100 µg scale via HiPur Ni-NTA magnetic beads. Samples were clicked with 16 equiv. BCN-649 for 1 h followed by in vitro phosphopantetheinylation with CoA and Sfp. In-gel fluorescence of a SDS-PAGE (Bis-Tris 4–12%) was detected before Coomassie-staining. The lowest panel indicates that the majority of free fluorophore is washed away after the first washing step. (C) Analysis of the integrity of the three labelled samples after clicking and purification by HPLC-SEC. The main peak at 7.5–7.6 min corresponds to the native dimeric state. Absorbance was monitored at 280 nm and 655 nm and normalized to the highest peak in the UV signal. Both samples containing the ncAA AzPhe were labeled with fluorophore (28% and 31%), whereas the wild type mFAS showed only minor non specific fluorophore binding (5%). (D) Activity of mFAS variants monitored by a NADPH consumption assay after phosphopantetheinylation and clicking. The variant Gly2113AzPhe showed one third of the wild type activity, whereas the ACP knock-out (Ser2150Ala) could not produce fatty acids. Error bars indicate the technical repeatability determined from three repeated experiments per construct. (E) SDS-PAGE (NuPAGE Bis-Tris 4–12%) of the same three variants: 1: wild type mFAS, 2: mFAS (Gly2113AzPhe and Ser2150Ala) and 3: mFAS (Gly2113AzPhe) after enzymatic labelling with CoA-547 and clicking of the AzPhe containing variants with BCN-649. In-gel fluorescence was detected with three different settings: excitation with green light and filter F595 (for 595 nm); excitation with red light and filter F695 (695 nm) and excitation with green light and filter F695. The gel after Coomassie-staining is attached. All samples show specific fluorescent bands in the respective channels with little unspecific binding due to denaturing conditions. The doubly labelled sample Gly2113AzPhe shows FRET signal. (F) Fluorescence analysis of the three labelled samples of (E) via HPLC-SEC. Emission spectra are shown for the settings: Ex. 550 nm/Em 570 nm; Ex. 630 nm/Em 650 nm and Ex. 550 nm/Em 650 nm. All signals were normalized as described in detail in the methods section. Again, the doubly labelled sample Gly2113AzPhe shows (highest) FRET signal.
Figure 7
Figure 7
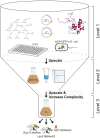
Overview of the workflow of this study. Workflow of amber codon suppression on mFAS divided into three different levels of project progress. Level 1 refers to the low-complex single-domain screening approach in 2 mL small scale cell cultures in 96-well plate format. GFP fluorescence is directly read out and serves as a measure for the efficiency of amber codon suppression. Level 2 refers to the upscaling of culture volumes to 200 mL using initial results from the reporter assay, which also allows obtaining purified protein for further analysis. In a final step, level 3 refers to the application of selected conditions and label positions, that were identified for an individual domain, for the full-length mFAS, being a representative for any comparable multidomain protein.

Similar articles

Cited by

References

    1. Chang S-I, Hammes GG. Structure and Mechanism of Action of a Multifunctional Enzyme: Fatty Acid Synthase. Acc. Chem. Res. 1990;23:363–369. doi: 10.1021/ar00179a003. - DOI
    1. Maier T, Leibundgut M, Boehringer D, Ban N. Structure and function of eukaryotic fatty acid synthases. Q. Rev. Biophys. 2010;43:373–422. doi: 10.1017/S0033583510000156. - DOI - PubMed
    1. Barajas JF, Blake-Hedges JM, Bailey CB, Curran S, Keasling JD. Engineered polyketides: Synergy between protein and host level engineering. Synth. Syst. Biotechnol. 2017;2:147–166. doi: 10.1016/j.synbio.2017.08.005. - DOI - PMC - PubMed
    1. Hertweck C. The Biosynthetic Logic of Polyketide Diversity. Angew. Chem. Int. Ed. 2009;48:4688–4716. doi: 10.1002/anie.200806121. - DOI - PubMed
    1. Smith S, Tsai S-C. The type I fatty acid and polyketide synthases: a tale of two megasynthases. Nat. Prod. Rep. 2007;24:1041–1072. doi: 10.1039/b603600g. - DOI - PMC - PubMed

Publication types

MeSH terms