Cytometry meets next-generation sequencing - RNA-Seq of sorted subpopulations reveals regional replication and iron-triggered prophage induction in Corynebacterium glutamicum
- PMID: 30291266
- PMCID: PMC6173762
- DOI: 10.1038/s41598-018-32997-9
Cytometry meets next-generation sequencing - RNA-Seq of sorted subpopulations reveals regional replication and iron-triggered prophage induction in Corynebacterium glutamicum
Abstract
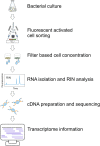
Phenotypic diversification is key to microbial adaptation. Currently, advanced technological approaches offer insights into cell-to-cell variation of bacterial populations at a spatiotemporal resolution. However, the underlying molecular causes or consequences often remain obscure. In this study, we developed a workflow combining fluorescence-activated cell sorting and RNA-sequencing, thereby allowing transcriptomic analysis of 106 bacterial cells. As a proof of concept, the workflow was applied to study prophage induction in a subpopulation of Corynebacterium glutamicum. Remarkably, both the phage genes and flanking genomic regions of the CGP3 prophage revealed significantly increased coverage upon prophage induction - a phenomenon that to date has been obscured by bulk approaches. Genome sequencing of prophage-induced populations suggested regional replication at the CGP3 locus in C. glutamicum. Finally, the workflow was applied to unravel iron-triggered prophage induction in early exponential cultures. Here, an up-shift in iron levels resulted in a heterogeneous response of an SOS (PdivS) reporter. RNA-sequencing of the induced subpopulation confirmed induction of the SOS response triggering also activation of the CGP3 prophage. The fraction of CGP3-induced cells was enhanced in a mutant lacking the iron regulator DtxR suffering from enhanced iron uptake. Altogether, these findings demonstrate the potential of the established workflow to gain insights into the phenotypic dynamics of bacterial populations.
Conflict of interest statement
The authors declare no competing interests.
Figures


Similar articles
-
Population Heterogeneity in Corynebacterium glutamicum ATCC 13032 caused by prophage CGP3.J Bacteriol. 2008 Jul;190(14):5111-9. doi: 10.1128/JB.00310-08. Epub 2008 May 16. J Bacteriol. 2008. PMID: 18487330 Free PMC article.
-
Analysis of SOS-induced spontaneous prophage induction in Corynebacterium glutamicum at the single-cell level.J Bacteriol. 2014 Jan;196(1):180-8. doi: 10.1128/JB.01018-13. Epub 2013 Oct 25. J Bacteriol. 2014. PMID: 24163339 Free PMC article.
-
Live cell imaging of SOS and prophage dynamics in isogenic bacterial populations.Mol Microbiol. 2015 Nov;98(4):636-50. doi: 10.1111/mmi.13147. Epub 2015 Aug 22. Mol Microbiol. 2015. PMID: 26235130
-
Construction of a prophage-free variant of Corynebacterium glutamicum ATCC 13032 for use as a platform strain for basic research and industrial biotechnology.Appl Environ Microbiol. 2013 Oct;79(19):6006-15. doi: 10.1128/AEM.01634-13. Epub 2013 Jul 26. Appl Environ Microbiol. 2013. PMID: 23892752 Free PMC article.
-
Prophage Activation in the Intestine: Insights Into Functions and Possible Applications.Front Microbiol. 2021 Dec 13;12:785634. doi: 10.3389/fmicb.2021.785634. eCollection 2021. Front Microbiol. 2021. PMID: 34966370 Free PMC article. Review.
Cited by
-
Impact of Xenogeneic Silencing on Phage-Host Interactions.J Mol Biol. 2019 Nov 22;431(23):4670-4683. doi: 10.1016/j.jmb.2019.02.011. Epub 2019 Feb 21. J Mol Biol. 2019. PMID: 30796986 Free PMC article. Review.
-
Genome-Wide Analysis of DtxR and HrrA Regulons Reveals Novel Targets and a High Level of Interconnectivity Between Iron and Heme Regulatory Networks in Corynebacterium glutamicum.Mol Microbiol. 2025 Aug;124(2):115-130. doi: 10.1111/mmi.15376. Epub 2025 May 16. Mol Microbiol. 2025. PMID: 40376914 Free PMC article.
-
Tailoring Corynebacterium glutamicum for Sustainable Biomanufacturing: From Traditional to Cutting-Edge Technologies.Mol Biotechnol. 2025 Jun 10. doi: 10.1007/s12033-025-01447-z. Online ahead of print. Mol Biotechnol. 2025. PMID: 40493161 Review.
-
Generation of a Prophage-Free Variant of the Fast-Growing Bacterium Vibrio natriegens.Appl Environ Microbiol. 2019 Aug 14;85(17):e00853-19. doi: 10.1128/AEM.00853-19. Print 2019 Sep 1. Appl Environ Microbiol. 2019. PMID: 31253674 Free PMC article.
-
Microbiome Single Cell Atlases Generated with a Commercial Instrument.Adv Sci (Weinh). 2025 Jul;12(27):e2409338. doi: 10.1002/advs.202409338. Epub 2025 Jun 3. Adv Sci (Weinh). 2025. PMID: 40462354 Free PMC article.
References
Publication types
MeSH terms
Substances
LinkOut - more resources
Full Text Sources
Medical
Molecular Biology Databases
Research Materials

