

Real-time Brain Tumor imaging with endogenous fluorophores: a diagnosis proof-of-concept study on fresh human samples
- PMID: 30291269
- PMCID: PMC6173695
- DOI: 10.1038/s41598-018-33134-2
Real-time Brain Tumor imaging with endogenous fluorophores: a diagnosis proof-of-concept study on fresh human samples
Abstract
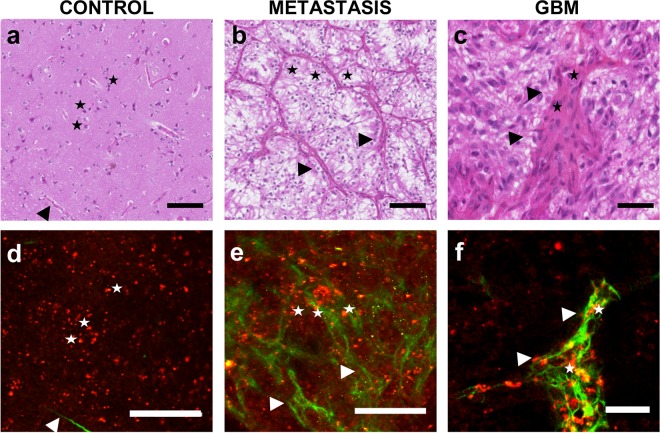
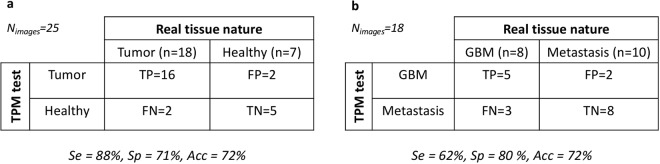
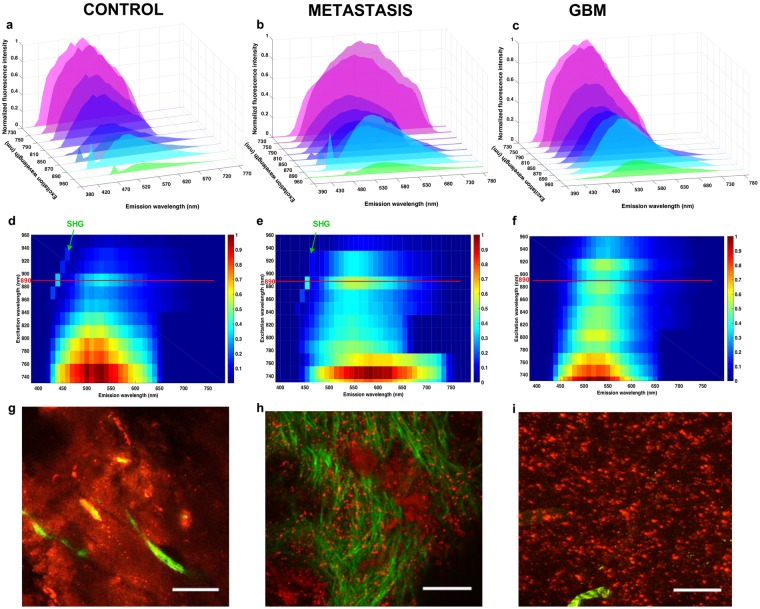
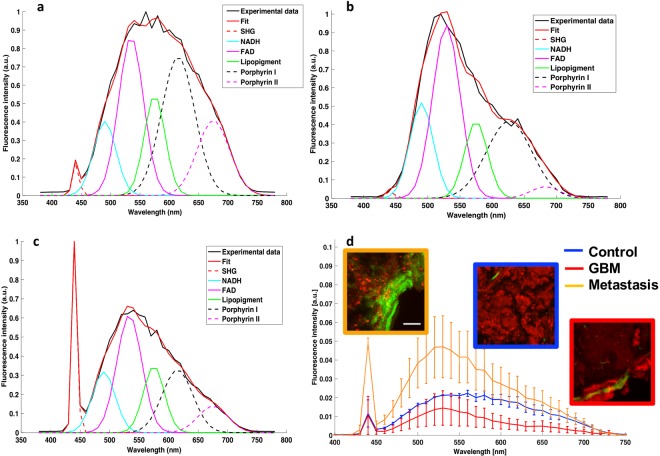
The primary line of therapy for high-grade brain tumor is surgical resection, however, identifying tumor margins in vivo remains a major challenge. Despite the progress in computer-assisted imaging techniques, biopsy analysis remains the standard diagnostic tool when it comes to delineating tumor margins. Our group aims to answer this challenge by exploiting optical imaging of endogenous fluorescence in order to provide a reliable and reproducible diagnosis close to neuropathology. In this study, we first establish the ability of two-photon microscopy (TPM) to discriminate normal brain tissue from glioblastomas and brain metastasis using the endogenous fluorescence response of fresh human brain sample. Two-photon fluorescence images were compared to gold standard neuropathology. "Blind" diagnosis realized by a neuropathologist on a group of TPM images show a good sensitivity, 100%, and specificity, 50% to discriminate non tumoral brain tissue versus glioblastoma or brain metastasis. Quantitative analysis on spectral and fluorescence lifetime measurements resulted in building a scoring system to discriminate brain tissue samples.
Conflict of interest statement
The authors declare no competing interests.
Figures
Similar articles
-
Multimodal imaging to explore endogenous fluorescence of fresh and fixed human healthy and tumor brain tissues.J Biophotonics. 2019 Mar;12(3):e201800178. doi: 10.1002/jbio.201800178. Epub 2018 Oct 23. J Biophotonics. 2019. PMID: 30203459
-
First-in-human intraoperative near-infrared fluorescence imaging of glioblastoma using cetuximab-IRDye800.J Neurooncol. 2018 Aug;139(1):135-143. doi: 10.1007/s11060-018-2854-0. Epub 2018 Apr 6. J Neurooncol. 2018. PMID: 29623552 Free PMC article. Clinical Trial.
-
Whole-brain spectroscopic MRI biomarkers identify infiltrating margins in glioblastoma patients.Neuro Oncol. 2016 Aug;18(8):1180-9. doi: 10.1093/neuonc/now036. Epub 2016 Mar 15. Neuro Oncol. 2016. PMID: 26984746 Free PMC article.
-
Susceptibility-Weighted Imaging of Glioma: Update on Current Imaging Status and Future Directions.J Neuroimaging. 2016 Jul;26(4):383-90. doi: 10.1111/jon.12360. Epub 2016 May 26. J Neuroimaging. 2016. PMID: 27227542 Review.
-
Neuroimaging: diagnosis and response assessment in glioblastoma.Cancer J. 2012 Jan-Feb;18(1):26-31. doi: 10.1097/PPO.0b013e318244d7c8. Cancer J. 2012. PMID: 22290254 Review.
Cited by
-
Histogram clustering for rapid time-domain fluorescence lifetime image analysis.Biomed Opt Express. 2021 Jun 21;12(7):4293-4307. doi: 10.1364/BOE.427532. eCollection 2021 Jul 1. Biomed Opt Express. 2021. PMID: 34457415 Free PMC article.
-
Towards Optical Biopsy in Glioma Surgery.Int J Mol Sci. 2025 May 9;26(10):4554. doi: 10.3390/ijms26104554. Int J Mol Sci. 2025. PMID: 40429698 Free PMC article. Review.
-
Dysplasia and tumor discrimination in brain tissues by combined fluorescence, Raman, and diffuse reflectance spectroscopies.Biomed Opt Express. 2023 Feb 24;14(3):1256-1275. doi: 10.1364/BOE.477035. eCollection 2023 Mar 1. Biomed Opt Express. 2023. PMID: 36950232 Free PMC article.
-
Proof of concept study on differentiating metastatic brain samples by their originating organ using multimodal autofluorescence spectroscopy.Sci Rep. 2025 Apr 3;15(1):11476. doi: 10.1038/s41598-025-92366-1. Sci Rep. 2025. PMID: 40180996 Free PMC article.
-
Confocal Laser Endomicroscopy Assessment of Pituitary Tumor Microstructure: A Feasibility Study.J Clin Med. 2020 Sep 29;9(10):3146. doi: 10.3390/jcm9103146. J Clin Med. 2020. PMID: 33003336 Free PMC article.
References
-
- Pallud Johan, Zanello Marc, Kuchcinski Grégory, Roux Alexandre, Muto Jun, Mellerio Charles, Dezamis Edouard, Oppenheim Catherine. Individual Variability of the Human Cerebral Cortex Identified Using Intraoperative Mapping. World Neurosurgery. 2018;109:e313–e317. doi: 10.1016/j.wneu.2017.09.170. - DOI - PubMed
Publication types
MeSH terms
Grants and funding
- N°CP201401/Institut National de la Santé et de la Recherche Médicale (National Institute of Health and Medical Research)/International
- PC 201601/Institut National de la Santé et de la Recherche Médicale (National Institute of Health and Medical Research)/International
LinkOut - more resources
Full Text Sources
Medical
