

doi: 10.1038/s41375-018-0281-z.
Epub 2018 Oct 5.
Genome-wide association study identifies an acute myeloid leukemia susceptibility locus near BICRA
Affiliations
- PMID: 30291333
- PMCID: PMC6405293
- DOI: 10.1038/s41375-018-0281-z
Item in Clipboard
Genome-wide association study identifies an acute myeloid leukemia susceptibility locus near BICRA
Leukemia.
2019 Mar.
No abstract available
Conflict of interest statement
CONFLICT OF INTEREST
The authors declare no conflict of interest
Figures
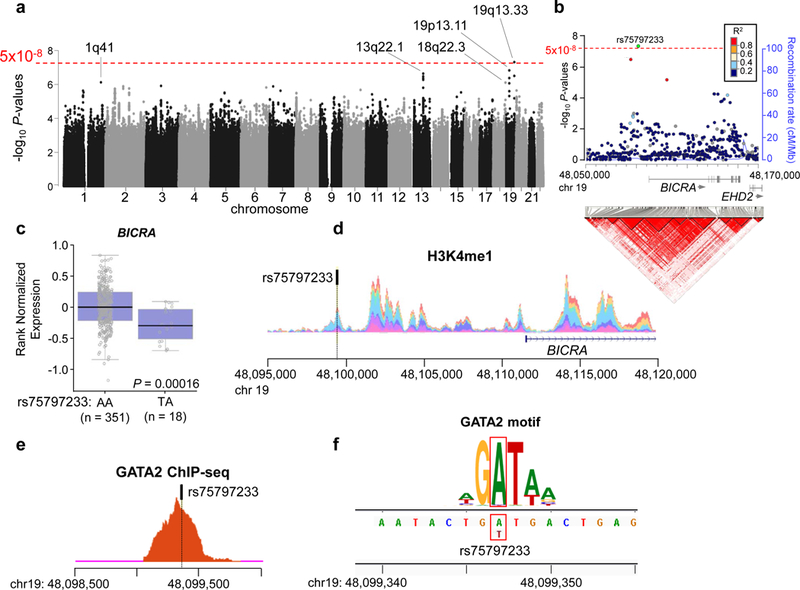
Genome-wide association test from combined analysis of USA1, USA2 and German sample sets reveals the rs75797233 polymorphism near BICRA is associated with acute myeloid leukemia (AML) risk. a Manhattan plot shows -log10
P-values (Y-axis) for all analyzed polymorphisms in the genome. The threshold for significance in a genome-wide association study (5×10⁻⁸) is represented by the red dotted line. b Regional association and linkage disequilibrium plot of the AML risk locus at 19q13. Top, significance of association with AML (-log10
P-values) for all tested polymorphisms is shown on the Y-axis, and the threshold for genome-wide significance (5×10⁻⁸) is represented by the red dotted line. Polymorphisms are colored according to their linkage disequilibrium (R2) with rs75797233 (colored in green). The unbroken blue line behind the circles representing the polymorphisms is the recombination rate. The arrows under gene names show direction of transcription. Bottom, linkage disequilibrium plot shows the pairwise linkage disequilibrium between all polymorphisms in the region. The red triangles indicate the locations of polymorphisms that are likely to be co-inherited. Linkage disequilibrium is plotted according to 1000 Genomes European population (November 2014 release), and genome is plotted according to human genome build GRCh37. c Blood expression levels of BICRA stratified by rs75797233 genotype (AA is homozygous for the non-risk allele and AT is heterozygous). d Layered plot for monomethylation of histone H3 lysine 4 (H3K4me1) shows a peak encompassing rs75797233, which implies an open chromatin state. e Transcription factor chromatin immunoprecipitation sequencing (ChIP-seq) for GATA2 shows a clear peak that encompasses rs75797233, which indicates GATA2 binds to this region. f Position weight matrix shows that the location of rs75797233 (indicated by the red boxes) is within a consensus GATA2 binding motif. The height of different letters at the same position is proportional to their importance for transcription factor binding in the motif.
References
Publication types
MeSH terms
Substances
Grants and funding
- P50 CA140158/CA/NCI NIH HHS/United States
- U10 CA180861/CA/NCI NIH HHS/United States
- UG1 CA233331/CA/NCI NIH HHS/United States
- U10 CA077658/CA/NCI NIH HHS/United States
- P30 CA016056/CA/NCI NIH HHS/United States
- U10 CA180821/CA/NCI NIH HHS/United States
- U10 CA180850/CA/NCI NIH HHS/United States
- UG1 CA233191/CA/NCI NIH HHS/United States
- U10 CA180882/CA/NCI NIH HHS/United States
- UG1 CA233338/CA/NCI NIH HHS/United States
- U24 CA196171/CA/NCI NIH HHS/United States
- P30 CA016058/CA/NCI NIH HHS/United States
- U10 CA180867/CA/NCI NIH HHS/United States
- U10 CA180866/CA/NCI NIH HHS/United States
LinkOut - more resources
Full Text Sources
Medical
