

Epidemiology and risk factors of asthma-chronic obstructive pulmonary disease overlap in low- and middle-income countries
- PMID: 30291842
- PMCID: PMC7079232
- DOI: 10.1016/j.jaci.2018.06.052
Epidemiology and risk factors of asthma-chronic obstructive pulmonary disease overlap in low- and middle-income countries
Abstract
Background: Asthma-chronic obstructive pulmonary disease (COPD) overlap (ACO) represents the confluence of bronchial airway hyperreactivity and chronic airflow limitation and has been described as leading to worse lung function and quality of life than found with either singular disease process.
Objective: We aimed to describe the prevalence and risk factors for ACO among adults across 6 low- and middle-income countries (LMICs).
Methods: We compiled cross-sectional data for 11,923 participants aged 35 to 92 years from 4 population-based studies in 12 settings. We defined COPD as postbronchodilator FEV1/forced vital capacity ratio below the lower limit of normal, asthma as wheeze or medication use in 12 months or self-reported physician diagnosis, and ACO as having both.
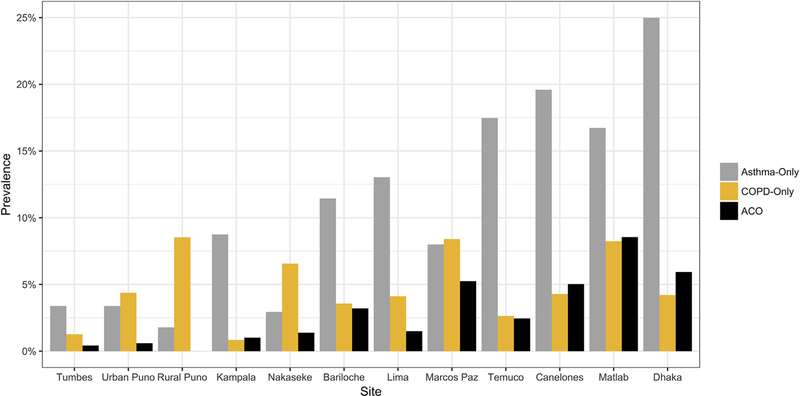
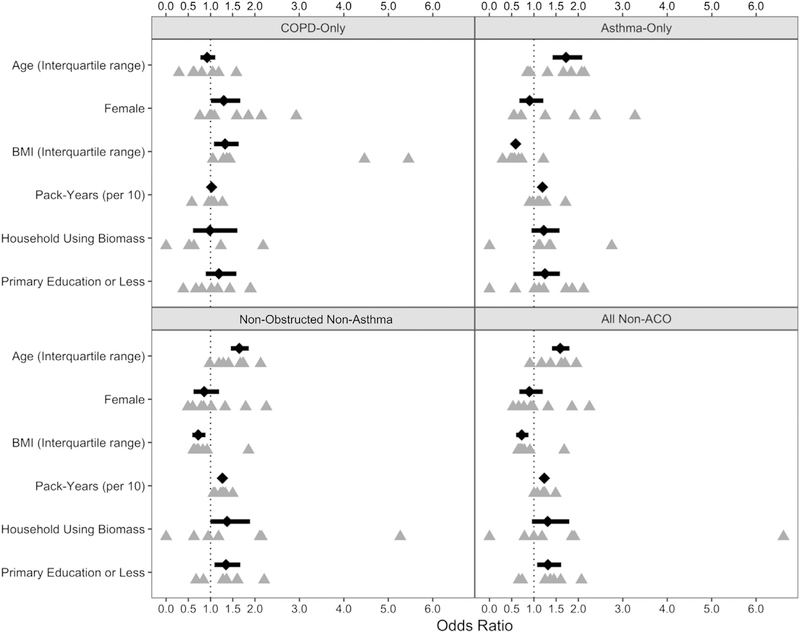
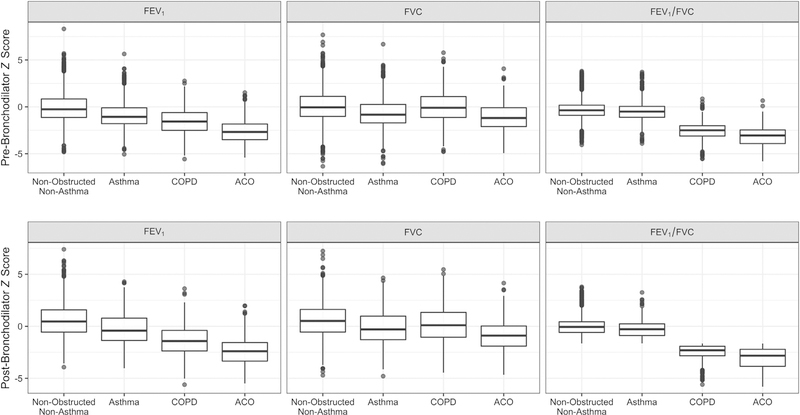
Results: The prevalence of ACO was 3.8% (0% in rural Puno, Peru, to 7.8% in Matlab, Bangladesh). The odds of having ACO were higher with household exposure to biomass fuel smoke (odds ratio [OR], 1.48; 95% CI, 0.98-2.23), smoking tobacco (OR, 1.28 per 10 pack-years; 95% CI, 1.22-1.34), and having primary or less education (OR, 1.35; 95% CI, 1.07-1.70) as compared to nonobstructed nonasthma individuals. ACO was associated with severe obstruction (FEV1 %, <50; 31.6% of ACO vs 10.9% of COPD alone) and severe spirometric deficits compared with participants with asthma (-1.61 z scores FEV1; 95% CI, -1.48 to -1.75) or COPD alone (-0.94 z scores; 95% CI, -0.78 to -1.10).
Conclusions: ACO may be as prevalent and more severe in LMICs than has been reported in high-income settings. Exposure to biomass fuel smoke may be an overlooked risk factor, and we favor diagnostic criteria for ACO that include environmental exposures common to LMICs.
Keywords: ACO; Asthma; COPD; asthma-COPD overlap; chronic obstructive pulmonary disease; epidemiology; health outcomes; overlap; population-based; risk factors; spirometry.
Copyright © 2018 American Academy of Allergy, Asthma & Immunology. Published by Elsevier Inc. All rights reserved.
Conflict of interest statement
Disclosure of potential conflict of interest: R. A. Wise reports grants and/or personal fees from AstraZeneca/Medimmune, Boehringer Ingelheim, Contrafect, GlaxoSmith-Kline, Pfizer, Pulmonx, Roche, Spiration, Sunovion, Teva, Pearl Therapeutics, Merck, and Bonti outside the submitted work. The rest of the authors declare that they have no relevant conflicts of interest.
Figures
Comment in
-
A burning need to redefine airways disease: Biomass smoke exposure identified as a unique risk factor for asthma-chronic obstructive pulmonary disease overlap in low- and middle-income countries.J Allergy Clin Immunol. 2019 Apr;143(4):1339-1341. doi: 10.1016/j.jaci.2018.11.020. Epub 2018 Dec 5. J Allergy Clin Immunol. 2019. PMID: 30529450 Free PMC article. No abstract available.
References
-
- Braman SS. The global burden of asthma. Chest 2006;130:4S–12S. - PubMed
-
- Chan-Yeung M, Ait-Khaled N, White N, Ip MS, Tan WC. The burden and impact of COPD in Asia and Africa. Int J Tuberc Lung Dis 2004;8:2–14. - PubMed
-
- The Global Asthma Report 2014. Auckland, New Zealand: Global Asthma Network; 2014.
-
- Murray CJ, Vos T, Lozano R, Naghavi M, Flaxman AD, Michaud C, et al. Disability-adjusted life years (DALYs) for 291 diseases and injuries in 21 regions, 1990–2010: a systematic analysis for the Global Burden of Disease Study 2010. Lancet 2012;380:2197–223. - PubMed
-
- Leung JM, Sin DD. Asthma-COPD overlap syndrome: pathogenesis, clinical features, and therapeutic targets. BMJ 2017;358:j3772. - PubMed
