. 2019 Jan 15:185:35-57.
doi: 10.1016/j.neuroimage.2018.10.006. Epub 2018 Oct 3.

Mapping the human brain's cortical-subcortical functional network organization

Affiliations

Mapping the human brain's cortical-subcortical functional network organization

Jie Lisa Ji et al. Neuroimage. .

Abstract

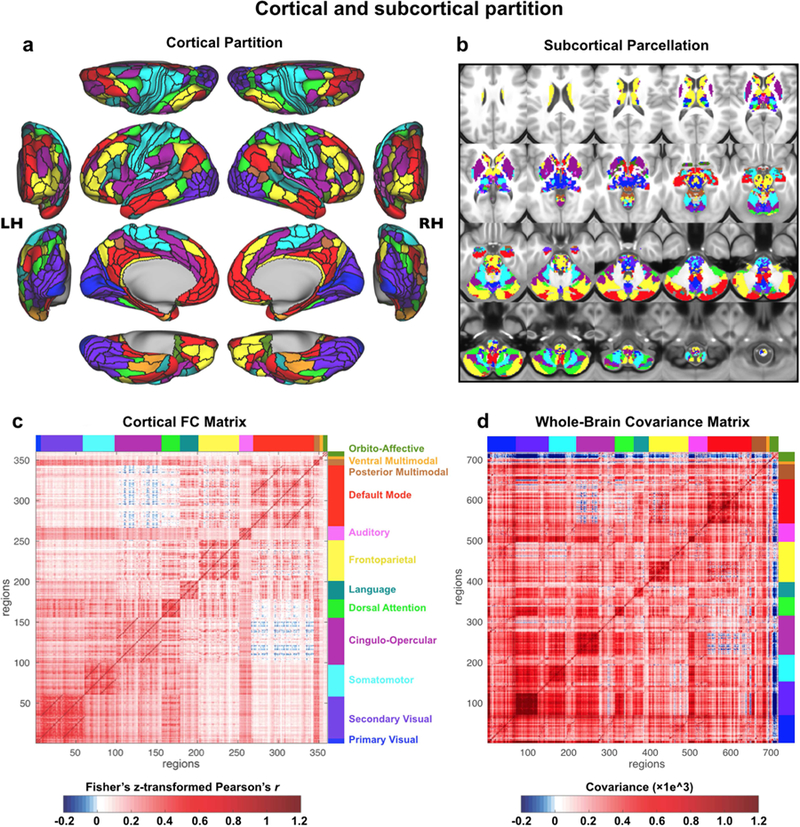
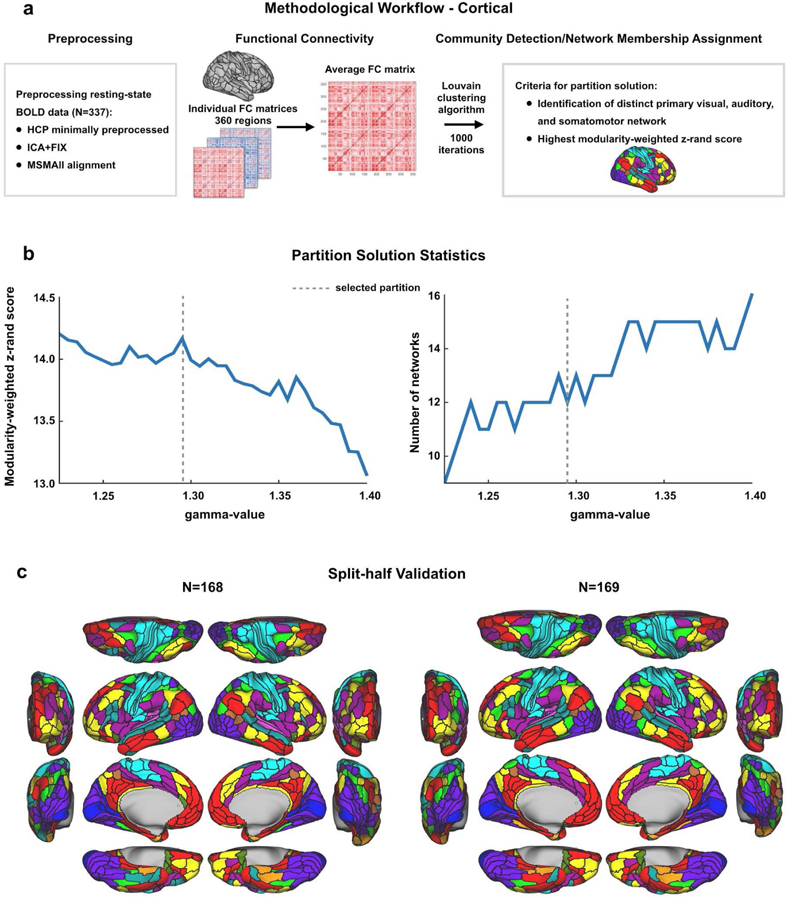
Understanding complex systems such as the human brain requires characterization of the system's architecture across multiple levels of organization - from neurons, to local circuits, to brain regions, and ultimately large-scale brain networks. Here we focus on characterizing the human brain's large-scale network organization, as it provides an overall framework for the organization of all other levels. We developed a highly principled approach to identify cortical network communities at the level of functional systems, calibrating our community detection algorithm using extremely well-established sensory and motor systems as guides. Building on previous network partitions, we replicated and expanded upon well-known and recently-identified networks, including several higher-order cognitive networks such as a left-lateralized language network. We expanded these cortical networks to subcortex, revealing 358 highly-organized subcortical parcels that take part in forming whole-brain functional networks. Notably, the identified subcortical parcels are similar in number to a recent estimate of the number of cortical parcels (360). This whole-brain network atlas - released as an open resource for the neuroscience community - places all brain structures across both cortex and subcortex into a single large-scale functional framework, with the potential to facilitate a variety of studies investigating large-scale functional networks in health and disease.

Keywords: Brain connectivity; Brain networks; Functional MRI; Resting-state functional connectivity.


Figures

Figure 1.
Figure 1.. Cortical-subcortical network partition.
A) The cortical network partition, as calculated with cortical surface resting-state fMRI data using graph community detection. We focused on identifying the network level of organization based on interactions among the next-lowest level of organization – functional regions. Network detection was calibrated based on identification of the well-established primary sensory-motor cortical systems (visual, somatomotor, auditory). Identifying clusters of multimodally-defined cortical regions replicated many known and revealed several novel large-scale networks. B) The network partition identified in cortex was extended to all subcortical gray matter voxels. Briefly, each voxel was assigned to the cortical network with the strongest average resting-state functional connectivity (FC) with that voxel. C) The region-with-region FC matrix within cortex, sorted by network assignment. The block-like structure along the diagonal provides a visualization of the greater FC strength within (relative to between) each network. The darker off-diagonal lines reflect stronger cross-hemisphere FC within networks (since left hemisphere regions are listed first within each network). D) The parcel-toparcel FC (covariance) matrix, including both cortical and subcortical parcels. Covariance is a nonnormalized version of Pearson correlation, used here to account for higher standard deviation of time series in subcortical parcels. We previously validated covariance as a valid alternative to Pearson correlation for 15 FC estimation (Cole et al., 2016b).
Figure 2.
Figure 2.. Cortical partition solution workflow and statistics.
A) Schematic workflow used to create cortical partition. Data were preprocessed for 337 subjects, functional connectivity was calculated between all regions for each subject, and an FC matrix was constructed for each participant. After averaging across subjects, the Louvain clustering algorithm was run with 1000 iterations to detect communities of networks for a range of gamma-values. The final cortical partition was a result of two criteria; a plausible number of networks that included primary sensory/motor networks had to be present, and the most stable and modular partition solution was chosen. B) Plots presenting the modularity-weighted z-rand scores and number of networks in the partition for each gamma-value. The dashed line indicates at which gamma-value the community detection gave the most stable and (neurobiologically) plausible results. C) Split-half validation results for the cortical partition. The original dataset was split in two smaller sets consisting of matched subjects’ data and the Louvain clustering algorithm was run with the same parameters as for the original partition. The two resulting network partitions were both highly similar to each other (92.5% overlap in network assignments) and highly similar to the original one presented in Fig. 1a, indicating that our partition is reliable. See main text for more details.
Figure 3.
Figure 3.. Quantitative assessment of cortical network partition.
A) Cortical map with Network Assignment Confidence scores, reflecting a region’s fc pattern similarity (calculated using Spearman’s rank correlation) to its assigned network divided by similarity to all other networks. These scores are used as a measure of certainty that the network to which a parcel was assigned is the correct one. The mostly homogeneous map indicates similar confidence across regions. Inset shows the distribution of confidence scores across the 360 cortical regions. B) Cortical map displaying Inter-Subject Connectivity Variability, a measure comparing the connectivity patterns for each region across subjects. Similar to panel A, most cortical regions appear to have highly similar values. Inset shows the distribution of intersubject variability 19 across the 360 cortical regions. C) Network averages of the parcel-level network assignment confidence scores (in panel A) are displayed. Error bars indicate standard deviations. Highest confidence scores were found in DMN and lowest in the new orbito-affective network (but note the lower SNR in this area). D) Split-half replication assignment overlap by network. This quantifies the amount of overlap between the split-halves in Fig. 2c. E) Group FC Pattern Asymmetry, reflecting similarity between a region’s (unilateral) functional connectivity pattern and that of its supposed homologue region on the opposite hemisphere. Note the relatively high asymmetry for the language network (LAN) resulting from the leftlateralized language parcels in our partition. F) Scatterplot showing the relationship between Network Assignment Confidence score, Participation Coefficient and SNR for each parcel. See main text for the logic behind this analysis. The non-significant correlation between Confidence and SNR indicates that Confidence scores were not substantially affected by SNR. However, a negative correlation between Confidence and Participation Coefficient could indicate that lower confidence regions partly consist of connector hubs that are shared between multiple networks (violating modularity).
Figure 4.
Figure 4.. Subcortical partition solution workflow and statistics.
A) Schematic workflow used to create subcortical partition. B & C) Split-half replication of the subcortical partition. The subcortical network assignment procedure was performed independently on two smaller sets of subjects matched for 22 demographic variables. D) Proportion of voxels in each network with replicated assignments, before any cleanup steps. Gray bars show proportion of voxels expected to replicate by chance given the size of each network. Solid and dashed red lines indicate upper and lower 95% confidence interval for chance, respectively. E) Proportion of voxels in each network with replicated assignments, after cleanup steps were performed (see Methods). The proportion of voxels with identical network assignments in both Discovery and Replication samples was significantly above chance for 11 out of the 12 networks (p<0.05), suggesting that the subcortical solution is highly replicable.
Figure 5.
Figure 5.. Convergence of cortical and subcortical network partition and motor task activation.
The motor network is shown as evidence for valid extension of cortical functional networks to subcortical regions. A) Combined motor task responses for comparisons between two movements [(left foot > tongue), (left hand > tongue), (right hand > tongue), (right foot > tongue), and (tongue > right foot)] in the cortex, with the SMN outlined in green. B) Combined motor task responses in the subcortex, with the SMN from the wGSR subcortical parcellation outlined in fuchsia. Arrows highlight regions of convergence between task activation and SMN. C) Same data as B but with the woGSR SMN. D) Comparison of overlap between subcortical task activation and subcortical SMN from the wGSR and woGSR partitions. Dashed lines indicate 95% confidence interval for chance. Because the degree of convergence is higher for the wGSR version, we use this for all subsequent subcortical analyses presented in this study. E) Map of the left foot (LF) > tongue (T) contrast in the cortex, with the SMN outlined in green. F) Map of the left hand 24 (LH) > right hand (RH) contrast in the thalamus, with the SMN from the wGSR subcortical parcellation and G) the SMN from the woGSR subcortical parcellation outlined in fuchsia. H) Map of the LH > RH contrast in the cerebellum, with the SMN from the wGSR subcortical parcellation and I) the SMN from the woGSR subcortical parcellation outlined in fuchsia. Note the ipsilateral representation of the hand movements in the cerebellum and the higher convergence of the wGSR parcels relative to the woGSR parcels with task activation.
Figure 6.
Figure 6.. Thalamic network assignment.
A) Network assignment of the thalamus and ventral diencephalon from the network partition described in the manuscript. Top row highlights the horizontal, sagittal, and coronal views of the lateral geniculate nucleus (LGN), indicated by green arrows, and the medial geniculate nucleus (MGN), indicated by pink arrows. White stars mark the voxel seeded for functional connectivity in D and E. Bottom row shows cross-sectional view of the parcellation at different slices. B) Network assignment of the thalamus and ventral diencephalon from the parcellation performed without GSR (woGSR). Without GSR, the auditory network assignment of the MGN was not distinguishable in the parcellation. C) Network assignment of thalamus and ventral diencephalon using cortical network parcellation from Yeo et al. (2011). Note the lack of an auditory network in the Yeo et al. (2011) partition limits the ability to map thalamus relative to the new partition reported here. D) Cortical functional connectivity of the bilateral LGN parcels. VIS1 parcels are outlined in blue. Right hemisphere is 26 shown; similar results were seen in the left hemisphere. E) Cortical functional connectivity of the bilateral MGN parcels. AUD parcels are outlined in blue. Right hemisphere is shown; similar results were seen in the left hemisphere. F) Probabilistic tractography (i.e. ‘structural’ connectivity) of the right primary visual cortex (V1) shown in flat cortical map. Seed grayordinate is highlighted with green dot and arrow. Cortical VIS1 network parcels are outlined in blue. Tractography results were computed from diffusion MRI data obtained from the same subjects and averaged over the entire group. G) Magnified view of V1 seed (green dot) in flat cortical map. H) Inflated cortical view of V1-seeded probabilistic tractography results. I) Right LGN identified using the Jülich atlas (Bürgel et al., 2006; Eickhoff et al., 2005), similar coordinates also reported in (Linzenbold et al., 2011; Marx et al., 2004; A. T. Smith et al., 2009). J) Tractography of V1 seed to subcortex, including the right LGN (green arrows). White stars mark the right LGN voxel from which functional connectivity was seeded in D. Connectivity was strongest between V1, right LGN, and other visual processing regions, including the superior colliculus and brainstem nuclei (blue arrows). Results were similar for the left LGN. K) Probabilistic tractography of the right primary auditory cortex, displayed in flat cortical map. Seed grayordinate is highlighted with green dot and arrow. Cortical AUD network parcels are outlined in fuchsia. L) Magnified view of primary auditory seed (green dot) in flat cortical map. M) Inflated cortical view of auditory-seeded probabilistic tractography results. N) Right MGN identified using the Jülich atlas. O) Tractography of primary auditory seed to subcortex, including right MGN (purple arrows). White stars mark the right MGN voxel from which functional connectivity was seeded in E. Connectivity was strongest between right auditory cortex, right MGN, other thalamic nuclei, and auditory processing regions such as the inferior colliculi (blue arrow). Results were similar for the left MGN. Abbreviations: Lat., lateral; Med., medial; Ant., anterior; Pos., posterior.
Figure 7.
Figure 7.. New posterior multimodal, orbito-affective, and ventral multimodal networks.
A) Cortical parcels that are part of the posterior multimodal (PMM) network as detected by the Louvain clustering algorithm. B) Subcortical areas that were identified as PMM based on correlation with cortical regions. C) Cortical seed map of the PMM network showing connectivity to all other parcels (within-network connectivity is 1 in all PMM parcels). D) Cortical parcels that make up the orbito-affective (ORA) network as detected by the Louvain clustering algorithm. E) Subcortical areas associated with the ORA network. F) Cortical seed map of the ORA network showing connectivity of this network to all other cortical parcels. G) Cortical parcels that are part of the ventral multimodal (VMM) network as detected by the Louvain clustering algorithm. H) Subcortical areas associated with the VMM network. I) Cortical seed map showing connectivity of the VMM network to all other parcels.
Figure 8.
Figure 8.. Language network evaluation.
A & B) Overlap between the language network (LAN, teal outline) from our resting-state based network partition and activations from an independent language processing task (collected in the same sample of 337 subjects) in cortical and subcortical regions. Pink areas indicate overlap between LAN and task activation. Underlay shows task activation t-statistics from 30 the ‘Story versus Baseline’ contrast of the LANGUAGE task, replicating the analysis conducted by Glasser and colleagues (2016). Note that t-scores are shown here because the high statistics resulted in infinity values when converting to Z-scores. C) Percentage overlap between LAN and task activation in the language processing task expected by chance (gray bar) and actual observed overlap in panels A&B (pink bar). Dashed lines indicate 95% confidence intervals. D) Cortical map displaying the asymmetry of parcels. The teal outline indicates the language network, which is highly asymmetric compared to the other networks, with left hemisphere dominance. E & F) Network asymmetry in the subcortex. Colored bars in Panel E show the proportion of subcortical voxels in each network that do not overlap when comparing left and right hemispheres. Complete asymmetry (no overlap) is indicated by dotted line at 100% for reference. gray bars indicate chance asymmetry calculated given the size of each network. Solid and dashed red lines indicate 95% upper and lower confidence intervals for chance respectively. Panel F displays the proportion of total voxels in left and right hemispheres for each network. Chance level for this measure is 50% for all networks; confidence intervals are calculated given the total number of voxels in each network. Because functional representation of left and right is reversed in the cerebellum relative to the rest of the brain (due to the midline crossing of projecting fibers (van Baarsen et al., 2016)), left and right cerebellar hemispheres were exchanged in calculating this measure. Like the cortical networks, panel E&F show that subcortical networks are symmetric in general, with a left lateralized LAN. In subcortex, VMM is also significantly asymmetric. G & H) Functional connectivity seed maps for left and right perisylvian language areas (PSL) based on resting-state data in 337 subjects. Both the left and right language seed area show strongest connections to ipsilateral regions.
Figure 9.
Figure 9.. Demonstration of improved reproducibility and statistics with new partition.
Panels A-F show task activations for a language processing (LANGUAGE task ‘Story versus Baseline’ contrast) task at three different levels. A) Cortical activation map of dense-level analysis. B) Subcortical activation map of dense-level analysis. C) Cortical activation map of parcel-level analysis. Task fMRI data were first parcellated at the parcel level before model fitting. D) Subcortical activation map of parcel-level analysis. E) Cortical activation map of network-level analysis. Task fMRI data were first parcellated at the network level before model fitting. F) Subcortical activation map of network-level analysis. Yellow arrows highlight subcortical regions with a high task-activated t-score, which overlap with parcels in the LAN network. G) t-statistics (LANGUAGE task ‘Story versus Baseline’ contrast) shown in panels A-F significantly improve for the parcel-level vs. dense-level analysis, and for the network-level vs. parcel-level analysis in a combined cortex and subcortex analysis. Error bars are inter-parcel standard deviations. H) tstatistics (LANGUAGE task ‘Story versus Baseline’ contrast) in cortex alone again show significantly 33 better results for the network-level analysis compared to the dense- and parcel-level analyses. I) t-statistics (LANGUAGE task ‘Story versus Baseline’ contrast) in subcortex showed substantially better results for the network-level analysis compared to the dense- and parcel-level analyses. Note that – in contrast to the results for cortex – parcel-level analysis in subcortex does not give an advantage over dense-level analysis. J) An improvement in t-statistics was found when task designs were fit on parcellated time series instead of on dense time series and subsequently averaging for parcels. Blue dots represent 718 parcels × 3 LANGUAGE task contrasts (‘Story versus Baseline’; ‘Math versus Baseline’; ‘Story versus Math’). Insets show the 360 cortical parcels × 3 contrasts (top, green dots) and 358 subcortical parcels × 3 contrasts (bottom, purple dots) separately. K) Improvement in t-statistics was also found when fitting task designs on network time series compared to fitting on dense time series and then averaging for networks. Blue dots represent 12 networks × 3 LANGUAGE task contrasts. Insets show the 12 cortical networks × 3 contrasts (top, green dots) and 12 subcortical parcels × 3 contrasts (bottom, purple dots) separately. L) A further improvement in t-statistics was found when fitting on networks versus fitting on parcels and then averaging for networks. Blue dots represent 12 networks × 3 LANGUAGE task contrasts. Insets show the 12 cortical networks × 3 contrasts (top, green dots) and 12 subcortical parcels × 3 contrasts (bottom, purple dots) separately.

References

    1. Anticevic A, Dierker DL, Gillespie SK, Repovs G, Csernansky JG, Van Essen DC, Barch DM, 2008. Comparing Surface-Based and Volume-Based Analyses of Functional Neuroimaging Data in Patients with Schizophrenia. Neuroimage 41, 835–848. - PMC - PubMed
    1. Baldassano C, Chen J, Zadbood A, Pillow JW, Hasson U, Norman KA, 2017. Discovering Event Structure in Continuous Narrative Perception and Memory. Neuron 95, 709–721. e5. - PMC - PubMed
    1. Barbas H, 2000. Connections underlying the synthesis of cognition, memory, and emotion in primate prefrontal cortices. Brain Res. Bull 52, 319–330. - PubMed
    1. Barch DM, Burgess GC, Harms MP, Petersen SE, Schlaggar BL, Corbetta M, Glasser MF, Curtiss S, Dixit S, Feldt C, Nolan D, Bryant E, Hartley T, Footer O, Bjork JM, Poldrack R, Smith S, Johansen-Berg H, Snyder AZ, Van Essen DC, Consortium, for the WU-Minn HCP, 2013. Function in the human connectome: Task-fMRI and individual differences in behavior. Neuroimage 80, 169–189. - PMC - PubMed
    1. Behrens TEJ, Johansen-Berg H, Woolrich MW, Smith SM, Wheeler-Kingshott CAM, Boulby PA, Barker GJ, Sillery EL, Sheehan K, Ciccarelli O, Thompson AJ, Brady JM, Matthews PM, 2003. Non-invasive mapping of connections between human thalamus and cortex using diffusion imaging. Nat. Neurosci 6, 750–757. - PubMed

Publication types