. 2019 May 21:407:93-107.
doi: 10.1016/j.neuroscience.2018.09.036. Epub 2018 Oct 5.

Testing the Central Gain Model: Loudness Growth Correlates with Central Auditory Gain Enhancement in a Rodent Model of Hyperacusis

Affiliations

Testing the Central Gain Model: Loudness Growth Correlates with Central Auditory Gain Enhancement in a Rodent Model of Hyperacusis

Benjamin D Auerbach et al. Neuroscience. .

Abstract

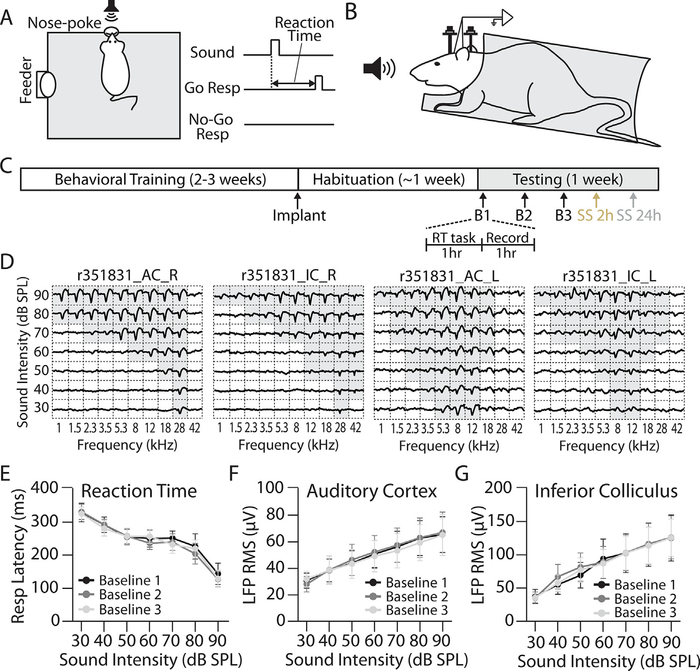
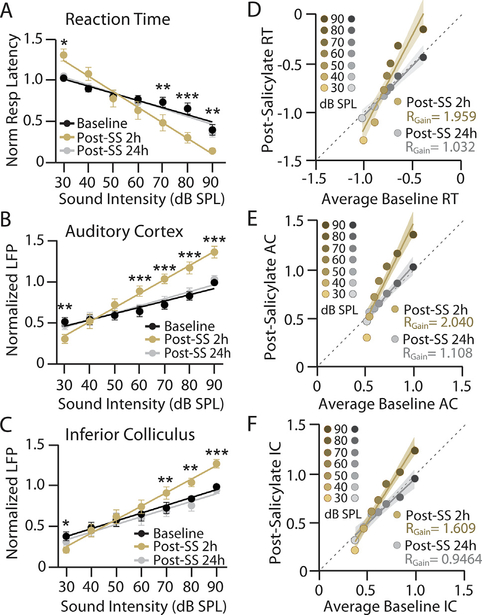
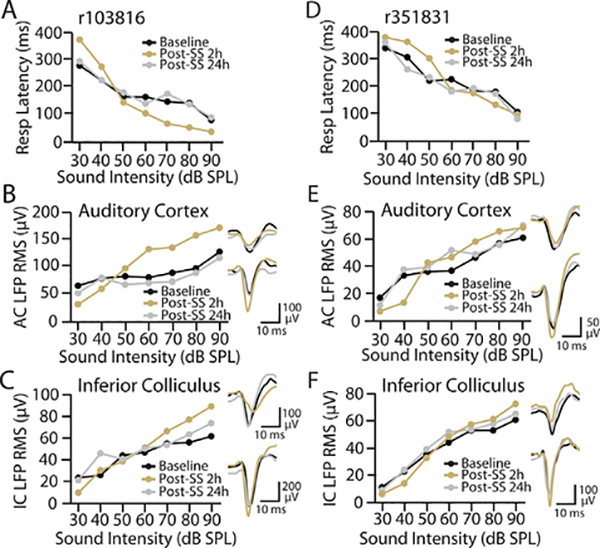
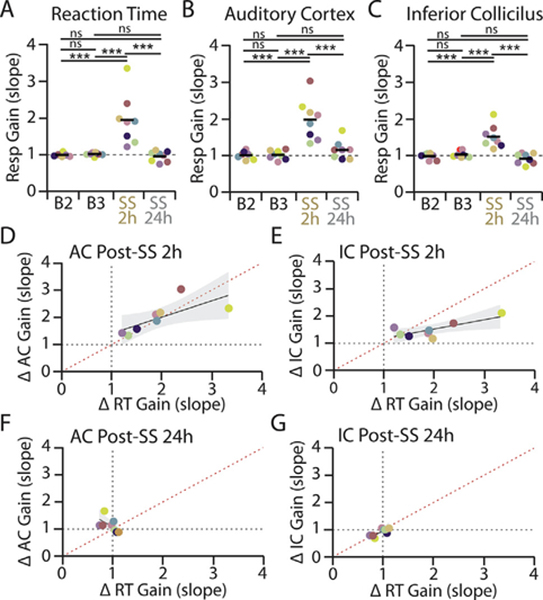
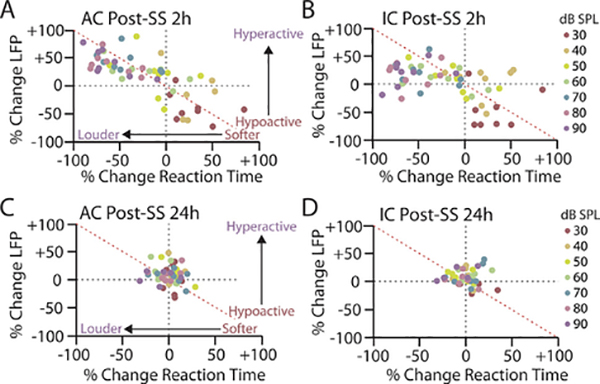
The central gain model of hyperacusis proposes that loss of auditory input can result in maladaptive neuronal gain increases in the central auditory system, leading to the over-amplification of sound-evoked activity and excessive loudness perception. Despite the attractiveness of this model, and supporting evidence for it, a critical test of the central gain theory requires that changes in sound-evoked activity be explicitly linked to perceptual alterations of loudness. Here we combined an operant conditioning task that uses a subject's reaction time to auditory stimuli to produce reliable measures of loudness growth with chronic electrophysiological recordings from the auditory cortex and inferior colliculus of awake, behaviorally-phenotyped animals. In this manner, we could directly correlate daily assessments of loudness perception with neurophysiological measures of sound encoding within the same animal. We validated this novel psychophysical-electrophysiological paradigm with a salicylate-induced model of hearing loss and hyperacusis, as high doses of sodium salicylate reliably induce temporary hearing loss, neural hyperactivity, and auditory perceptual disruptions like tinnitus and hyperacusis. Salicylate induced parallel changes to loudness growth and evoked response-intensity functions consistent with temporary hearing loss and hyperacusis. Most importantly, we found that salicylate-mediated changes in loudness growth and sound-evoked activity were correlated within individual animals. These results provide strong support for the central gain model of hyperacusis and demonstrate the utility of using an experimental design that allows for within-subject comparison of behavioral and electrophysiological measures, thereby making inter-subject variability a strength rather than a limitation.

Keywords: auditory reaction time; central gain enhancement; hyperacusis; local field potentials; sodium salicylate.


Figures

Fig. 1.
Fig. 1.
Experimental design. (A) Behavioral testing. Animals were trained on a Go/No-go operant conditioning task to detect broadband (1–42 kHz) noise bursts presented in pseudorandom order from 30 to 90 dB SPL. Reaction time (RT) was quantified as the latency between sound onset and removal of the rat’s nose from the nose-poke hole on Go trials. (B) Electrophysiological recordings. Behaviorally trained rats were bilaterally implanted with chronic tungsten microelectrodes in the AC and IC. Recordings were made from awake, head-fixed rats while passively listening to the same range of broadband noise bursts used for behavioral testing. (C) Behavioral-electrophysiological paradigm. Animals were tested daily to collect RT-I functions (see Methods and panel A.). Immediately following behavioral testing, auditory-evoked local field potentials (LFPs) were recorded from RT-I-trained rats (see Methods and panel B). Following 3 baseline LFP testing sessions (every other day over 5 days), rats were treated with sodium salicylate (SS; 200 mg/kg, i.p.) and then RT-I functions, followed by LFP input/output (I/O) functions, were collected beginning 2 h and 24 h post-SS. (D) Representative LFP tuning curves from the left (L) and right (R) AC/IC of an awake animal. Tone-evoked LFP responses were well-tuned for frequency and matched for characteristic frequency within but not between hemispheres. Scale for each division is 400 μV by 30 ms. (E) Mean (n = 8) of three baseline RT-I functions; note close overlap of three measurements. (F) Mean AC and (G) IC I/O functions (n = 8) collected concurrently from the same animals over the same 3 baseline days of testing as RT-I functions in (E). Note overlap and stable measures over all three AC and IC baseline test sessions. One-way repeated measures ANOVA found no significant effect of testing session for RT-I (F(2,18) = 0.037, p = 0.98, ƞ2 = 0.004), AC LFP I/O (F(2,18) = 0.053, p = 0.98, ƞ2 = 0.006), or IC LFP I/O (F(2,18) = 0.019, p = 0.99, ƞ2 = 0.002) functions. Data points represent mean ± SEM.
Fig. 2.
Fig. 2.
Salicylate induces time-dependent parallel changes to reaction time, cortical, and subcortical response-intensity functions in a manner consistent with temporary hearing loss, increased loudness perception and central gain enhancement. A-C: Mean (n = 8) (A) RT-I functions, (B) AC LFP I/O functions, and (C) IC LFP I/O functions from behaviorally trained rats with chronically implanted electrodes before and after sodium salicylate (SS) administration (200 mg.kg, i. p.); data shown before (black), 2 h post-SS (orange), and 24 h post-SS (gray). Baseline (black) represents average response across three baseline sessions. For ease of comparison, all responses were normalized to maximum average baseline response to account for between-subject differences in absolute RTs and AC/IC response size. Data points represent mean +/−SEM. Lines represent linear fit of RT, AC, and IC response functions, which were used to determine changes in response slope (see Table 1). Two-way repeated measure ANOVAs found significant main effects of SS treatment and sound intensity, as well as an interaction between the two, for RT (SS: F2,98 = 8.84, **p = 0.0003, ηp2=0.14; Intensity: F6,98 = 28.82, ***p < 0.0001, ηp2=0.81; interaction: F12,98 = 6.14, ***p < 0.0001, ηp2=0.40), AC responses (SS: F2,98 = 35.64, ***p < 0.0001, ηp2=0.42; Intensity: F6,98 = 22.03, ***p < 0.0001, ηp2=0.87; interaction: F12,98 = 8.90, ***p < 0.0001, ηp2=0.51) and IC responses (SS F2,98 = 25.18, ***p < 0.0001, ηp2=0.34; Intensity: F6,98 = 17.83, ***p < 0.0001, ηp2=0.92; interaction F12,98 = 4.67, ***p < 0.0001, 0.46). Post-hoc significance for intensity-dependent effects of SS at 2 h compared to baseline signified as: *p < 0.05, **p < 0.01, ***p < 0.0001. No significant effects of were found between baseline and 24 h post-SS. D-F: Scatter plots comparing the average normalized baseline response at each intensity against the normalized response 2 h post-SS (orange-brown) or 24 h post-SS (gray-black) of equivalent intensity for (D) RT, (E) AC LFP, and (F) IC LFP responses. The slope of the linear fit (RGain) provides an estimate of the change in response gain across conditions where RGain = 1 indicates a response growth rate matched to baseline levels while RGain > 1 and RGain < 1 indicate a multiplicative enhancement or divisive decrease in response growth rate compared to baseline, respectively. Shading represents 95% confidence interval of linear fit. A two-tailed F-test determined that RGain was significantly different from 1 at 2 h post-SS for RT-I, AC, and IC LFP functions (RT: RGain = 1.959, F(1,54) = 21.89, ***p < 0.0001, d = 3.31; AC: RGain = 2.040, F(1,54) = 31.84, ***p < 0.0001, d = 3.99; IC: RGain = 1.609, F(1,54) = 26.19, ***p < 0.0001, d = 3.62). A 24 h post-SS, no response gain significantly deviated from 1 (RT: RGain = 1.032, F(1,54) = 0.070, p = 0.792, d = 0.187; AC: RGain = 1.108, F(1,54) = 0.596, p = 0.444, d = 0.546; IC: RGain = 0.9464, F(1,54) = 0.190, p = 0.665, d = 0.308).
Fig. 3.
Fig. 3.
Individual variability in behavioral and electrophysiological response to salicylate administration. A-C: Example animal that exhibited significant changes to (A) RT, (B) AC, and (C) IC response functions 2 h post-SS (orange), which recovered to baseline (black) levels by 24 h post-SS (gray). D-F: Example animal that exhibited relatively mild alterations to (A) RT, (B) AC, and (C) IC response functions following salicylate administration. Waveforms represent LFP response from each animal in each auditory area to 30 dB SPL (top) or 90 dB SPL (bottom) noise bursts during baseline (black), 2 h post-SS (orange) or 24 h post-SS (gray).
Fig. 4.
Fig. 4.
Salicylate-induced changes to reaction time and evoked response-intensity functions co-vary within individual animals. A-C: Response gain (RGain), as quantified in Fig. 2D–F, was determined for each animal (n = 8) over the final two baseline testing sessions (B2, B3), 2 h post-SS and 24 h post-SS for (A) RT, (B) AC, and (C) IC response functions. Each color corresponds to an individual animal. One-way repeated measures ANOVAs found a significant effect of SS treatment on RT (F(3,28) = 14.44, ***p < 0.0001, ƞ2 = 0.67), AC LFP (F(3,28) = 19.25, ***p < 0.0001, ƞ2 = 0.73) and IC LFP (F(3,28) = 15.20, ***p < 0.0001, ƞ2 = 0.68) response gains. Post-hoc significance ***p < 0.0001. There was also a significant increase in the variance of response gains following SS administration (RT: Bartlett’s statistic for equal variance = 58.7, *** p < 0.0001; AC: Bartlett’s statistic = 22.97, ***p < 0.0001; IC: Bartlett’s statistic = 15.62, **p = 0.0014). D-G: Relationship between changes to RT-I and evoked response following salicylate administrations. Correlation between the fold change in RT gain (RGain) versus (D) AC response gain or (E) IC response gain at 2 h post-SS. F-G: Correlation between the fold change in RT gain and (F) AC response gain or (G) IC response gain at 24 h post-SS. Each color corresponds to an individual animal as in panels A-C. Shading represents 95% confidence intervals of linear fit (black). Red dotted line corresponds to 45° unity line.
Fig. 5.
Fig. 5.
Relationship between salicylate-induced changes to reaction time and evoked response is intensity-dependent. A,B: Scatter plot of percent change in RT, as compared to the average baseline, for each animal at each intensity versus percent change in (A) AC or (B) IC LFP magnitude 2 h post-SS. C,D: Scatter plot of percent change in RT, as compared to the average baseline response, for each animal at each intensity versus percent change in (C) AC or (D) IC evoked response 24 h post-SS. Each color corresponds to a specific sound intensity. Each point signifies the relationship between behavioral and electrophysiological response magnitude at a specific intensity for a specific animals (n = 8).

References

    1. Anari M, Axelsson A, Eliasson A, Magnusson L (1999) Hypersensitivity to sound–questionnaire data, audiometry and classification. Scand Audiol 28:219–230. 10.1080/010503999424653. - DOI - PubMed
    1. Arieh Y, Marks LE (2003) Time course of loudness recalibration: implications for loudness enhancement. J Acoust Soc Am 114:1550–1556. 10.1121/1.1603768. - DOI - PubMed
    1. Auerbach BD, Rodrigues PV, Salvi RJ (2014) Central gain control in tinnitus and hyperacusis. Front Neurol 5:206. 10.3389/fneur.2014.00206. - DOI - PMC - PubMed
    1. Baguley DM (2003) Hyperacusis. J R Soc Med 96:582–585. 10.1177/0141076800309601203. - DOI - PMC - PubMed
    1. Boettcher FA, Bancroft BR, Salvi RJ (1990) Concentration of salicylate in serum and perilymph of the chinchilla. Arch Otolaryngol Head Neck Surg 116:681–684. 10.1001/archotol.1990.01870060039005. - DOI - PubMed

Publication types

MeSH terms

Substances