. 2018 Oct 26:8:85-102.
doi: 10.1016/j.isci.2018.09.014. Epub 2018 Sep 20.

M1 Macrophage Polarization Is Dependent on TRPC1-Mediated Calcium Entry

Affiliations

M1 Macrophage Polarization Is Dependent on TRPC1-Mediated Calcium Entry

Arun Chauhan et al. iScience. .

Abstract

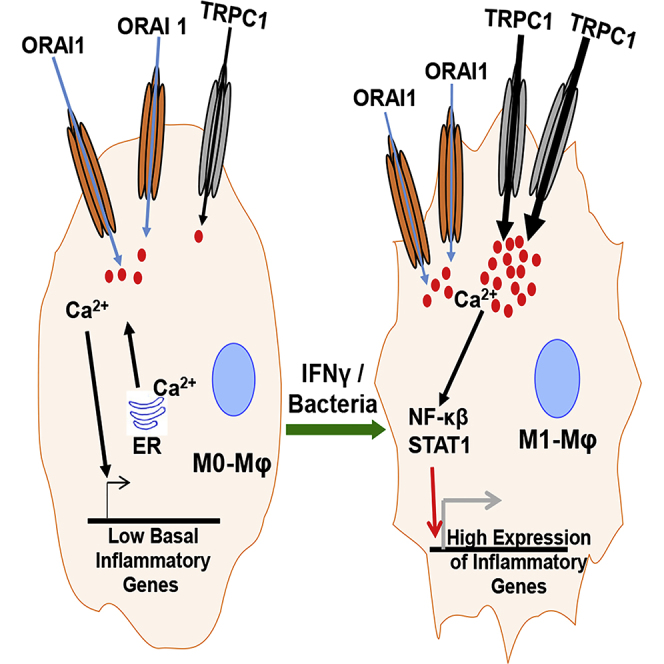
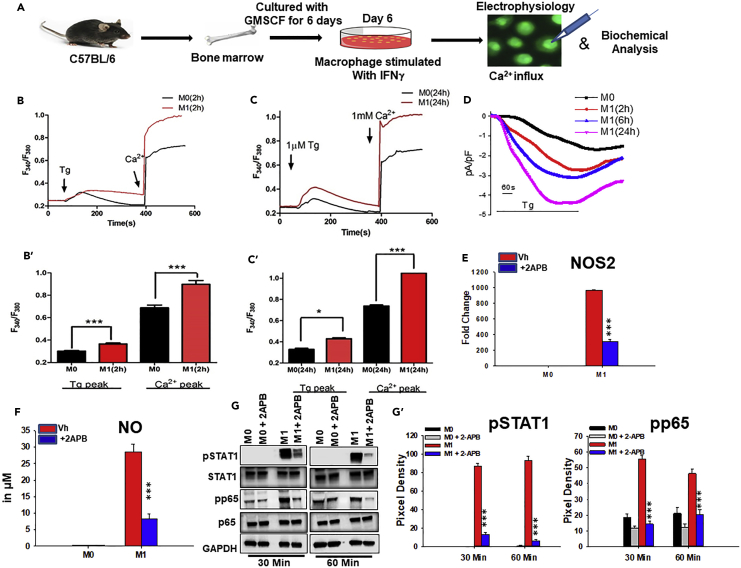
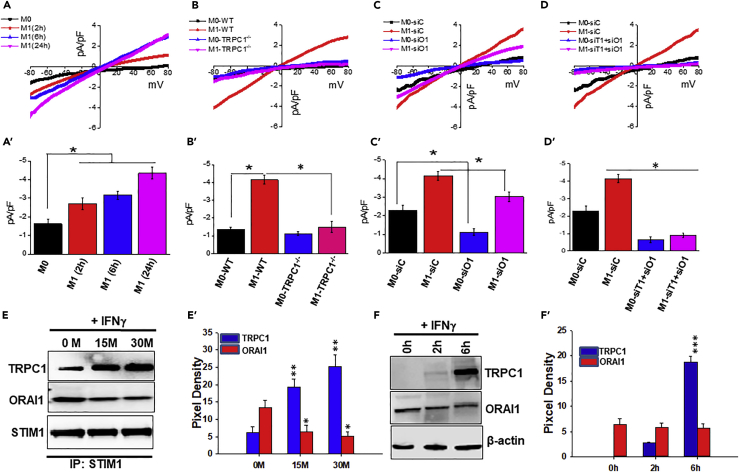
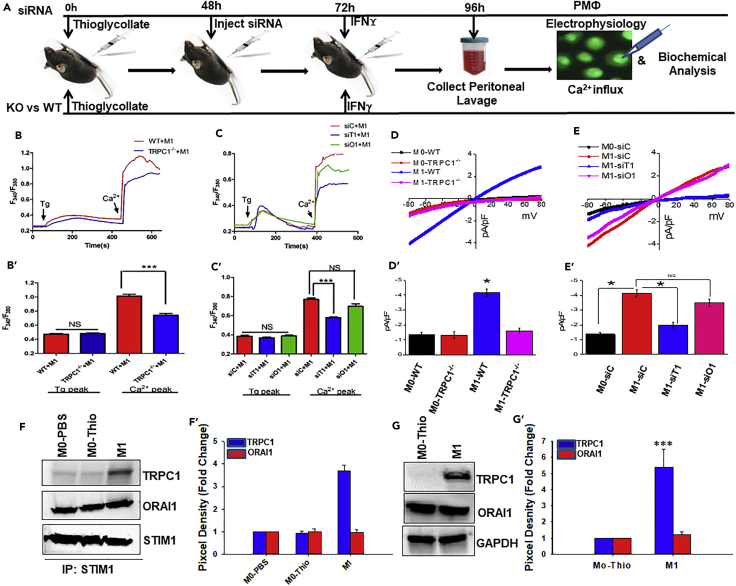
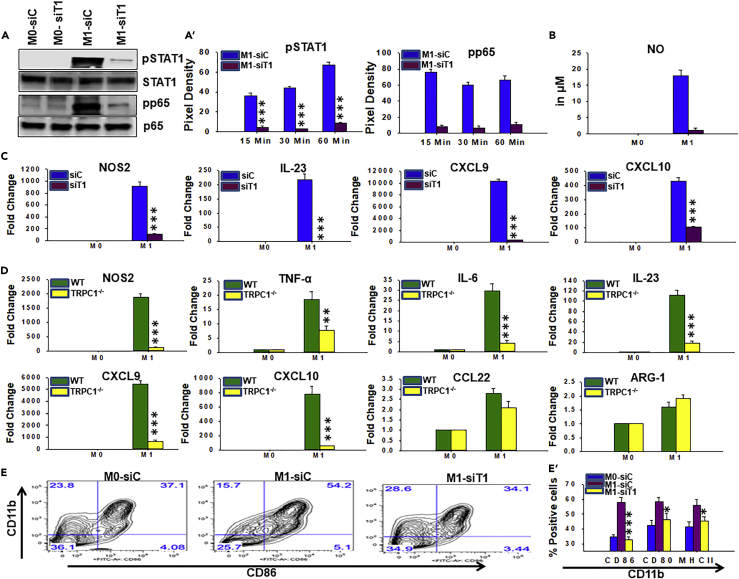
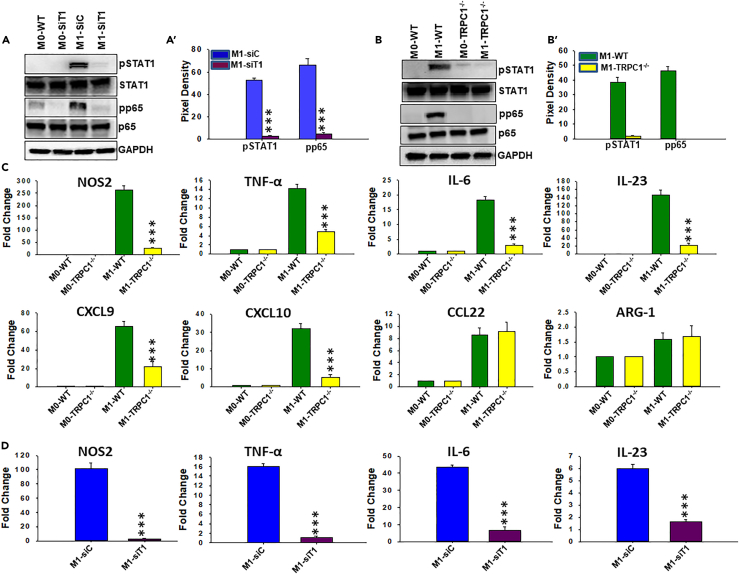
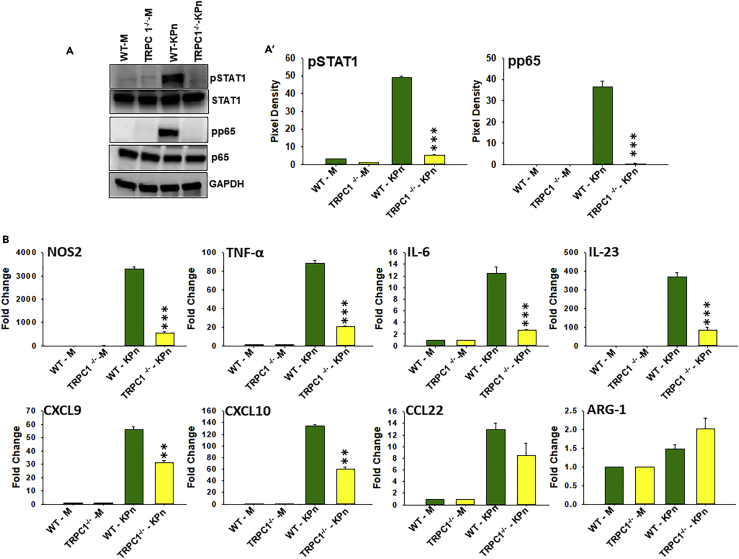
Macrophage plasticity is essential for innate immunity, but in-depth signaling mechanism(s) regulating their functional phenotypes are ill-defined. Here we report that interferon (IFN) γ priming of naive macrophages induces store-mediated Ca2+ entry and inhibition of Ca2+ entry impairs polarization to M1 inflammatory phenotype. In vitro and in vivo functional analyses revealed ORAI1 to be a primary contributor to basal Ca2+ influx in macrophages, whereas IFNγ-induced Ca2+ influx was mediated by TRPC1. Deficiency of TRPC1 displayed abrogated IFNγ-induced M1 inflammatory mediators in macrophages. In a preclinical model of peritonitis by Klebsiella pneumoniae infection, macrophages showed increased Ca2+ influx, which was TRPC1 dependent. Macrophages from infected TRPC1-/- mice showed inhibited expression of M1-associated signature molecules. Furthermore, in human patients with systemic inflammatory response syndrome, the level of TRPC1 expression in circulating macrophages directly correlated with M1 inflammatory mediators. Overall, TRPC1-mediated Ca2+ influx is essential for the induction/shaping of macrophage polarization to M1 inflammatory phenotype.

Keywords: Biological Sciences; Immune Response; Immunology.


Figures

None
Graphical abstract
Figure 1
Figure 1
IFNγ Induces Ca2+ Influx and Shapes M1 Functional Phenotype Development in Macrophage In Vitro (A) BM macrophages were generated in vitro (20 ng/mL GMCSF) and cultured in the presence or absence of 20 ng/mL IFNγ (-phenotype inducer). Whole-cell patch-clamp and imaging analysis on these cells were performed to measure IFNγ-induced effects on Ca2+ release and influx. M1-associated mediators were measured in cells cultured in the presence or absence of 50 μM 2APB (Ca2+ entry inhibitor) by western blot, RT-PCR, and colorimetric assay. (B and C) BM macrophages were pulsed with medium alone (M0) or IFNγ (M1) for 2 and 24 hr and loaded with Fura-2AM. 1 μM Tg was added (first arrow) to the Fura-2AM-loaded cells bathed in Ca2+-free medium to measure the internal Ca2+ release (first peak); thereafter 2 mM external Ca2+ was added (second arrow) to measure Ca2+ entry/influx through PM (second peak). Average analog plots of the fluorescence ratio (340/380 nm) from an average of 40–50 cells are shown. (B′ and C′) The corresponding bar graphs represent the mean ± SEM of Ca2+ release (first peak) and store-operated Ca2+ entry (SOCE) (second peak) under these conditions. (D) Representative time course of Ca2+ current at −80 mV with 0 mV holding potential from BM macrophages pulsed with medium alone (M0) or IFNγ. Whole-cell patch-clamp was performed with Tg in the pipette solution. (E) Comparison of NOS2 mRNA expression by qPCR analysis of BM macrophages cultured in medium alone (M0) or with IFNγ (M1) in the presence or absence of 2APB. The bars are representative of three independent experiments. (F) Comparison of NO levels in culture supernatant of BM macrophages cultured with medium alone (M0) or IFNγ (M1) in the presence or absence of 2APB. Data shown are Mean ± SEM. (G) The level of pNF-κB p65 (pp65) (Cell Signaling, 3033S), pSTAT1 (Cell Signaling, 9167S), GAPDH, p65, or STAT1 in BM macrophages cultured with medium alone (M0) or IFNγ (M1) in the presence or absence of 2APB by immunoblot. Data shown are representative of three independent experiments with similar results. The average pixel intensity of pSTAT1 or pp65 bands was measured and expressed in bar graphs as mean ± SEM (G′). *p ≤ 0.05, ***p ≤ 0.001 (Student's t test). See also Figure S1.
Figure 2
Figure 2
PM Ca2+ Influx Channels in M1 Macrophages In Vitro (A) BM macrophages were pulsed with medium alone (M0) or IFNγ (M1) for the indicated times and subjected to whole-cell patch clamp recordings. The I-V curves display presence of signature current for TRPC1 channels in M1 macrophages and for ORAI1 channels in M0 macrophages. Averages of 8–10 recordings at −80 mV and corresponding statistics are shown in bar graph (A′). (B) Comparison of IV curves of WT and TRPC1−/− macrophages cultured with medium alone (M0) for 24 hr, or IFNγ (M1) for 24 hr. The signature current for TRPC1 channels increased in IFNγ-exposed WT macrophages, but not in TRPC1−/− macrophages. Average current density recordings from 8 to 10 cells at −80 mV and corresponding statistics are shown in bar graph (B′). (C) BM macrophages transfected with control siRNA (siC) or siRNA specific for ORAI1 (siO1) were cultured under M0 and M1 conditions for 24 hr. I-V curves were compared in control and ORAI1 knockdown cells by whole-cell patch-clamp recordings. Statistics from 8–10 recordings are shown in bar graph (C′). (D) I-V curves were compared between BM macrophage transfected with control siRNA (siC) and cells transiently transfected with siRNA against TRPC1 and ORAI1 together (siT1+siO1) and cultured under M0 and M1 conditions for 24 hr. Averages (8–10 recordings at −80 mV) and statistics are shown in bar graph (D′). (E) Representative time course of TRPC1 and ORAI1 protein expression in response to IFNγ by BM macrophages after immunoprecipitation with anti-STIM1 antibody (Cell Signaling, 4916S), followed by immunoblotting as seen upon subjecting 30 μg protein to SDS-PAGE and anti-TRPC1 (Abcam, ab192031), anti-ORAI1 (Alamone Lab, ACC-060), or anti-STIM1 (Cell Signaling, 4916S; used as loading control). The bar graphs (E′) represent average pixel intensity of the respective protein bands from three independent experiments. (F) TRPC1 and ORAI1 protein expression in BM macrophage pulsed with IFNγ for 0 min, 2 hr, or 6 hr by western blot as seen subjecting 30 μg protein to SDS-PAGE and using anti-TRPC1 (Abcam, ab192031), anti-ORAI1 (Alamone Lab, ACC-060), or β-actin (Cell Signaling, 4970S). The bar graphs (F′) represent the average pixel intensity of the respective TRPC1 and ORAI1 protein bands from three independent experiments. *p ≤ 0.05, **p ≤ 0.01, ***p ≤ 0.001 (Student's t test). See also Figures S2 and S4.
Figure 3
Figure 3
TRPC1 Mediates IFNγ-Induced Ca2+ Influx in Peritoneal Macrophages In Vivo (A) Schematic showing calcium imaging, electrophysiological recordings, and biochemical analysis performed on peritoneal macrophages (peritoneal macrophages) from IFNγ i.p. injected WT and TRPC1−/− mice or mice injected with TRPC1 siRNA or ORAI1 siRNA to transiently knock down these proteins in vivo before the animals received IFNγ. (B) Ca2+ entry triggered by Tg in peritoneal macrophages from WT or TRPC1−/− mice that received IFNγ i.p. (M1). Analog plots of the fluorescence ratio (340/380 nm) from an average of 40–50 cells are shown. The bar graph (B′) indicates means ± SEM of the Ca2+ release (left peak in B) and store-operated Ca2+ entry (SOCE) (right peak in B). (C) Ca2+ entry triggered by Tg in IFNγ-exposed peritoneal macrophages transiently deficient in TRPC1 (M1-siT1) or ORAI1 (M1-siO1), or control cells (M1-siC) obtained from mice that received non-targeting siRNA. Analog plots of the fluorescence ratio (340/380 nm) from an average of 40–50 cells are shown. The bar graph (C′) indicates means ± SEM of the Ca2+ release. (D) I-V curves in peritoneal macrophages from WT or TRPC1−/− mice that received IFNγ (M1) or vehicle (M0) i.p. Average of 8–10 recordings for current intensity at −80 mV is presented in the bar graph (D′). (E) IFNγ-exposed peritoneal macrophages transiently deficient in TRPC1 (M1-siT1) or ORAI1 (M1-siO1), or control cells (M1-siC) were subjected to whole-cell patch-clamp recordings. Average of 8–10 recordings used for I-V relationships are shown in bar graph (E′). (F) TRPC1-STIM1 and ORAI1-STIM1 complex formation in peritoneal macrophages from C57BL/6 mice i.p. injected with PBS (M0-PBS), thioglycolate (M0-Thio) and PBS, or thioglycolate and IFNγ (M1). Immunoprecipitation was performed on 250 μg of protein extracts from approx. 5 × 106 cells using anti-STIM1 antibodies (Cell Signaling, 4916S) as seen after subjecting the immunoprecipitates to SDS-PAGE followed by immunoblot detection with anti-TRPC1 (Abcam, ab192031) and anti-ORAI1(Alamone Lab, ACC-060). Anti-STIM1 (Cell Signaling, 4916S) was used for loading control. Bar graph (F′) represents the average pixel intensity of the respective protein bands from three independent experiments. (G) TRPC1 and ORAI1 protein expression in peritoneal macrophages from C57BL/6 mice i.p. injected with PBS (M0-PBS), thioglycolate and PBS (M0-Thio), or thioglycolate and IFNγ (M1) as seen subjecting 30 μg protein to SDS-PAGE and using anti-TRPC1 (Abcam, ab192031), anti-ORAI1 (Alamone Lab, ACC-060), or anti-GAPDH for western blot. Bar graph (G′) represents the average pixel intensity of the respective protein bands from three independent experiments. *p ≤ 0.05, ***p ≤ 0.001 (Student's t test). See also Figure S3.
Figure 4
Figure 4
Effect of TRPC1 Deficiency on the Ability of IFNγ to Induce M1 Macrophages In Vitro To analyze the effect of TRPC1 deficiency on M1 macrophage functions, BM macrophages from WT and TRPC1−/− mice were generated in vitro. In addition, BM macrophages from C57BL/6 mice were transfected with non-targeting siRNA or TRPC1 siRNA to transiently knock down TRPC1. Cells were cultured in the presence or absence of IFNγ, and the level of M1-associated signature immune mediators and transcriptions factors were measured by western blot, RT-PCR, and colorimetric assay. (A) BM macrophages transfected with non-targeting siRNA (siC), or TRPC1 siRNA (siT1) were pulsed with medium alone (M0-siC, M0-siT1) or IFNγ (M1-siC, M1-siT1). Immunoblot analysis were performed using anti-pSTAT1, anti-pNFκB p65 (pp65), STAT1, and p65. The average pixel intensity of the pSTAT1 and pp65 protein bands from three independent experiments is shown in A′. (B) NO was assessed by colorimetric assay in supernatants collected at 24 hr from SiC and siT1 cells treated as described in (A). (C) The relative mRNA expression of M1 inflammatory mediators, NOS2, IL-23, CXCL9, and CXCL10 in BM macrophages transfected with control siRNA (siC) or TRPC1 siRNA (siT1) and pulsed for 24 hr with IFNγ (M1) versus medium only (M0). (D) The relative mRNA levels of M1 inflammatory mediators, NOS2, TNF-ᾳ, IL-6, IL-23, CXCL9, and CXCL10, and M2 anti-inflammatory mediators, CCL22 and arginase-1 (ARG-1), were analyzed in BM macrophages from WT and TRPC1−/− mice and pulsed for 24 hr with IFNγ (M1) versus medium only (M0). (E) BM macrophages transfected with control siRNA or TRPC1 siRNA and pulsed for 24 hr with medium only (M0-siC, M0-siT1) or IFNγ (M1-siC, M1-siT1). The surface expression of costimulatory molecule CD86 was measured by flow cytometry. Plots in (E′) depict the mean ± SEM of M0-siC, M0-siT1, M1-siC, and M1-siT1 cells expressing MHC-II, CD80, or CD86 as measured by flow cytometry (density plots shown in E and Figure S4B). *p ≤ 0.05, **p ≤ 0.01, ***p ≤ 0.001 (Student's t test). See also Figures S4–S7.
Figure 5
Figure 5
TRPC1 Deficiency Results in Reduced IFNγ-Induced Phosphorylation of STAT1 and NF-κB as well as Impaired Production of M1 Inflammatory Mediators in Peritoneal Macrophages In Vivo Immunoblotting and qRT-PCR analysis were performed on peritoneal macrophages from IFNγ i.p.-injected WT and TRPC1−/− mice. IFNγ-induced effect was also analyzed in peritoneal macrophages in which TRPC1 was transiently knocked down in vivo by i.p. injection of TRPC1 siRNA before the animals received IFNγ. (A) Peritoneal macrophages transiently deficient in TRPC1 or control cells from mice that received siRNA specific for TRPC1 or non-targeting siRNA were harvested 24 hr after i.p. injection with vehicle (M0-siC, M0-siT1) or IFNγ (M1-siC, M1-siT1). Western blot analysis using anti-pSTAT1, pp65, p65, STAT1, and anti-GAPDH was performed on equal amount of the respective cell lysates. The bar graph (A′) depicts average ± SEM of pixel intensity of the pSTAT1 and pp65 protein bands. (B) Immunoblots of pSTAT1 and pp65 levels in peritoneal macrophages from PBS- (M0) or IFNγ (M1)-injected WT and TRPC1−/−mice. The bar graph (B′) depicts averages ±SEM of pixel intensity of the pSTAT1 and pp65 protein bands. (C) The expression of M1-associated inflammatory mediators and M2-specific anti-inflammatory mediators measured by qRT-PCR in peritoneal macrophages from PBS- (M0) or IFNγ (M1)-injected WT and TRPC1−/−mice. (D) The expression of M1-associated inflammatory mediators in M0 and M1 peritoneal macrophages from PBS- (M0) or IFNγ (M1)-injected mice measured by qRT-PCR after in vivo treatment with siC or siT1 RNA, detailed in (A). ***p ≤ 0.001 (Student's t test). See also Figure S8.
Figure 6
Figure 6
TRPC1 Mediates Ca2+ Influx in Macrophage during Preclinical Peritonitis due to Klebsiella pneumoniae (KPn) Infection and in Human Patients with SIRS (A) Calcium imaging and electrophysiological recordings were performed on peritoneal macrophage from WT and TRPC1−/− mice i.p. infected with KPn for 24 hr. (A1) Peritoneal macrophages from WT and TRPC1−/− KPn-infected mice loaded with Fura-2AM and Tg added in Ca2+-free medium to measure the internal Ca2+ release (first peak) before addition of external Ca2+ as indicated to measure Ca2+ entry/influx through the plasma membrane (second peak). Analog plot of the fluorescence ratio (340/380 nm) from an average of 40–50 cells is shown. The bar graph (A2) indicates average ratio ± SEM of the Ca2+ release (first peak) and store-operated Ca2+ entry (SOCE) (second peak). (A3) Representative Ca2+ currents at −80 mV from a 0 mV holding potential of peritoneal macrophages from WT and TRPC1−/−KPn-infected mice by whole-cell patch-clamp analysis with 1 μM Tg in the pipette solution. (A4) I-V curves showing the TRPC1 channel-associated signature Isoc in peritoneal macrophages from KPn-infected WT, but not in TRPC1−/− mice. The signature current for ORAI1 channels (Icrac) was present in peritoneal macrophages from mock control WT and KPn-infected TRPC1−/− mice. Average current density recordings from 8 to 10 cells at −80 mV and corresponding statistics are shown in the bar graph (A5). (A6) From the KPn-infected WT and TRPC1−/− mice, peritoneal lavage, and liver and blood samples were collected. Liver was homogenized. Blood or liver homogenate or peritoneal lavage samples were serially diluted and plated on LB plates. Bacterial burden was enumerated after incubating the plates overnight at 37°C. Results shown here are mean ± SE from three experimental animals (n = 3). *p < 0.05**, p ≤ 0.01, ***p ≤ 0.001 (Student's t test). (B) M1 inflammatory activation phenotype in circulating monocytes/macrophage in humans with SIRS correlated with TRPC1 expression. Blood samples were collected from patients with SIRS every 24 hr for up to 10 days or until discharged from the ICU. PBMCs from patient and healthy donors (HC) were isolated and circulating monocytes/macrophages purified by positive magnetic selection. (B1) Western blot analysis using anti-TRPC1 and anti-ORAI1 was performed on cell lysates. GAPDH was used as loading control. The bar graph (B2) depicts averages ±SEM of pixel intensity of the TRPC1 and ORAI1 protein bands. Representative of n = 4 healthy donors and patients with SIRS. (B3) The expressions of M1-associated inflammatory mediators, CXCL9 and CXCL10, and M2 anti-inflammatory mediator, CCL22, were measured by qRT-PCR. *p < 0.05, **p ≤ 0.01 (Student's t test).
Figure 7
Figure 7
Peritoneal Macrophage from TRPC1−/− Mice Exhibit Reduced M1 Inflammatory Responses during Experimental Peritonitis due to Klebsiella pneumoniae Infection (A) Peritoneal macrophages from mock control (M) and KPn-infected WT and TRPC1−/− mice were harvested. Western blot analysis using anti-pSTAT1, pp65, p65, STAT1, and GAPDH was performed on equal amount of the respective cell lysates. GAPDH, p65, and STAT1 were used as loading control. The bar graph (A′) depicts averages ± SEM of pixel intensity of the pSTAT1 and pp65 protein bands. (B) Peritoneal macrophages from mock control (M) and KPn-infected WT and TRPC1−/− mice were harvested, and the relative mRNA expression of M1 inflammatory mediators, NOS2, TNF-ᾳ, IL-6, IL-23, CXCL9, and CXCL10, and M2 anti-inflammatory mediators, CCL22 and ARG-1, was measured by qRT-PCR. **p ≤ 0.01, ***p ≤ 0.001 (Student's t test).

References

    1. Abplanalp A.L., Morris I.R., Parida B.K., Teale J.M., Berton M.T. TLR-dependent control of Francisella tularensis infection and host inflammatory responses. PLoS One. 2009;4:e7920. - PMC - PubMed
    1. Braun A., Gessner J.E., Varga-Szabo D., Syed S.N., Konrad S., Stegner D., Vogtle T., Schmidt R.E., Nieswandt B. STIM1 is essential for Fcgamma receptor activation and autoimmune inflammation. Blood. 2009;113:1097–1104. - PubMed
    1. Byun M., Abhyankar A., Lelarge V., Plancoulaine S., Palanduz A., Telhan L., Boisson B., Picard C., Dewell S., Zhao C. Whole-exome sequencing-based discovery of STIM1 deficiency in a child with fatal classic Kaposi sarcoma. J. Exp. Med. 2010;207:2307–2312. - PMC - PubMed
    1. Cahalan M.D., Chandy K.G. The functional network of ion channels in T lymphocytes. Immunol. Rev. 2009;231:59–87. - PMC - PubMed
    1. Chauhan A., Sun Y., Pani B., Quenumzangbe F., Sharma J., Singh B.B., Mishra B.B. Helminth induced suppression of macrophage activation is correlated with inhibition of calcium channel activity. PloS One. 2014;9:e101023. - PMC - PubMed

LinkOut - more resources