. 2019 Oct;10(5):475-484.
doi: 10.1007/s12975-018-0667-2. Epub 2018 Oct 6.

Velocity Curvature Index: a Novel Diagnostic Biomarker for Large Vessel Occlusion

Affiliations

Velocity Curvature Index: a Novel Diagnostic Biomarker for Large Vessel Occlusion

Samuel G Thorpe et al. Transl Stroke Res. 2019 Oct.

Abstract

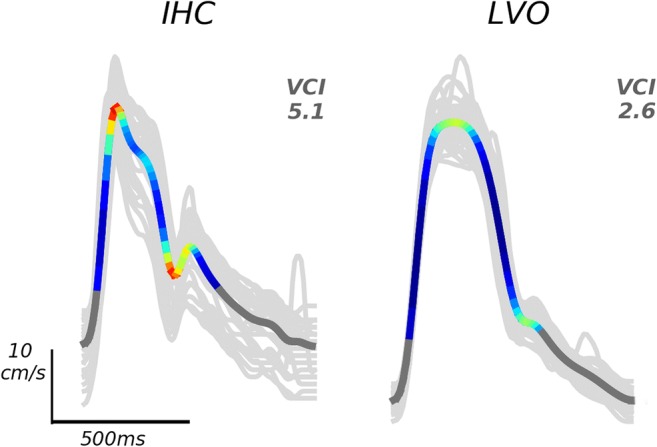
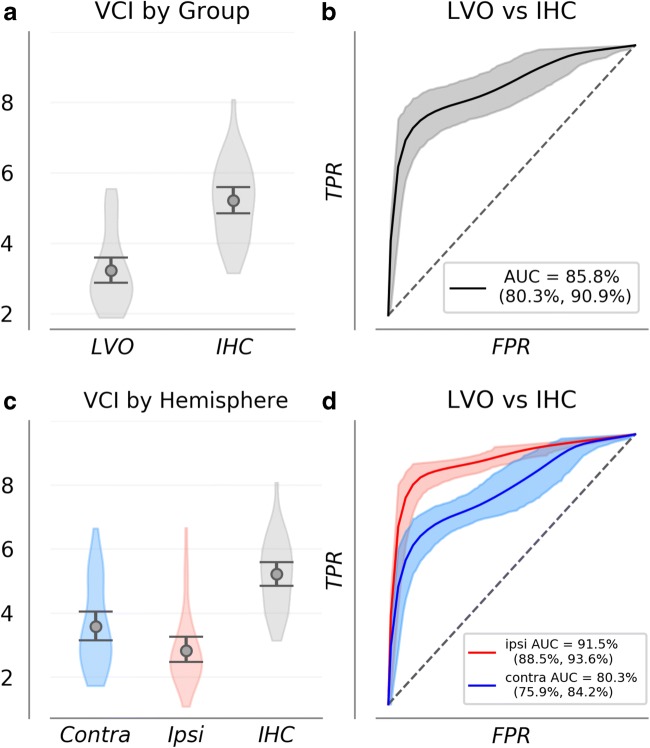
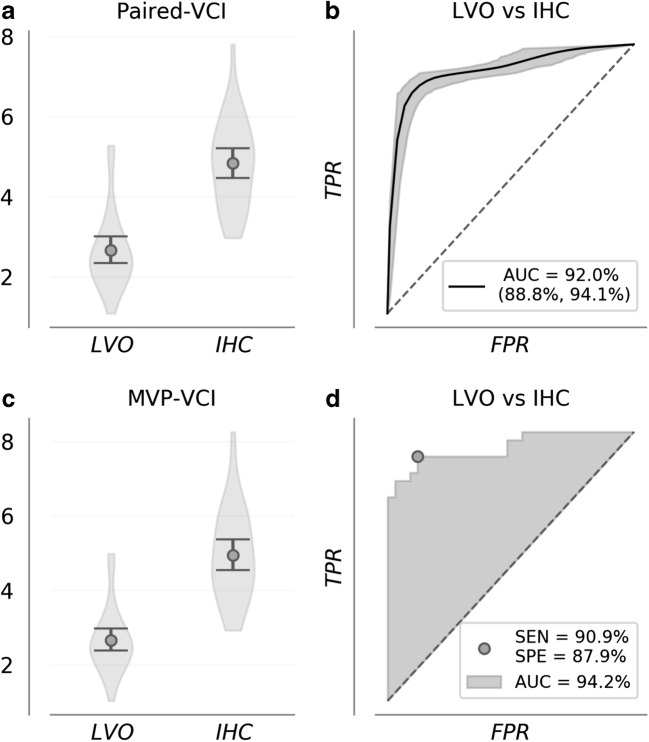
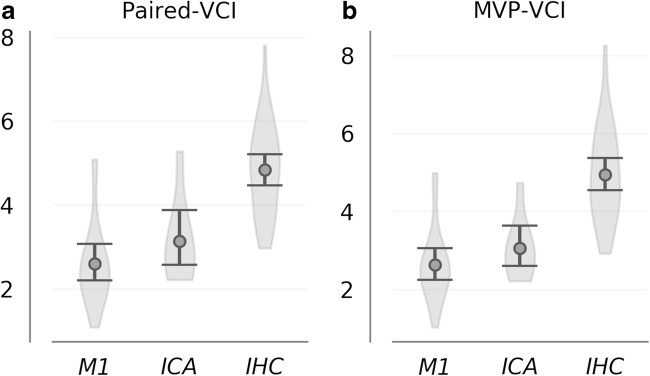
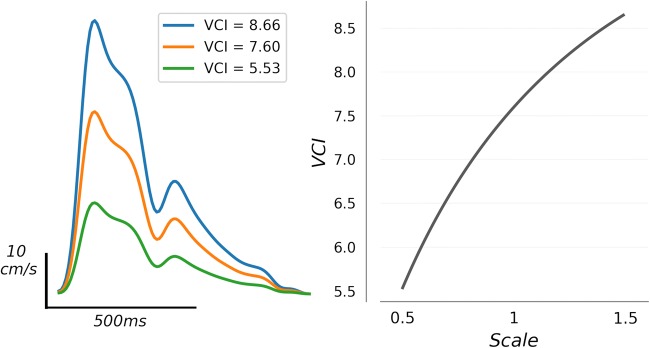
Despite being a conveniently portable technology for stroke assessment, Transcranial Doppler ultrasound (TCD) remains widely underutilized due to complex training requirements necessary to reliably obtain and interpret cerebral blood flow velocity (CBFV) waveforms. The validation of objective TCD metrics for large vessel occlusion (LVO) represents a first critical step toward enabling use by less formally trained personnel. In this work, we assess the diagnostic utility, relative to current standard CT angiography (CTA), of a novel TCD-derived biomarker for detecting LVO. Patients admitted to the hospital with stroke symptoms underwent TCD screening and were grouped into LVO and control groups based on the presence of CTA confirmed occlusion. Velocity curvature index (VCI) was computed from CBFV waveforms recorded at multiple depths from the middle cerebral arteries (MCA) of both cerebral hemispheres. VCI was assessed for 66 patients, 33 of which had occlusions of the MCA or internal carotid artery. Our results show that VCI was more informative when measured from the cerebral hemisphere ipsilateral to the site of occlusion relative to contralateral. Moreover, given any pair of bilateral recordings, VCI separated LVO patients from controls with average area under receiver operating characteristic curve of 92%, which improved to greater than 94% when pairs were selected by maximal velocity. We conclude that VCI is an analytically valid candidate biomarker for LVO diagnosis, possessing comparable accuracy, and several important advantages, relative to current TCD diagnostic methodologies.

Keywords: Diagnostic imaging; Ischemic stroke; Large vessel occlusion; Transcranial Doppler; Ultrasound.


Conflict of interest statement

Samuel G. Thorpe, Corey M. Thibeault, Seth J. Wilk, Michael O’Brien, Nicolas Canac, Mina Ranjbaran, and Robert B. Hamilton are employed by and hold stock options in Neural Analytics, Inc. Thomas Devlin is a paid consultant and stockholder of Neural Analytics, Inc. Christian Devlin declares that he has no conflicts to disclose.

Figures

Fig. 1
Fig. 1
Example average beat waveforms from IHC (left), and LVO (right) groups are depicted with local curvature indicated by color. Areas of high curvature are shown in hot colors (red/yellow), whereas low curvature is indicated by cool colors (blue/green). Dark gray areas indicate time points not included in the beat “canopy,” where velocity is less than one quarter of its total diastolic-systolic range. Light gray traces depict individual beats over which each average was taken
Fig. 2
Fig. 2
VCI distributions are shown for each group (a, c) along with bootstrapped ROC curves depicting group separability and empirical uncertainty (b, d). a shows VCI averaged over all recordings for each subject, combined across hemispheres. In c, the LVO group is separated by hemisphere relative to occlusion. Together, these curves demonstrate that VCI measurements from both hemispheres provide information concerning the presence of LVO. However, ipsilateral measurements are significantly more information rich. Light gray (b), and light blue/red (d) regions depict 95% confidence intervals on the true positive rate as a function of false positives
Fig. 3
Fig. 3
Paired-VCI distributions are shown for each group (a) along with bootstrapped ROC curves depicting group separability and uncertainty (b). a shows paired-VCI averaged over all bilateral recording pairs for each subject. Paired comparison increases signal efficacy by enforcing evaluation of the ipsilateral hemisphere, regardless of whether occlusion location is known. c, d show analogous distributions and ROC curves wherein pairs for each subject are chosen by maximal velocity across depths for each hemisphere, with sensitivity and specificity indicated at maximal Youden’s J-statistic threshold. In 3D, AUC for the ROC curve comparing MVP-VCI of the LVO to controls outperforms the upper tail of the corresponding 95% confidence intervals shown in b, demonstrating improvement of the max velocity criterion relative to random pairs
Fig. 4
Fig. 4
Paired-VCI (a) and MVP-VCI (b) curvature distributions are shown for subgroups corresponding to occlusion location; M1 (N = 20) vs ICA (N = 8) occlusions. While observed differences between M1 and ICA subgroups did not reach significance, those observed between each subgroup and corresponding IHC controls were highly significant; both for paired-VCI as well as MVP-VCI
Fig. 5
Fig. 5
An example waveform (orange line, left column) is shown along with scaled versions of the same waveform indicated in green (scale factor 0.5), and blue (scale factor 1.5). The relation is depicted graphically in the right column, where VCI is computed for intermediate scales. The relation determines that when occlusion acts to dampen the waveform, this effect will be reflected in the VCI biomarker

Similar articles

Cited by

References

    1. Benjamin EJ, Blaha MJ, Chiuve SE, et al. Heart disease and stroke statistics-2017 update: a report from the American Heart Association. Circulation. 2017;135(10):e146–e603. doi: 10.1161/CIR.0000000000000485. - DOI - PMC - PubMed
    1. National Institute of Neurological Disorders and Stroke rt-PA Stroke Study Group Tissue plasminogen activator for acute ischemic stroke. N Engl J Med. 1995;333(24):1581–88. doi: 10.1056/NEJM199512143332401. - DOI - PubMed
    1. Saqqur M, Uchino K, Demchuk AM, Molina CA, Garami Z, Calleja S, Akhtar N, Orouk FO, Salam A, Shuaib A, Alexandrov AV, for CLOTBUST Investigators Site of arterial occlusion identified by transcranial Doppler predicts the response to intravenous thrombolysis for stroke. Stroke. 2007;38(3):948–954. doi: 10.1161/01.STR.0000257304.21967.ba. - DOI - PubMed
    1. Saver JL, Goyal M, van der Lugt A, Menon BK, Majoie CBLM, Dippel DW, Campbell BC, Nogueira RG, Demchuk AM, Tomasello A, Cardona P, Devlin TG, Frei DF, du Mesnil de Rochemont R, Berkhemer OA, Jovin TG, Siddiqui AH, van Zwam WH, Davis SM, Castaño C, Sapkota BL, Fransen PS, Molina C, van Oostenbrugge RJ, Chamorro Á, Lingsma H, Silver FL, Donnan GA, Shuaib A, Brown S, Stouch B, Mitchell PJ, Davalos A, Roos YBWEM, Hill MD, for the HERMES Collaborators Time to treatment with endovascular thrombectomy and outcomes from ischemic stroke: a meta-analysis. JAMA. 2016;316(12):1279–1288. doi: 10.1001/jama.2016.13647. - DOI - PubMed
    1. Sheth SA, Jahan R, Gralla J, Pereira VM, Nogueira RG, Levy EI, Zaidat OO, Saver JL, for the SWIFT-STAR Trialists Time to endovascular reperfusion and degree of disability in acute stroke. Ann Neurol. 2015;78(4):584–593. doi: 10.1002/ana.24474. - DOI - PMC - PubMed

Publication types