Comment
. 2018 Dec;21(6):538-545.
doi: 10.1017/thg.2018.55. Epub 2018 Oct 8.

A Further Comment on 'Large-Scale Cognitive GWAS Meta-Analysis Reveals Tissue-Specific Neural Expression and Potential Nootropic Drug Targets' by Lam et al

Affiliations
Comment

A Further Comment on 'Large-Scale Cognitive GWAS Meta-Analysis Reveals Tissue-Specific Neural Expression and Potential Nootropic Drug Targets' by Lam et al

W D Hill. Twin Res Hum Genet. 2018 Dec.

Abstract

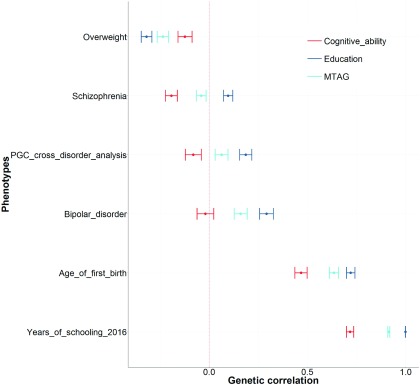
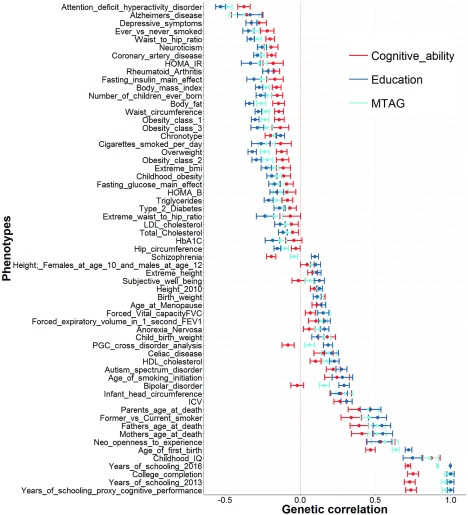
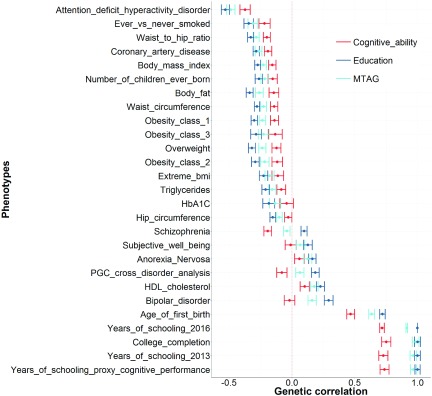
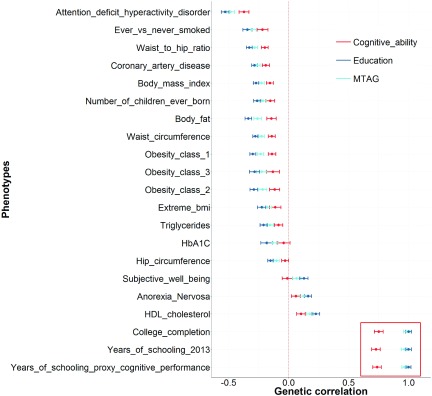
Lam et al. (2018) respond to a commentary of their paper entitled 'Large-Scale Cognitive GWAS Meta-Analysis Reveals Tissue-Specific Neural Expression and Potential Nootropic Drug Targets' Lam et al. (2017). While Lam et al. (2018) have now provided the recommended quality control metrics for their paper, problems remain. Specifically, Lam et al. (2018) do not dispute that the results of their multi-trait analysis of genome-wide association study (MTAG) analysis has produced a phenotype with a genetic correlation of one with three measures of education, but do claim the associations found are specific to the trait of cognitive ability. In this brief paper, it is empirically demonstrated that the phenotype derived by Lam et al. (2017) is more genetically similar to education than cognitive ability. In addition, it is shown that of the genome-wide significant loci identified by Lam et al. (2017) are loci that are associated with education rather than with cognitive ability.

Keywords: GWAS; calcium channel; cerebellum; gene expression; general cognitive ability; neurodevelopment; nootropics; potassium channel; synapse.


Figures

FIGURE 1
FIGURE 1
An empirical comparison between the genetic correlations produced using the three cognitive phenotypes from Lam et al. (2017). First, genetic correlations were selected when there was at least one nominally significant genetic correlation with any one of the three cognitive phenotypes used in Lam et al. Second, we show that for those traits, there were only six instances where the MTAG phenotype was significantly different from the education phenotype. However, in each of these six instances, the MTAG phenotype was also significantly different from the cognitive ability phenotype. Each point represents a genetic correlation between one of the three cognitive phenotypes (red = cognitive ability, dark blue = education, and light blue = the MTAG phenotype described as trait specific to cognitive ability by Lam et al. (2017)) and the traits presented on the y-axis. The dotted red line indicates a genetic correlation of zero. Error bars represent ±1 standard error as derived using LDSC regression.
FIGURE 2
FIGURE 2
Genetic correlations from Lam et al. (2017) where at least one of the cognitive traits showed a nominally significant genetic correlation with the traits presented on the y-axis. Each point represents a genetic correlation between one of the three cognitive phenotypes (red = cognitive ability, dark blue = education, and light blue = the MTAG phenotype described as trait specific to cognitive ability by Lam et al. (2017)) and the traits presented on the y-axis. The dotted red line indicates a genetic correlation of zero. Error bars represent ±1 standard error as derived using LDSC regression.
FIGURE 3
FIGURE 3
A subset of the traits showed in Figure 2. This shows the 27 traits that are significantly different between education and cognitive ability. Note that in every instance the point estimate of the genetic correlation for the MTAG phenotype is closer to the point estimate of education than it is to cognitive ability. Each point represents a genetic correlation between one of the three cognitive phenotypes (red = cognitive ability, dark blue = education, and light blue = the MTAG phenotype described as trait specific to cognitive ability by Lam et al. (2017)) and the traits presented on the y-axis. The dotted red line indicates a genetic correlation of zero. Error bars represent ±1 standard error as derived using LDSC regression.
FIGURE 4
FIGURE 4
A subset of the traits showed in Figure 3. This shows the 21 traits that show no significant difference between education and the MTAG phenotype. Note that in every instance where a significant difference was found between MTAG phenotype and education, a significant difference was also found between the MTAG phenotype and cognitive ability as shown in Figure 1. Each point represents a genetic correlation between one of the three cognitive phenotypes (red = cognitive ability, dark blue = education, and light blue = the MTAG phenotype described as trait specific to cognitive ability by Lam et al. (2017)) and the traits presented on the y-axis. The dotted red line indicates a genetic correlation of zero. Error bars represent ±1 standard error as derived using LDSC regression. The red box highlights the genetic correlations with three measures of education and shows that the MTAG phenotype has a genetic correlation of 1 with each of them.

Comment on

  • Large-Scale Cognitive GWAS Meta-Analysis Reveals Tissue-Specific Neural Expression and Potential Nootropic Drug Targets.
    Lam M, Trampush JW, Yu J, Knowles E, Davies G, Liewald DC, Starr JM, Djurovic S, Melle I, Sundet K, Christoforou A, Reinvang I, DeRosse P, Lundervold AJ, Steen VM, Espeseth T, Räikkönen K, Widen E, Palotie A, Eriksson JG, Giegling I, Konte B, Roussos P, Giakoumaki S, Burdick KE, Payton A, Ollier W, Chiba-Falek O, Attix DK, Need AC, Cirulli ET, Voineskos AN, Stefanis NC, Avramopoulos D, Hatzimanolis A, Arking DE, Smyrnis N, Bilder RM, Freimer NA, Cannon TD, London E, Poldrack RA, Sabb FW, Congdon E, Conley ED, Scult MA, Dickinson D, Straub RE, Donohoe G, Morris D, Corvin A, Gill M, Hariri AR, Weinberger DR, Pendleton N, Bitsios P, Rujescu D, Lahti J, Le Hellard S, Keller MC, Andreassen OA, Deary IJ, Glahn DC, Malhotra AK, Lencz T. Lam M, et al. Cell Rep. 2017 Nov 28;21(9):2597-2613. doi: 10.1016/j.celrep.2017.11.028. Cell Rep. 2017. PMID: 29186694 Free PMC article.
  • Comment on 'Large-Scale Cognitive GWAS Meta-Analysis Reveals Tissue-Specific Neural Expression and Potential Nootropic Drug Targets' by Lam et al.
    Hill WD. Hill WD. Twin Res Hum Genet. 2018 Apr;21(2):84-88. doi: 10.1017/thg.2018.12. Epub 2018 Mar 19. Twin Res Hum Genet. 2018. PMID: 29551100
  • Multi-Trait Analysis of GWAS and Biological Insights Into Cognition: A Response to Hill (2018).
    Lam M, Trampush JW, Yu J, Knowles E, Djurovic S, Melle I, Sundet K, Christoforou A, Reinvang I, DeRosse P, Lundervold AJ, Steen VM, Espeseth T, Räikkönen K, Widen E, Palotie A, Eriksson JG, Giegling I, Konte B, Roussos P, Giakoumaki S, Burdick KE, Payton A, Ollier W, Chiba-Falek O, Attix DK, Need AC, Cirulli ET, Voineskos AN, Stefanis NC, Avramopoulos D, Hatzimanolis A, Arking DE, Smyrnis N, Bilder RM, Freimer NA, Cannon TD, London E, Poldrack RA, Sabb FW, Congdon E, Conley ED, Scult MA, Dickinson D, Straub RE, Donohoe G, Morris D, Corvin A, Gill M, Hariri AR, Weinberger DR, Pendleton N, Bitsios P, Rujescu D, Lahti J, Hellard SL, Keller MC, Andreassen OA, Glahn DC, Malhotra AK, Lencz T. Lam M, et al. Twin Res Hum Genet. 2018 Oct;21(5):394-397. doi: 10.1017/thg.2018.46. Epub 2018 Jul 13. Twin Res Hum Genet. 2018. PMID: 30001766

References

    1. Bulik-Sullivan B., Finucane H. K., Anttila V., Gusev A., Day F. R., Loh P.-R., . . . Neale B. M. (2015). An atlas of genetic correlations across human diseases and traits. Nature Genetics, 47, 1236–1241. - PMC - PubMed
    1. Davies G., Lam M., Harris S. E., Trampush J. W., Luciano M., Hill W. D., . . . Deary I. J. (2018). Study of 300,486 individuals identifies 148 independent genetic loci influencing general cognitive function. Nature Communications, 9, 2098. - PMC - PubMed
    1. Hagenaars S. P, Harris S. E, Davies G., Hill W. D., Liewald D. C. M., Ritchie S. J., . . . Deary I. J. (2016). Shared genetic aetiology between cognitive functions and physical and mental health in UK Biobank (N=112 151) and 24 GWAS consortia. Molecular Psychiatry, 21, 1624–1632. - PMC - PubMed
    1. Hill W. D. (2018). Comment on ‘Large-Scale cognitive GWAS meta-analysis reveals tissue-specific neural expression and potential nootropic drug targets’ by Lam et al. Twin Research and Human Genetics, 21, 84–88. - PubMed
    1. Hill W. D., Davies G., The CHARGE Cognitive Working Group, Liewald D. C., McIntosh A. M., & Deary I. J. (2015). Age-dependent pleiotropy between general cognitive function and major psychiatric disorders. Biological Psychiatry, 80, 266–273. - PMC - PubMed

Publication types

Substances