. 2019 Jan 8;29(1):64-77.e6.
doi: 10.1016/j.cmet.2018.09.008. Epub 2018 Oct 4.

Preserving Insulin Secretion in Diabetes by Inhibiting VDAC1 Overexpression and Surface Translocation in β Cells

Affiliations

Preserving Insulin Secretion in Diabetes by Inhibiting VDAC1 Overexpression and Surface Translocation in β Cells

Enming Zhang et al. Cell Metab. .

Abstract

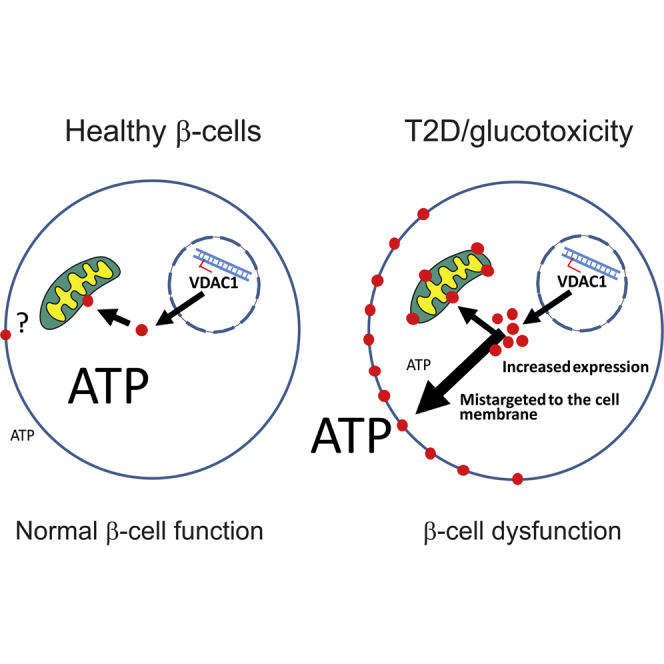
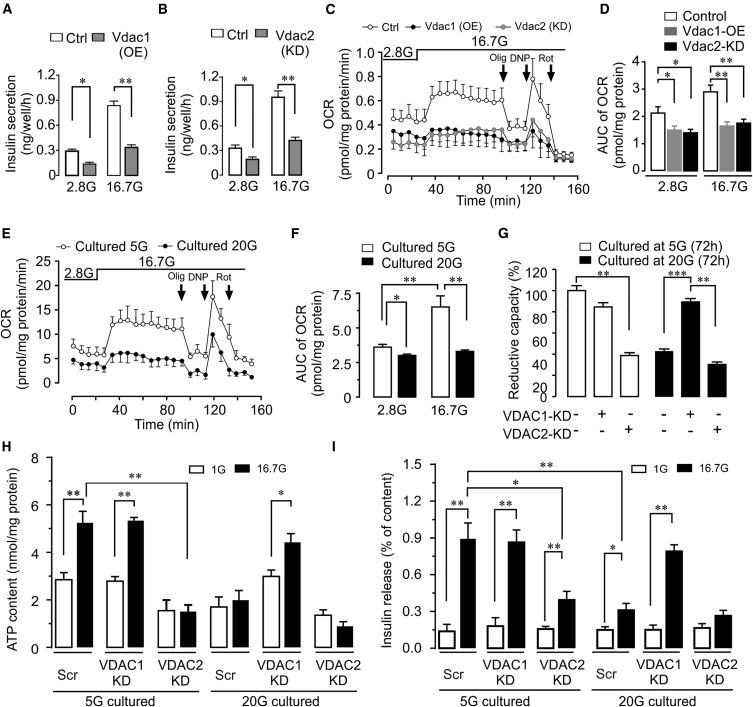
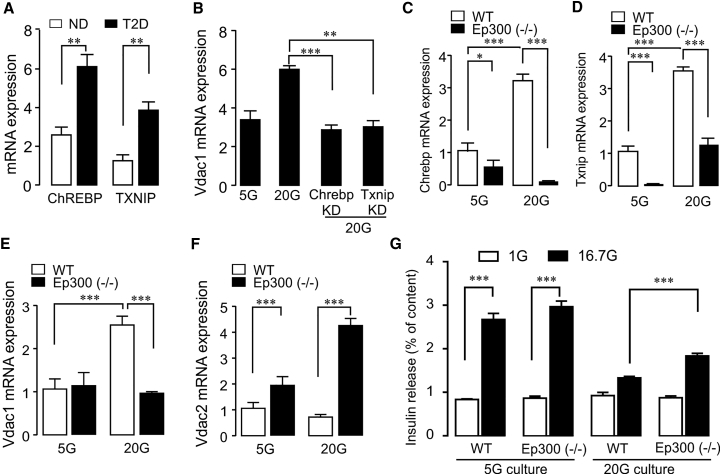
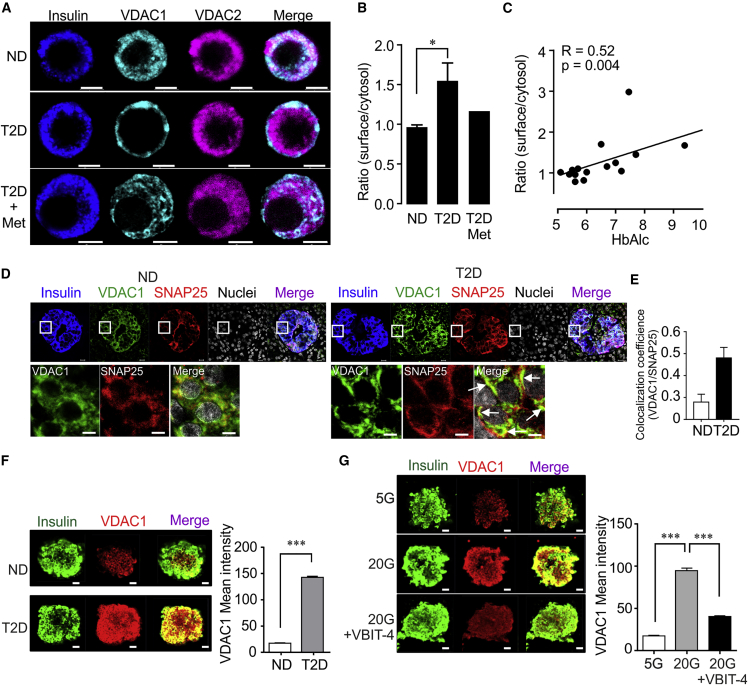
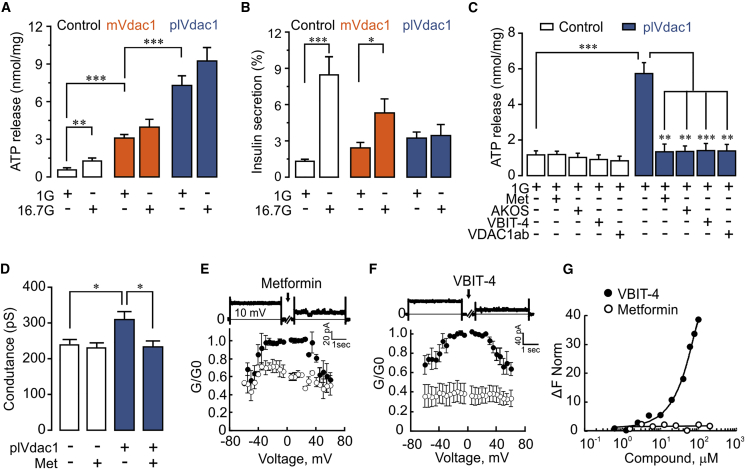
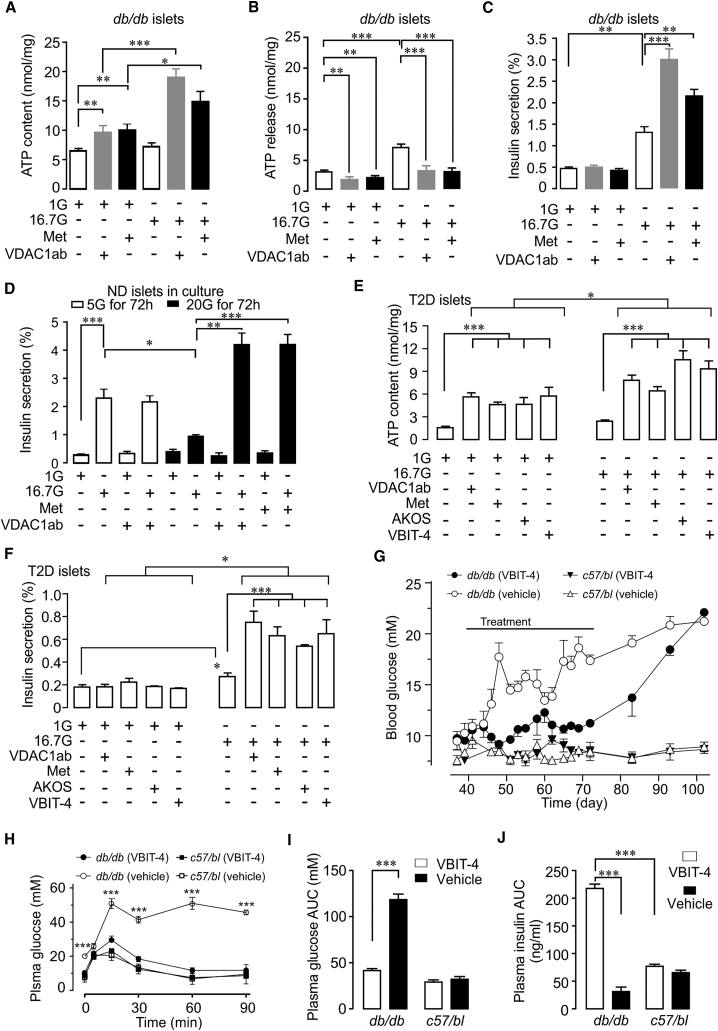
Type 2 diabetes (T2D) develops after years of prediabetes during which high glucose (glucotoxicity) impairs insulin secretion. We report that the ATP-conducting mitochondrial outer membrane voltage-dependent anion channel-1 (VDAC1) is upregulated in islets from T2D and non-diabetic organ donors under glucotoxic conditions. This is caused by a glucotoxicity-induced transcriptional program, triggered during years of prediabetes with suboptimal blood glucose control. Metformin counteracts VDAC1 induction. VDAC1 overexpression causes its mistargeting to the plasma membrane of the insulin-secreting β cells with loss of the crucial metabolic coupling factor ATP. VDAC1 antibodies and inhibitors prevent ATP loss. Through direct inhibition of VDAC1 conductance, metformin, like specific VDAC1 inhibitors and antibodies, restores the impaired generation of ATP and glucose-stimulated insulin secretion in T2D islets. Treatment of db/db mice with VDAC1 inhibitor prevents hyperglycemia, and maintains normal glucose tolerance and physiological regulation of insulin secretion. Thus, β cell function is preserved by targeting the novel diabetes executer protein VDAC1.

Keywords: ATP; Ep300(−/−)cells; VDAC; db/db mice; human islets; isolated VDAC1 channel conductance; metformin; mitochondrial metabolism; oxygen consumption rate; type 2 diabetes.


Figures

None
Graphical abstract
Figure 1
Figure 1
Expression of VDAC1 and VDAC2 in Human Pancreatic Islets (A) VDAC1 and VDAC2 mRNA levels in islets from non-diabetic (ND) and T2D donors. Mean ± SEM of 19 ND and 18 T2D. (B) Positive correlation between islet VDAC1 mRNA and donor HbA1c in ND (HbA1c < 6.0%) (n = 15; R2 = 0.83, p < 0.005); insert, correlation for ND + T2D, n = 30 including the four metformin-treated (red dots), R2 = 0.27; p < 0.05. (C) VDAC1 expression in islets from ND (n = 15), all T2D (n = 15), and four of these T2D with documented metformin therapy. (D) Negative correlation between islet VDAC2 mRNA and donor HbA1c in ND (n = 14; R2 = 0.28; p < 0.05). Correlation for ND + T2D: n = 30 including the four metformin-treated (red dots), R2 = 0.39; p < 0.05 (insert). (E) VDAC2 expression in islets from ND (n = 14), all T2D (n = 15), and four of these T2D with documented metformin therapy. (F and G) Glucotoxic condition (20 mM culture, 24 and 72 hr) mimics the T2D profile of VDAC1 expression in human islets. Metformin (20 μM) prevents the VDAC1 induction at 72 hr (F) and VDAC2 suppression (G) (n = 3–5 donors).
Figure 2
Figure 2
Impact of VDAC1 on β Cell Function (A and B) Glucose-stimulated insulin secretion (GSIS) in INS-1 cells after overexpression of Vdac1 (OE) (A) or knockdown (KD) of Vdac2 (B) (n = 5). (C) Oxygen consumption rate (OCR) in INS-1 cells after overexpression of Vdac1 or KD of Vdac2. Subsequent additions were as follows: oligomycin ([Olig], an inhibitor of ATP synthase) (0.4 μM), dinitrophenol ([DNP], an uncoupler) (0.4 μM), and rotenone ([Rot], an inhibitor of complex (I) (0.1 μM). (D) Area under the curve (AUC) for the experiments in (C) (n = 5). (E and F) OCR of INS-1 cells cultured at 5 or 20 mM glucose (72 hr) (n = 5). (G) VDAC1 silencing protects human islet cells from glucotoxicity-induced decrease in cellular reductive capacity (formazone production), while VDAC2 KD is harmful. Islets from five donors (used in separate experiments) were cultured at either 5 or 20 mM glucose for 72 hr. (H) Effect of VDAC1 or VDAC2 KD on ATP content of islets cultured at 5 or 20 mM glucose (72 hr) and incubated at 1 or 16.7 mM glucose for 1 hr (n = 3 donors). (I) Insulin secretion for the same islets as in (H).
Figure 3
Figure 3
Transcriptional Program Causing VDAC1 Overexpression after Glucotoxicity (A) ChREBP and TXNIP mRNA is increased in T2D islets (n = 4–5 donors). (B) Vdac1 overexpression is blunted after silencing of either Chrebp or Txnip in 20 mM glucose-cultured INS-1 cells (n = 5). (C) Glucose-evoked ChREBP induction is prevented in histone acetyltransferase p300 knockout INS-1 (Ep300−/−) cells. (D) Txnip expression is suppressed in INS-1 (Ep300−/−) cells after 5 mM glucose culture. Txnip induction is blunted at 20 mM glucose. (E) VDAC1 is not induced by glucotoxicity in INS-1 (Ep300−/−) cells. (F) VDAC2 is upregulated in INS-1 (Ep300−/−) cells at 5 mM and further increased after culture at 20 mM glucose (n = 3–4). (G) INS-1 (Ep300−/−) cells are partially protected from blunting of GSIS after culture at 20 mM glucose (n = 3–4). Independent experiments given as n.
Figure 4
Figure 4
VDAC1 Localization in β Cells from ND and T2D Islet Donors (A) Representative immunofluorescence images of VDAC1 and VDAC2 in human islet β cells from non-diabetic (ND) and T2D donors, one of whom had received metformin therapy. Note VDAC1 expressed prominently on the β cell surface in T2D islets. (B) β cell surface expression of VDAC1 given as ratio of surface/cytosolic VDAC1 immunofluorescence intensity in β cells of ND or T2D (12–15 cells/donor were acquired for the analysis, 8 donors each in the ND and T2D group) and the one with metformin therapy (12 cells). (C) Correlation between VDAC1 β cell surface expression and HbA1c values in 15 islet donors (ND and T2D). (D) Confocal image of VDAC1 co-localization with SNAP-25 by double immunostaining in insulin-positive cells in pancreatic sections from ND and T2D donors (3 donors with 27 islets in each group). Scale bar indicates 5 μm. Arrows show co-localization of VDAC1 and SNAP-25 also magnified in the squares. Mean SNAP-25 intensity/islet was 10.2 ± 2.4 for ND and 10.5 ± 3.9 for T2D, respectively. (E) Calculation of coefficients (VDAC1/SNAP-25) was performed using a confocal image analyzer (ZEN2012). (F) Representative immunofluorescence images of VDAC1 expression in isolated islets from two ND and one T2D donor. Mean ± SEM of 12–20 islets from each condition were analyzed. (G) Representative immunofluorescence images of VDAC1 expression and its co-staining with insulin-positive cells in islets from two ND donors cultured at 5 or 20 mM glucose ± VBIT-4 (20 μM) for 72 hr. Scale bar indicates 10 μm.
Figure 5
Figure 5
VDAC1 Cell Surface Expression Alters INS-1 Cell ATP Handling, Insulin Secretion, and Membrane Conductance (A) ATP release after 1 hr incubation at 1 or 16.7 mM glucose from INS-1 cells transfected with either mitochondrial Vdac1 (mtVdac1) or plasma membrane-targeted Vdac1 (plVdac1) and control (empty plasmid). Mean ± SEM (n = 4). (B) GSIS measured in the same experiments as in (A). (C) Effect of VDAC1 antibody (VDAC1-ab, 10 nM), metformin, or the VDAC1 inhibitors AKOS022075291 and VBIT-4 (20 μM each) on ATP release after 1 hr exposure at 1 mM glucose of INS-1 cells transfected with control plasmid or plVdac1. Mean ± SEM from at least three independent experiments. (D) Membrane conductance (whole-cell patch clamp) in control and plVdac1-transfected INS-1 cells in the presence or absence of metformin (20 μM) within 1 hr. Mean ± SEM of 15 cells in each group are shown. (E) Metformin (30 μM) reduces conductance of VDAC1 reconstituted in planar lipid bilayers. Average steady-state conductance measured at the indicated voltage, before (•) and 10–30 min after metformin addition (○). Mean ± SEM of three independent measurements. A representative trace at 10 mV is shown at the top. (F) Same as in (E) using VBIT-4 (20 μM). (G) Interaction of VBIT-4 (•) or metformin (○) with soluble VDAC1 (162 nM), using microscale thermophoresis. Results are presented as percent of the bound fraction calculated as given in method.
Figure 6
Figure 6
Overexpression of desCys(127/232)VDAC1 (Des-CysVDAC1) Is Less Harmful for INS-1 Cell Function than mtVDAC1 (A and B) Vdac1 mRNA expression (A) and Vdac2 mRNA expression (B) in cells transfected with mtVdac1 or Des-CysVdac1. Results are mean ± SEM of four independent experiments with 1–4 replicates in each. (C) Representative image of plasma membrane-near localization of mtVdac1 or Des-CysVdac1 in INS-1 cells assessed by total internal reflection fluorescence microscopy. Scale bar indicates 5 μm. (D) Surface density of mtVdac1 and Des-CysVdac1 in INS-1 cells; Mean ± SEM of 30 cells each from three independent experiments. (E) Cytosolic ATP/ADP ratio measured in single INS-1 cells (Ex/Em 488/520, 37°C) by confocal microscopy after co-transfection with PercevalHR and either mtVdac1 or Des-CysVdac1. (F) Glucose-induced increases in cytosolic ATP/ADP ratio are largely preserved in des-Vdac1 and abolished in mtVdac1 overexpressing INS-1 cells. AUC for glucose stimulation of five to ten analyzed cells from six different experiments, for AUC of the values after oligomycin addition (see Figure S6). (G–I) ATP content (G), ATP release (H), and insulin release (I) from INS-1 cells transfected with empty plasmid (Ctr), Des-CysVDAC1, or mtVDAC1 plasmids and incubated at 1 mM (1G) or 16.7 mM glucose (16.7G) for 1 hr (n = 5).
Figure 7
Figure 7
Inhibition of Cell Surface Mistargeted VDAC1 Restores GSIS in Prediabetic db/db Mice and in Human T2D Islets (A–C) One-hour exposure to VDAC1 antibody (10 nM) or metformin (20 μM) restores impaired glucose-stimulated ATP generation in islets of diabetic db/db mice in parallel with suppression of ATP release (B) and augments GSIS (C). Mean ± SEM (n = 4). (D) Insulin secretion in human ND islets cultured at 5 or 20 mM glucose (72 hr) in the presence and absence of VDAC1 antibody or metformin, followed by 1 hr incubation at 1G or 16.7G. (E) Acute addition of VDAC1 inhibitors (1 hr) improves glucose-stimulated ATP generation in islets from T2D donors. (F) Improved GSIS in the T2D islets shown in (E). Mean ± SEM (3–6 donors). (G) The VDAC1 inhibitor VBIT-4 prevents hyperglycemia in prediabetic db/db mice injected at 6 weeks (25 mg/kg daily intraperitoneally [i.p.]) compared with vehicle-treated db/db mice (n = 12). C57/bl6 mice receiving either VBIT-4 (n = 5) or vehicle (n = 6) are also depicted. Six db/db mice from each group were followed for another 3–4 weeks for reversibility of the treatment. All C57/bl6 mice were monitored throughout. Note the gradual increase and long duration before reaching full hyperglycemia after VBIT-4 cessation. (H) Plasma glucose concentrations during intraperitoneal glucose tolerance test (2 g/kg) in db/db or C57/bl6 mice after VBIT-4 treatment as in (G). Mean ± SEM of 12 mice (12 db/db and 5–6 C57/bl6 in each group). (I) AUC for plasma glucose. (J) AUC for plasma insulin (for plasma insulin values, see Figure S7J).

Comment in

References

    1. Akanda N., Tofighi R., Brask J., Tamm C., Elinder F., Ceccatelli S. Voltage-dependent anion channels (VDAC) in the plasma membrane play a critical role in apoptosis in differentiated hippocampal neurons but not in neural stem cells. Cell Cycle. 2008;7:3225–3234. - PubMed
    1. Ahmed M., Muhammed S.J., Kessler B., Salehi A. Mitochondrial proteome analysis reveals altered expression of voltage dependent anion channels in pancreatic beta-cells exposed to high glucose. Islets. 2010;2:283–292. - PubMed
    1. Anello M., Lupi R., Spampinato D., Piro S., Masini M., Boggi U., Del Prato S., Rabuazzo A.M., Purrello F., Marchetti P. Functional and morphological alterations of mitochondria in pancreatic beta cells from type 2 diabetic patients. Diabetologia. 2005;48:282–289. - PubMed
    1. Aram L., Geula S., Arbel N., Shoshan-Barmatz V. VDAC1 cysteine residues: topology and function in channel activity and apoptosis. Biochem. J. 2010;427:445–454. - PubMed
    1. Aroda V.R., Knowler W.C., Crandall J.P., Perreault L., Edelstein S.L., Jeffries S.L., Molitch M.E., Pi-Sunyer X., Darwin C., Heckman-Stoddard B.M. Metformin for diabetes prevention: insights gained from the diabetes prevention program/diabetes prevention program outcomes study. Diabetologia. 2017;60:1601–1611. - PMC - PubMed

Publication types