. 2018 Oct 18;72(2):222-238.e11.
doi: 10.1016/j.molcel.2018.08.047. Epub 2018 Oct 4.

Genome-wide Identification of Structure-Forming Repeats as Principal Sites of Fork Collapse upon ATR Inhibition

Affiliations

Genome-wide Identification of Structure-Forming Repeats as Principal Sites of Fork Collapse upon ATR Inhibition

Nishita Shastri et al. Mol Cell. .

Abstract

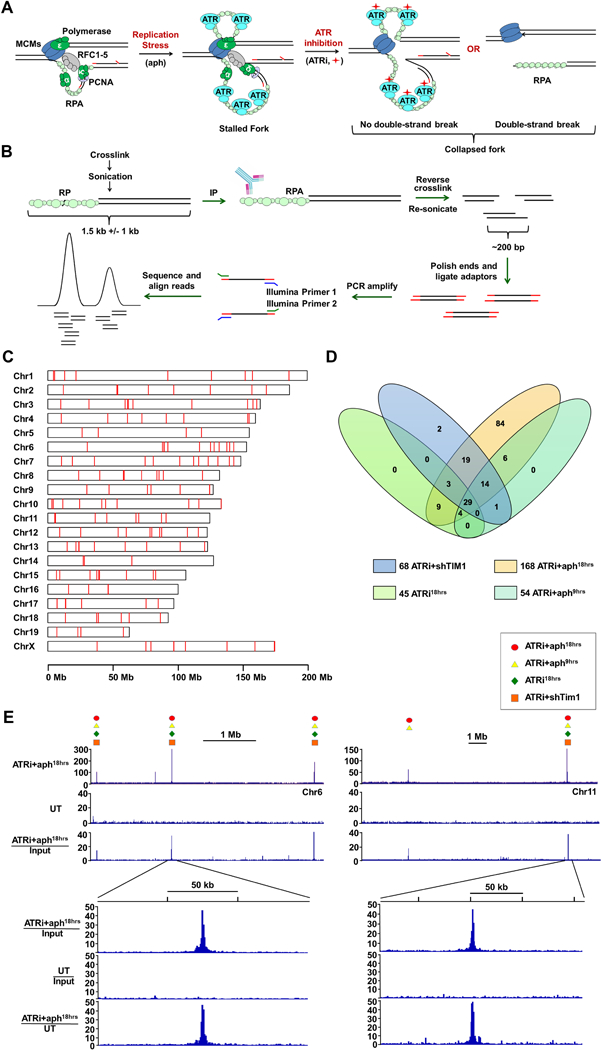
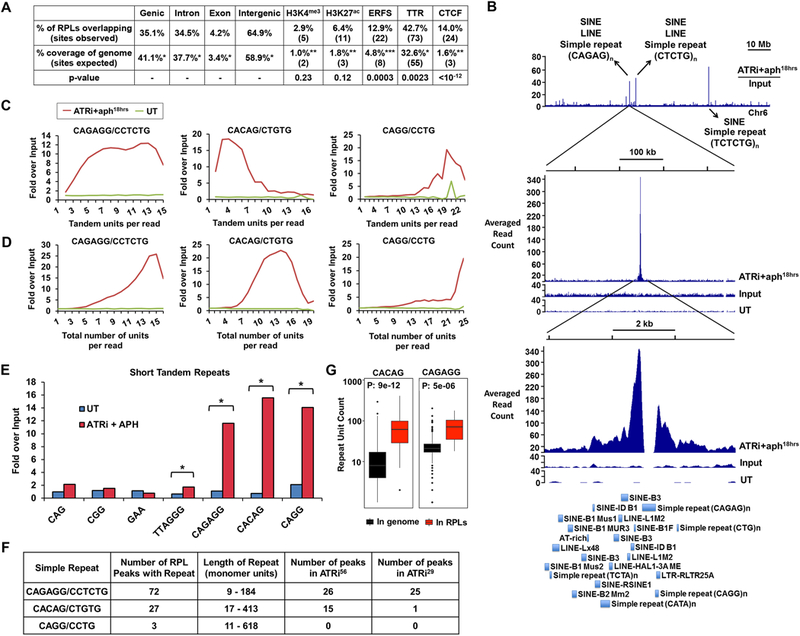
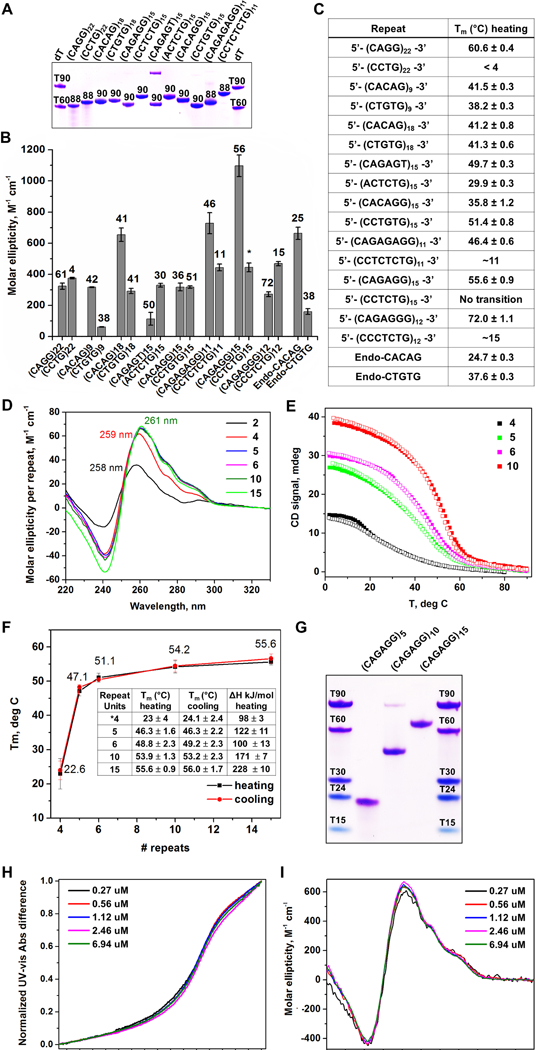
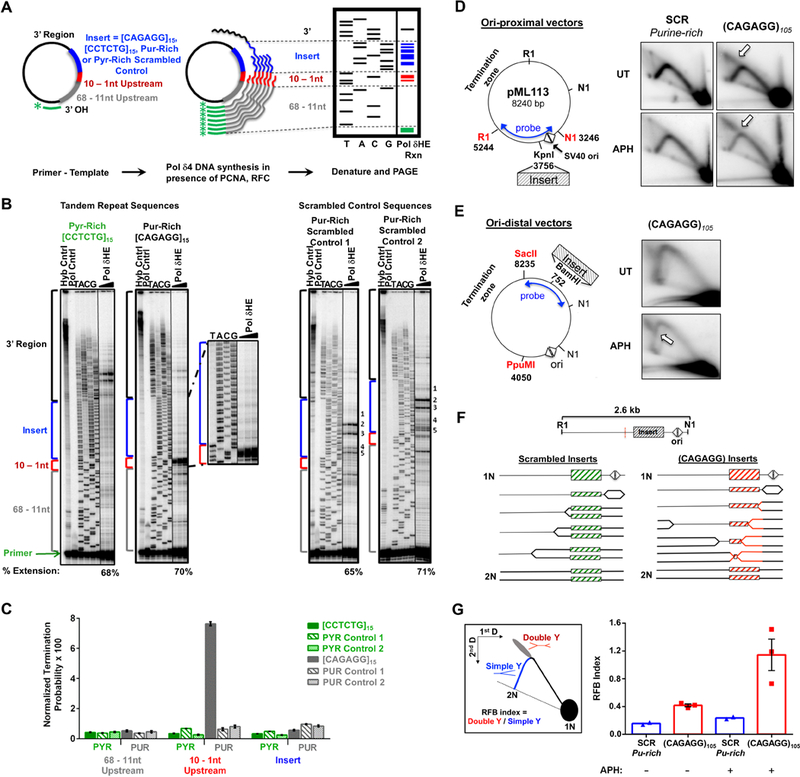
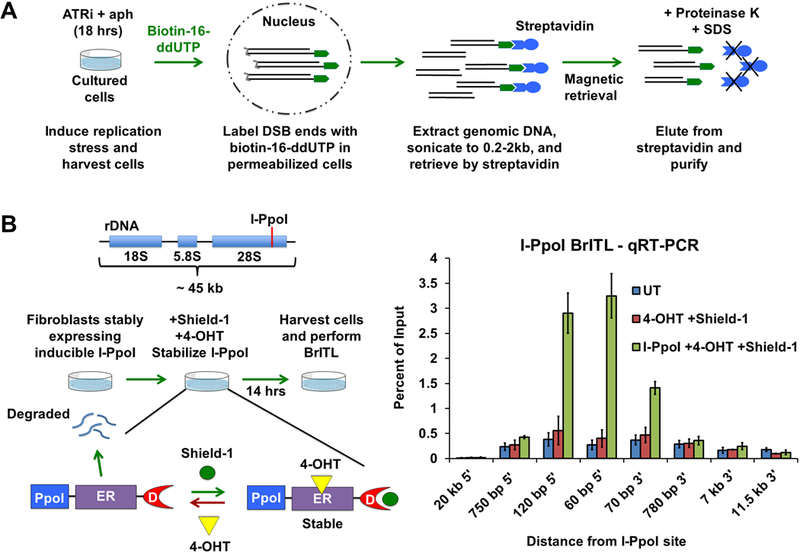
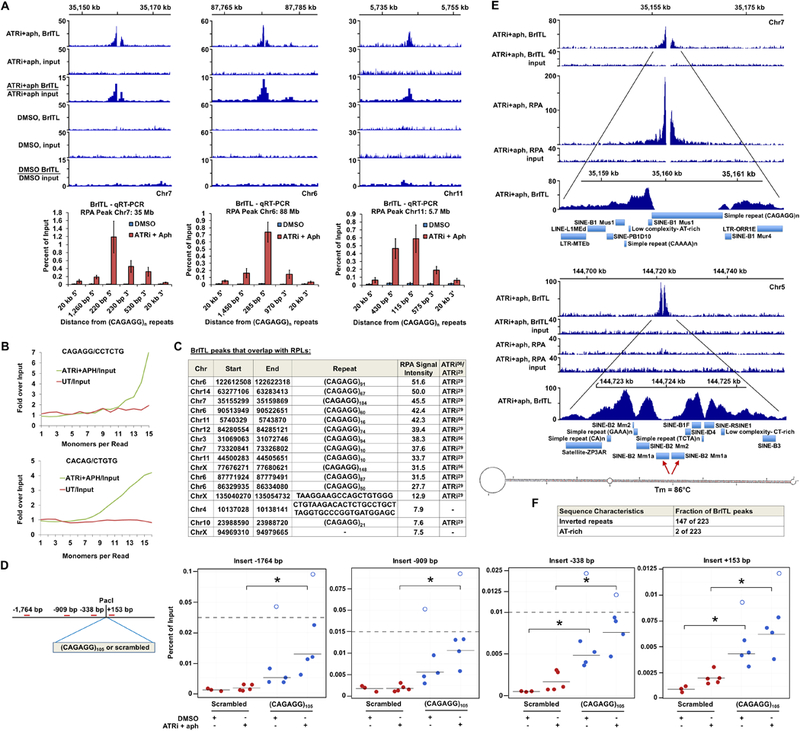
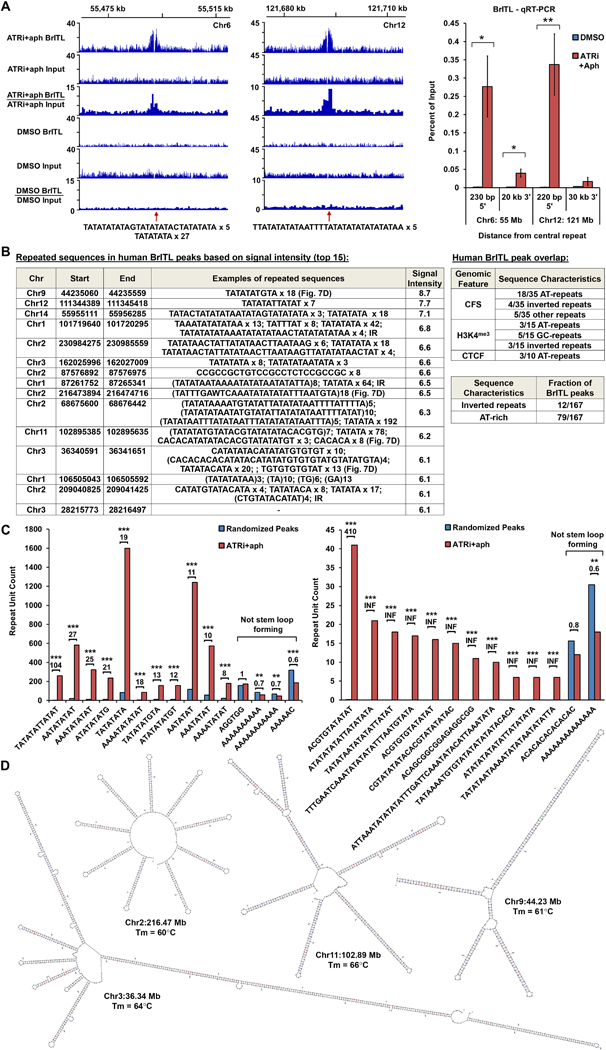
DNA polymerase stalling activates the ATR checkpoint kinase, which in turn suppresses fork collapse and breakage. Herein, we describe use of ATR inhibition (ATRi) as a means to identify genomic sites of problematic DNA replication in murine and human cells. Over 500 high-resolution ATR-dependent sites were ascertained using two distinct methods: replication protein A (RPA)-chromatin immunoprecipitation (ChIP) and breaks identified by TdT labeling (BrITL). The genomic feature most strongly associated with ATR dependence was repetitive DNA that exhibited high structure-forming potential. Repeats most reliant on ATR for stability included structure-forming microsatellites, inverted retroelement repeats, and quasi-palindromic AT-rich repeats. Notably, these distinct categories of repeats differed in the structures they formed and their ability to stimulate RPA accumulation and breakage, implying that the causes and character of replication fork collapse under ATR inhibition can vary in a DNA-structure-specific manner. Collectively, these studies identify key sources of endogenous replication stress that rely on ATR for stability.

Keywords: AT-rich; ATR; DNA damage; DNA double-strand breaks; RPA; hairpin; inverted repeats; microsatellite; replication fork collapse; short tandem repeats.


Figures

Figure 1.
Figure 1.
Genome-wide Identification of Fork Collapse Sites by RPA-ChIP Seq (A) RPA-ChIP Seq detection of replication fork collapse from ATR inhibition (ATRi, red diamond). (B) Schematic of RPA-ChIP Seq experimental approach. Cross-linked chromatin was sonicated into large fragments (1.5 kb average) prior to immunoprecipitation with RPA2 antibody. Retrieved DNA was sonicated into smaller fragments (200–300 bp) for NGS. (C) RPLs identified in the mouse genome (red marks). (D) Venn diagram depicting overlap of peaks identified from different conditions. (E) Representative peaks in RPA-ChIP Seq coverage and ratio tracks (ATRi+aph18hrs and DMSO-treated control, UT). Symbols above select peaks indicate identification under additional experimental conditions. See also Supplemental Table S1 and S2.
Figure 2.
Figure 2.
Short Tandem Repeats are Enriched in RPLs (A) Genomic features associated with RPLs. Percent and number of RPLs overlapping with noted features compared to expected overlap based on fraction of the genome comprised by these features is shown. Statistical significance (p value) was calculated by permutation test. (B) Example of repetitive DNA in RPL peaks. Top track: Representative ratio track of RPA-ChIP Seq reads over input reads from ATRi+aph18hrs-treated cells. Arrows detail examples of repetitive elements present. Middle and bottom track: Zoomed-in RPL peak. First track: RPA-ChIP of ATRi+aph18hrs; second track: input of ATRi+aph18hrs; third track: RPA-ChIP of DMSO-treated control (UT). Bottom: RepeatMasker annotations of repetitive elements within the peak region. (C, D) Quantification of tandem and total repeat units in RPA-ChIP Seq reads by REQer. X-axis depicts the (C) tandem repeat units and (D) total repeat units counted within the total RPA-ChIP Seq reads (ATRi+aph18hrs and DMSO control, UT) normalized by repeat occurrence in respective inputs. (E) Fold enrichment of tandem repeat occurrences in RPA-ChIP Seq NGS reads over input (average of 5 data points) in ATRi+aph18hrs and DMSO control (UT) is shown. *, p < 0.001, Student’s T-test. (F) Repeats most frequently observed as enriched in ATRi+aph18hrs RPA-ChIP Seq reads and their association with RPLs. (G) Lengths of CACAG and CAGAGG repeats in the mouse genome and in RPL peaks according to the reference genome. See also Figure S2 and S3.
Figure 3.
Figure 3.
RPL-Associated Repeats Form Unique Intrastrand Secondary Structures (A) Non-denaturing PAGE gel of oligonucleotide repeats. (B) CD molar ellipticity peak values as a proxy for DNA folding. Melting temperatures, shown above bars, were obtained using a non-linear fit assuming two-state system. (*) indicates melting transition is characterized by a non-sigmoidal melting curve. (C) List of simple repeat sequences analyzed and respective melting temperatures. (D) Repeat-normalized CD wavelength scans of (CAGAGG)n, with n = 2, 4, 5, 6, 10, and 15. (E) Representative CD melting and cooling curves for (CAGAGG)n, n = 4, 5, 6, and 10. (F) Graph of melting temperatures obtained by UV-vis with different CAGAGG monomer lengths. Tm values and change in enthalpy are summarized in the embedded table. (G) Non-denaturing PAGE gel of (CAGAGG)n, n = 5, 10, and 15. Overlay of (H) normalized UV-vis melting and (I) CD scans (4°C) of (CAGAGG)10 at varying oligonucleotide concentrations. For (B), the data are represented as mean +/− SEM. For (A-I), all samples were prepared in 10 mM lithium cacodylate pH 7.2, 100 mM KCl and 2 mM MgCl2 buffer. For (A) and (G), DNA bands were visualized with Stains All. See also Supplemental Fig. S4and Table S3.
Figure 4.
Figure 4.
CAGAGG Repeats Impede DNA synthesis (A) Schematic of in vitro Pol δHE primer-extension assay. (B) Representative images of Pol δHE reaction products. Pol δHE DNA synthesis products from ssDNA templates containing (CAGAGG)15, (CCTCTG)15, or scrambled control inserts (purine-rich or pyrimidine-rich) with increasing reaction times (3 – 15 minutes, triangle) were separated by denaturing PAGE alongside a dideoxynucleotide sequencing of the same template (TACG). Left: (CCTCTG)15 and (CAGAGG)15 insert-containing templates; Right: two distinct purine-rich scrambled control insert-containing templates. Control lanes are indicated (-Pol, No Polymerase; Hyb, Primer-template hybridization). Percent Extension, extended DNA over extended plus unextended primer-bound DNA. Also see Supplemental Figure S5A for pyrimidine-rich scrambled control. (C) Pol δHE termination probability. Termination probability, normalized by the number of nucleotides in each region, was quantified as the ratio of DNA molecules within a specific region over these plus all longer DNA molecules. (D) Effect of (CAGAGG)n repeats on plasmid DNA synthesis in cells. Left: (CAGAGG)105 or a scrambled sequence of the same nucleotide composition and length (SCR) was inserted proximal to the bidirectional SV40 origin (triangles) SV40 large T-antigen (TAg) (Follonier et al., 2013). Right: Representative 2D gels. Plasmid transfected cells were either untreated (UT) or treated with 0.6 μM aphidicolin (APH) for 24 hours. Isolated episomal DNA was digested with DpnI, EcoRI (RI) and Eco NI (NI) and replication intermediates were resolved by 2D neutral-neutral gel electrophoresis with Southern hybridization to the indicated probe. Arrows denote the point of divergence of the double-Y structure from the simple-Y arc. (E) Replication intermediates of plasmids containing origin-distal (CAGAGG)105. Left: Schematic of the ori-distal vectors(2.7 kB from the origin). Right: Representative 2D gels. Experiment was carried out as described in (A), except that the purified DNAs were digested with DpnI, PpuMI, and SacII and detected with the indicated probe. (F) Schematic of replication through ori-proximal vectors and the formation of double-Y structures. Dashed red line indicates the center of the RI-NI fragment, the expected apex of the simple-Y arc. (G) Left: Schematic of replication fork barrier (RFB) index quantitation. The RFB index is the number of double Y structures (red) divided by the number present in >1.5N simple-Y structures (blue). Right: Quantitation of the RFB index in CAGAGG)105 and SCR ori-proximal vectors from 2D gels (E). For (C), the data are represented as mean +/− SEM of three independent polymerase reactions for each template. ****, p < 0.0001. For (G), the data are represented as mean +/− SEM, with individual data points representing independent biological replicates. See also Figure S5.
Figure 5.
Figure 5.
Development of BrITL (A) Schematic of the BrITL procedure. Treated cells are permeabilized and incubated with terminal deoxynucleotidyl transferase (TdT) and biotin-16-ddUTP. Extracted genomic DNA is then sonicated to 0.2–2 kb and subjected to streptavidin retrieval for analysis by qRT-PCR or NGS. (B) Validation of DSB detection by BrITL. Left: Genomic DSBs at I-PpoI recognition sites (red line) were conditionally generated by expression of I-PpoI (PpoI) fused to a destabilized FKBP12 (D) and a tamoxifen-specific form of the estrogen receptor (ER), followed by fusion protein stabilization and nuclear localization by Shield-1 and 4-hydroxytamoxifen (4-OHT) treatment. Right: qRT-PCR analysis of BrITL retrievals. Quantification of retrieved biotin-labeled fragments, normalized as a percent of input, is shown at specified distances from the rDNA I-PpoI site relative to the start of transcription. Conditions include UT (DMSO treatment), 4-OHT + Shield-1, and I-PpoI fusion expression + 4-OHT + Shield-1. For (B), the data are represented as mean +/− SEM.
Figure 6.
Figure 6.
BrITL Sites Overlap with RPLs and Inverted Repeats (A) Top: Coverage and ratio tracks of BrITL retrievals and inputs of ATRi+aph18hrs and DMSO- treated cells at RPLs. Bottom: BrITL-qRT-PCR detection of RPL sites adjacent to peak-centric (CAGAGG/CCTCTG)n repeats. (B) Quantification of total repeat units in BrITL retrieval reads by REQer. X-axis depicts the total repeat units counted within the total BrITL reads (ATRi+aph18hrs and DMSO control, UT) normalized by repeat occurrence in respective inputs. (C) Table listing RPLs that overlap with BrITL peaks and the repeats associated with these sites. (D) Left: Schematic of (CAGAGG)105-containing vector for stable genomic integration and primer sets used in BrITL qRT-PCR analysis. Right: qRT-PCR analysis of genomic BrITL retrievals (ATRi+aph18hrs and DMSO control, UT) at indicated distances from the (CAGAGG)105 and 630 bp scrambled control insertion sites. Data points represent independent biological replicates; red: scrambled 630 bp insert; blue: (CAGAGG)105 insert. Hollow dots represent outliers. *, p < 0.05, Student’s T-test. (E) Representative coverage tracks of RPA-ChIP and BrITL retrievals and inputs at RPA-positive and RPA-negative BrITL sites following ATRi+aph18hrs. RepeatMasker annotations of repetitive elements as well as a representative inverted retroelement repeat and its M-fold-predicted stem-loop structure are shown below. (F) Inverted repeat and AT-rich sequence frequency in ATRi+aph18hrs BrITL peaks. For (A), the data are represented as mean +/− SEM. See also Figures S6 and S7 and Supplemental Table S4 and S5.
Figure 7.
Figure 7.
ATRi-Driven Breakage in Human Cells is Associated with Structure-Forming Repeats. (A) Left: Coverage tracks of BrITL retrievals and inputs from ATRi+aph9hrs and DMSO-treated cells. Right: qRT-PCR analysis of BrITL retrievals at specified distances from central AT-rich repeats. *, p < 0.05; **, p < 0.002. (B) Left: Top 15 ATRi+aph9hrs BrITL peaks and associated repeats. Right: Repeat sequences observed in ATRi+aph9hrs BrITL peaks that overlap with specific genomic features. Bottom right: Fraction of ATRi+aph9hrs BrITL peaks associated with inverted repeats or AT-rich repeats. (C) Bar graphs quantifying repeat motifs identified by MISA and HOMER2 within ATRi+aph9hrs BrITL peaks and randomly generated pseudo-peaks of similar size. *, p < 0.002; **, p < 0.0001; ***, p < 0.000001. (D) M-fold-predicted structures and Tm of notable AT-rich repeats in BrITL peaks. For (A), the data are represented as mean +/− SEM. See also Supplemental Table S6 and S7.

Comment in

References

    1. Admire A, Shanks L, Danzl N, Wang M, Weier U, Stevens W, Hunt E, and Weinert T (2006). Cycles of chromosome instability are associated with a fragile site and are increased by defects in DNA replication and checkpoint controls in yeast. Genes & Development 20, 159–173. - PMC - PubMed
    1. Bacolla A, Tainer JA, Vasquez KM, and Cooper DN (2016). Translocation and deletion breakpoints in cancer genomes are associated with potential non-B DNA-forming sequences. Nucleic Acids Research 44, 5673–5688. - PMC - PubMed
    1. Beier S, Thiel T, Munch T, Scholz U, and Mascher M (2017). MISA-web: a web server for microsatellite prediction. Bioinformatics 33, 2583–2585. - PMC - PubMed
    1. Bolger AM, Lohse M, and Usadel B (2014). Trimmomatic: a flexible trimmer for Illumina sequence data. Bioinformatics 30, 2114–2120. - PMC - PubMed
    1. Brown EJ, and Baltimore D (2000). ATR disruption leads to chromosomal fragmentation and early embryonic lethality. Genes & Development 14, 397–402. - PMC - PubMed

Publication types

MeSH terms