. 2018 Nov 7;100(3):593-608.e3.
doi: 10.1016/j.neuron.2018.09.008. Epub 2018 Oct 4.

Oxytocin Transforms Firing Mode of CA2 Hippocampal Neurons

Affiliations

Oxytocin Transforms Firing Mode of CA2 Hippocampal Neurons

Natasha N Tirko et al. Neuron. .

Abstract

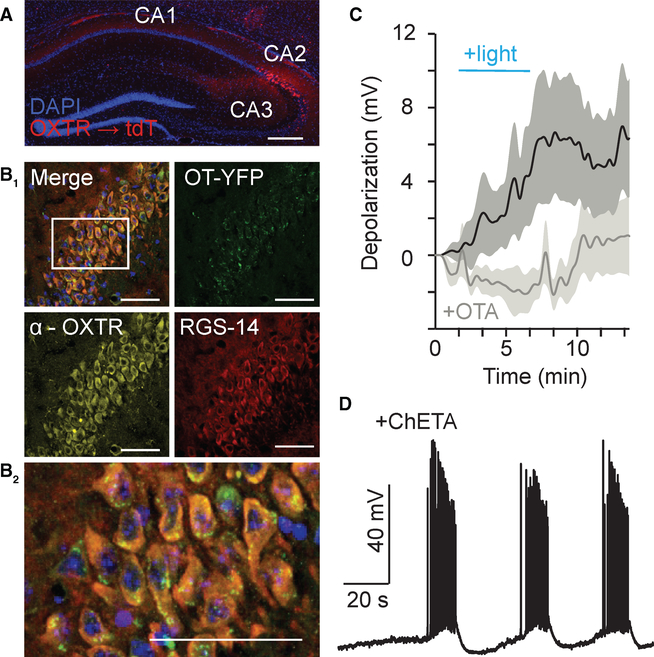
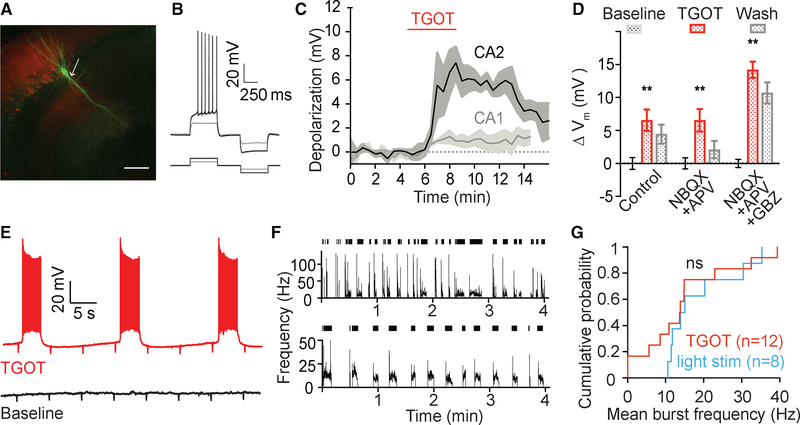
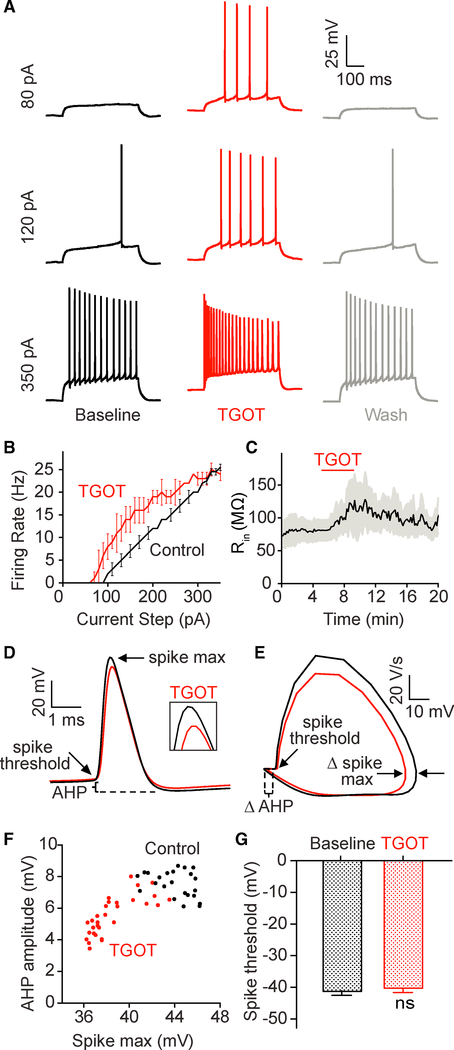
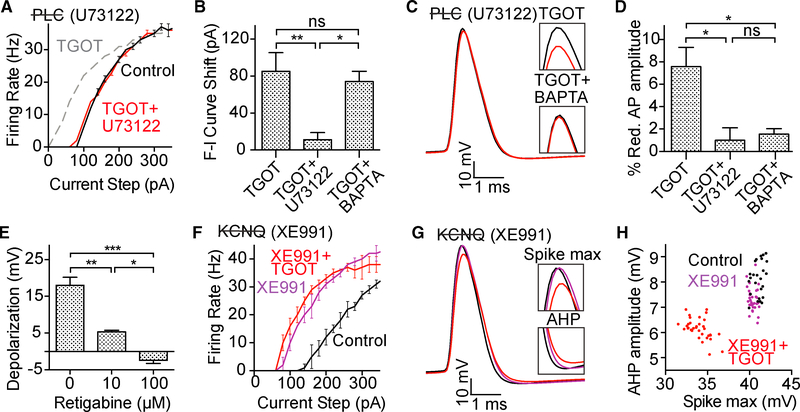
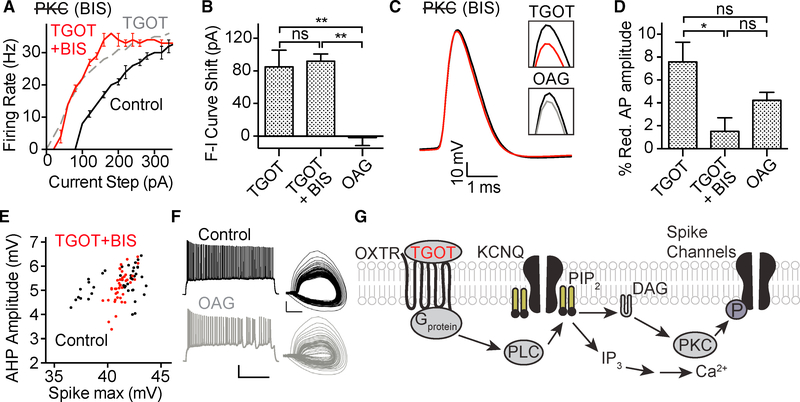
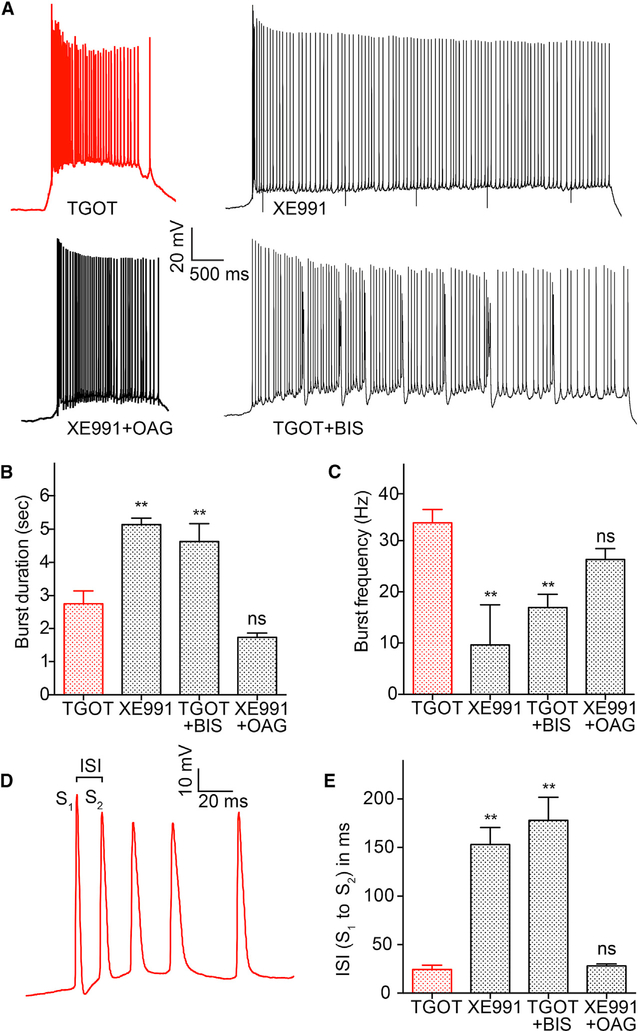
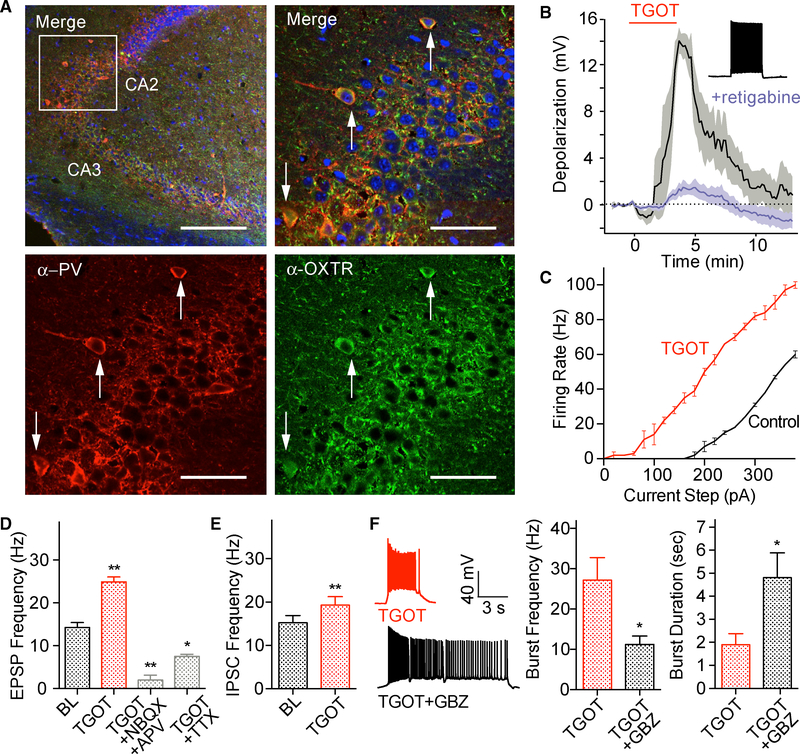
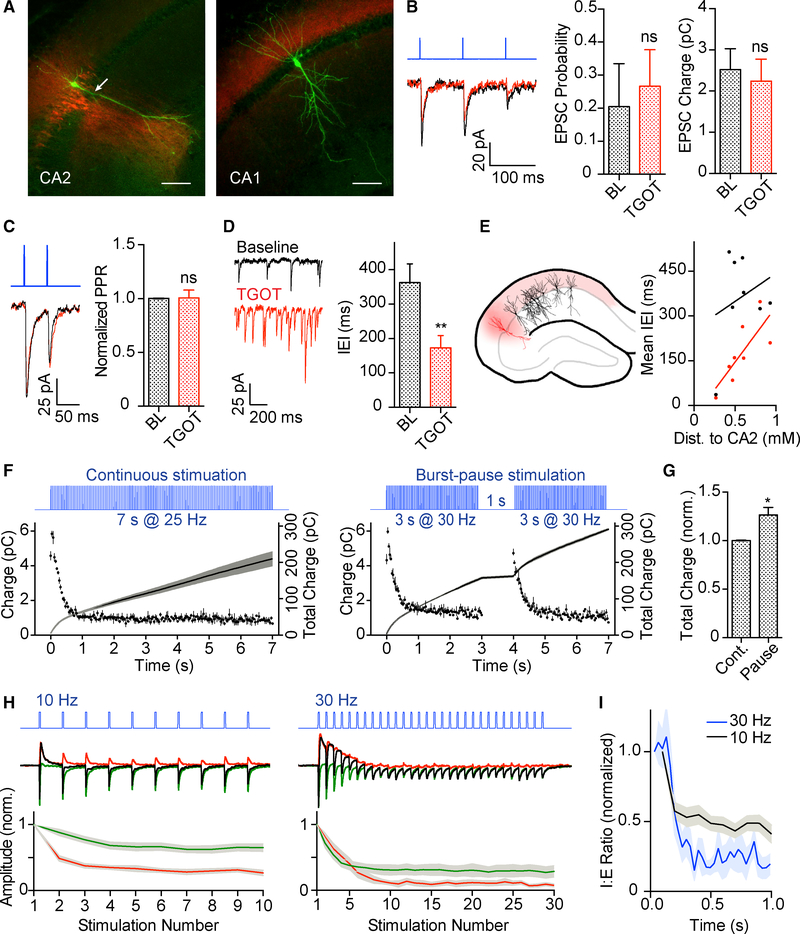
Oxytocin is an important neuromodulator in the mammalian brain that increases information salience and circuit plasticity, but its signaling mechanisms and circuit effect are not fully understood. Here we report robust oxytocinergic modulation of intrinsic properties and circuit operations in hippocampal area CA2, a region of emerging importance for hippocampal function and social behavior. Upon oxytocin receptor activation, CA2 pyramidal cells depolarize and fire bursts of action potentials, a consequence of phospholipase C signaling to modify two separate voltage-dependent ionic processes. A reduction of potassium current carried by KCNQ-based M channels depolarizes the cell; protein kinase C activity attenuates spike rate of rise and overshoot, dampening after-hyperpolarizations. These actions, in concert with activation of fast-spiking interneurons, promote repetitive firing and CA2 bursting; bursting then governs short-term plasticity of CA2 synaptic transmission onto CA1 and, thus, efficacy of information transfer in the hippocampal network.

Keywords: CA2; G-protein coupled receptor; M-current; burst firing; hippocampus; inhibitory interneuron; neuromodulation; oxytocin; pyramidal cell; short term plasticity.


Conflict of interest statement

DECLARATION OF INTERESTS

The authors declare no competing interests.

Figures

Figure 1.
Figure 1.. CA2 Pyramidal Cells Express the Oxytocin Receptor and Are Depolarized by Optogenetic Activation of Oxytocinergic Axon
(A) TdTomato expression (red) driven by the Oxtr promoter in hippocampal slices (DAPI-stained nuclei). Note strong labeling in the pyramidal layer of CA2 and the neighboring CA3. Scale bar, 200 μm. (B1) CA2 pyramidal cells, identified by RGS14 (red), co-expressed OXTR (yellow) with YFP+ oxytocinergic fibers (green) on somata. Scale bars, 50 μm. (B2) Magnification of the boxed section in B1. Scale bar, 50 μm. (C) Depolarization to blue light stimulation in CA2 pyramidal neurons of hippocampal slices expressing CheTA-YFP (black trace) was blocked by pre-incubation with 1 μM OTA (gray trace; unpaired Student’s t test, p > 0.15). Membrane depolarization was quantified as the average change in membrane potential 6–8 min after stimulus onset (membrane potential low pass-filtered to prevent spike contamination). SEM depolarization shown in gray with the mean overlaid. (D) Example burst firing in a CA2 pyramidal cell after 5 min of light stimulation (5 Hz) of ChETA+ oxytocinergic fibers.
Figure 2.
Figure 2.. Responses of CA2 Pyramidal Cells to Oxytocin Receptor Stimulation by TGOT
(A) Biocytin-filled CA2 pyramidal cell with an apical dendrite bifurcation near the soma (arrow). The pyramidal neuron displayed Amigo2-Cre driven expression of AAV Cre-dependent TdTomato (red). Scale bar, 100 μm. (B) CA2 pyramidal cells fired delayed action potentials to a depolarizing current step and showed minimal sag to a hyperpolarizing current step. (C) Passive current clamp recordings (zero applied current) in the presence of the excitatory blockers NBQX (10 μM) and AP5 (50 μM) revealed that TGOT (400 nM) depolarized CA2 pyramidal cells; CA1 pyramidal cells showed minimal direct depolarization. SEM depolarization shown in gray with the mean overlaid. (D) CA2 pyramidal cells depolarized to TGOT similarly without (left) or with excitatory blockers (center, NBQX and APV); depolarization was significantly greater with excitatory and inhibitory blockade (right). Data are baseline-subtracted by the pre-TGOT resting membrane potential. **p < 0.01. (E) Exemplar current clamp recording of spike bursts induced by TGOT application. (F) Spike rasters for two cells (vertical bars) and corresponding instantaneous frequency (black traces) during TGOT application (4 min). (G) Cumulative frequency distributions of evoked firing in CA2 cells driven by application of TGOT (red) or within 30 min of optogenetically driven release of endogenous oxytocin (black); the median frequencies are similar (~15 Hz). All error bars reflect the SEM.
Figure 3.
Figure 3.. TGOT Increases CA2 Pyramidal Cell Excitability and Alters Spike Shape
(A) Current steps of increasing amplitude applied during whole-cell recordings from CA2 pyramidal cells in the presence of TGOT (red). (B) Exemplar frequency-current (F-I) curve from a CA2 pyramidal cell showing a leftward shift in response to TGOT application. The neuron was initially current-clamped to −70 mV to prevent spontaneous spikes; the holding current held steady throughout the recording. Group data are shown in Figure 4B. (C) CA2 input resistance increase following TGOT application. SEM depolarization shown in gray with the mean overlaid. (D) Average spike waveform generated by a current injection in an exemplar cell during control (black) and TGOT application (red). TGOT decreases spike amplitude and after-hyperpolarization. The spike peak is highlighted in the inset (box size, 0.5 ms wide and 10 mV tall). (E) Phase plane plot of the average action potential waveform shown in (D). (F) Spike amplitude and after-hyperpolarization both decrease during TGOT application and are correlated. (G) Spike threshold is unchanged with TGOT. All error bars are the SEM.
Figure 4.
Figure 4.. OXTR Signaling via PLC and KCNQ Channel Function Are Necessary for Changes in CA2 Pyramidal Cell-Intrinsic Properties
(A) The presence of the PLC blocker U73122 prevented the TGOT-induced leftward shift in the F-I curve. Baseline (black), TGOT+U73122 (red), and TGOT alone (gray dashed) curves are compared. (B) The F-I curve shift was quantified by fitting second-order polynomial curves to interpolate the current inputs required to generate 10-Hz firing at baseline and in the presence of drug. The F-I curve shift was blocked by U73122 but not by BAPTA (20 mM) in the recording pipette. (C) Average spike waveform generated by current injection during control (black) and TGOT plus U73122 (red) conditions. U73122 blocked the reduction in spike amplitude caused by TGOT, as did BAPTA in the recording pipette. Spike peaks are highlighted in the inset (box size, 0.5 ms wide and 10 mV tall). (D) Summary of the percent reduction in action potential amplitude between baseline and drug conditions. (E) Retigabine prevented TGOT-induced depolarization in a dose-dependent manner; 100 μM Retigabine prevented CA2 pyramidal cell depolarization during TGOT application. (F) XE991 caused a leftward shift of the F-I curve that occluded TGOT’s effect on excitability. (G) Average spike waveform generated by current injection during control (black), XE991 alone (blue), and XE991 with TGOT (red) conditions in an example cell. Spike peak and after-hyperpolarization (AHP) are highlighted in the insets (0.5 ms wide, 10 mV tall). (H) XE991 was not sufficient to alter spike shape; XE991 alone (violet) did not decrease spike amplitude or after-hyperpolarization although subsequent application of TGOT (red) did. All error bars reflect the SEM. *p < 0.05, **p < 0.01, ***p < 0.001. See also Figure S3.
Figure 5.
Figure 5.. OTR Signaling via PKC Is Not Required for TGOT-Induced Changes in Excitability but Is Required for Changes in Spike Shape
(A) Application of TGOT in the presence of the PKC blocker BIS did not affect the shift in the F-I curve. Baseline (black), TGOT plus BIS (red), and TGOT alone (gray dashed) curves are shown for comparison in this example cell. (B) Quantification of the shift in the F-I curve; BIS application did not prohibit the TGOT-induced increase in excitability, and PKC activation alone (via OAG) failed to increase cell excitability. (C) Average spike waveforms show that blocking PKC activation with BIS prohibited changes in spike configuration. The insets highlight spike amplitude changes because TGOT alone (red) and OAG alone (gray). (D) Summary of percent reduction in spike amplitude between baseline and drug conditions. (E) Spike amplitude and after-hyperpolarization were not reduced by TGOT when PKC activity was blocked. (F) Responses to the 12th in a series of current injections (left) and corresponding phase plane plots (right) point to enhanced slow inactivation of spike channels during OAG application in the CA2 pyramidal cell. Scale bars, 20 mV (horizontal), 40 V/s (vertical). (G) Proposed mechanism underlying TGOT action on CA2 pyramidal cells. TGOT activates OXTRs; an intermediary G-protein activates PLC, which degrades PIP2 into inositol triphosphate (IP3) and DAG; depletion of PIP2 from the cell membrane results in closing of KCNQ channels, increasing the membrane resistance and allowing depolarization; DAG activates PKC; and PKC may phosphorylate spike channels (likely Na+ channels), reducing peak conductance and increased slow inactivation. All error bars reflect the SEM. *p < 0.05, **p < 0.01. See also Figure S4.
Figure 6.
Figure 6.. TGOT-Induced Bursting Is Shaped by Both KCNQ Conductance and PKC Action on Excitatory Current
(A) Exemplar bursts recorded from CA2 pyramidal cells In the presence of TGOT, the KCNQ channel blocker XE991, TGOT plus the PKC blocker BIS, and the KCNQ blocker plus the PKC activator OAG. (B) Average burst duration. (C) Average burst frequency. (D) Magnification of spikes early in a burst during TGOT application, indicating the initial interspike interval between the first (S1) and second (S2) spikes. (E) Mimicry of the brief ISI in TGOT was not obtained with XE991 or TGOT plus BIS but was achieved upon PKC activation with OAG. All error bars reflect the SEM. **p < 0.01.
Figure 7.
Figure 7.. CA2 Fast-Spiking Cells Are Also Activated by TGOT and Help Sculpt Pyramidal Cell Activity
(A) Parvalbumin-positive interneurons (red) were expressed at a high density in CA2 and generally expressed OXTR. Box, top left, the magnified area at the right and bottom. Scale bars, 250 μm (top left), 50 μm elsewhere. Analysis of OXTR immunoreactivity was performed when the cell body could clearly be distinguished (arrows). The proportion of PV+ neurons that were also OXTR+ was 55% for CA2 (n = 20), 85.7% for CA1 (n = 21), and, thus, 70.5% for both regions together (n = 44). (B) Whole-cell recordings from PV+ fast-spiking interneurons in the CA2 region, identified using a transgenic PV-Cre reporter line and by their response to a current injection (inset), depolarized in response to TGOT application (400 nM). Data were acquired without excitatory blockers. Depolarization was largely prevented by pre-incubation with 100 μM retigabine (blue). (C) TGOT increased excitability in fast-spiking interneurons, as shown by a leftward shift in the F-I curve of this exemplar cell. (D) TGOT application increased EPSP frequency in fast-spiking CA2 interneurons; this increase was blocked by NBQX and APV and reduced by TTX. (E) TGOT application increased IPSC frequency onto CA2 pyramidal cells. (F) Example of TGOT-driven bursts in CA2 pyramidal cells during control (red) and gabazine (black) conditions. Blocking inhibition with gabazine decreased the burst frequency (center) and increased TGOT-driven burst duration (right). All error bars reflect the SEM. *p < 0.05, **p < 0.01. See also Figure S6.
Figure 8.
Figure 8.. Properties of CA2 Output onto CA1 Pyramidal Cells and the Effects of TGOT
(A) Amigo2-cre mice expressed virally delivered mCherry-ChR2 in CA2 pyramidal cells (red). Shown are a ChR2-positive CA2 pyramidal cell (left) and a ChR2-negative CA1 pyramidal cell (right), each labeled with biocytin. Scale bars, 100 μm. (B) Voltage-clamp recordings from CA1 pyramidal cells reveal excitatory inputs. Shown are 10-Hz stimulation trains under control (black) and TGOT (red) conditions; OXTR activation did not increase the release probability or EPSC charge. (C) Blue light stimulation pulses spaced by a 50-ms interval revealed no change in paired-pulse ratio with TGOT. (D) TGOT application increased spontaneous EPSCs onto CA1 pyramidal cells, as shown in a sample trace (left) and as a decrease in inter-event interval. (E) Schematic indicating the location of biocytin-filled CA1 pyramidal cells (black) with respect to CA2 (red). The spontaneous EPSC frequency was correlated with the CA1 pyramidal cell’s distance from CA2 during TGOT application (but not under control conditions). (F) Recording from CA1 pyramidal cells under voltage clamp. CA2 axons were stimulated with blue light either continuously (25.7 Hz) or in a burst-pause pattern (3 s at 30 Hz) to deliver 180 stimulations over 7 s. The charge per stimulation (dots, left vertical axis) and cumulative charge (lines, right vertical axis) are shown (average ± SEM of 3 stimulations). (G) The average cumulative excitatory charge transferred during burst-pause stimulation was 125% of that during continuous stimulation. (H) Top: 1-s trains of 10- or 30-Hz blue light stimulation were delivered to CA2 axons during voltage-clamp recordings. Center: excitatory (green) and inhibitory (red) currents were derived from recorded current traces (black). Bottom: during stimulation trains at either frequency, inhibitory current amplitudes (red) showed greater depression than excitatory current amplitudes (data were normalized to the first stimulation amplitude). (I) 30-Hz stimulation resulted in a larger decrease in the I:E ratio than 10-Hz stimulation. All error bars reflect the SEM. *p < 0.05, **p < 0.01. See also Figure S7.

Similar articles

Cited by

References

    1. Alexander GM, Farris S, Pirone JR, Zheng C, Colgin LL, and Dudek SM (2016). Social and novel contexts modify hippocampal CA2 representations of space. Nat. Commun 7, 10300. - PMC - PubMed
    1. Bargmann CI, and Marder E (2013). From the connectome to brain function. Nat. Methods 10, 483–490. - PubMed
    1. Baumgartner T, Heinrichs M, Vonlanthen A, Fischbacher U, and Fehr E (2008). Oxytocin shapes the neural circuitry of trust and trust adaptation in humans. Neuron 58, 639–650. - PubMed
    1. Benes FM, Lim B, Matzilevich D, Subburaju S, and Walsh JP (2008). Circuitry-based gene expression profiles in GABA cells of the trisynaptic pathway in schizophrenics versus bipolars. Proc. Natl. Acad. Sci. USA 105, 20935–20940. - PMC - PubMed
    1. Bley KR, and Tsien RW (1990). Inhibition of Ca2+ and K+ channels in sympathetic neurons by neuropeptides and other ganglionic transmitters. Neuron 4, 379–391. - PubMed

Publication types