. 2018 Nov 7;100(3):636-650.e6.
doi: 10.1016/j.neuron.2018.09.009. Epub 2018 Oct 4.

Neural Coding of Leg Proprioception in Drosophila

Affiliations

Neural Coding of Leg Proprioception in Drosophila

Akira Mamiya et al. Neuron. .

Abstract

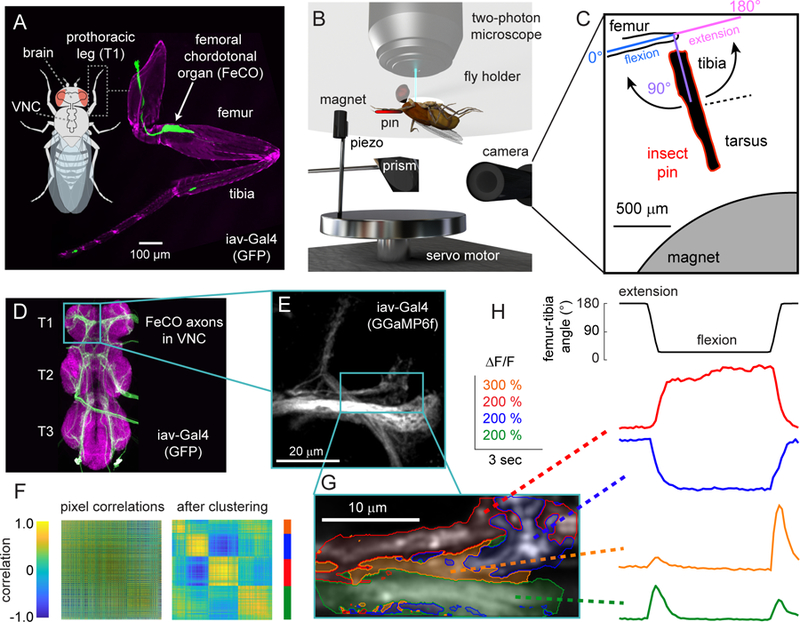
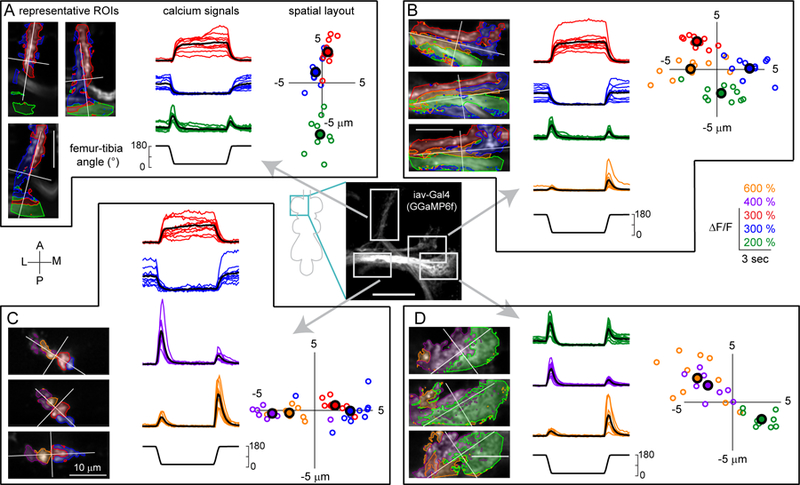
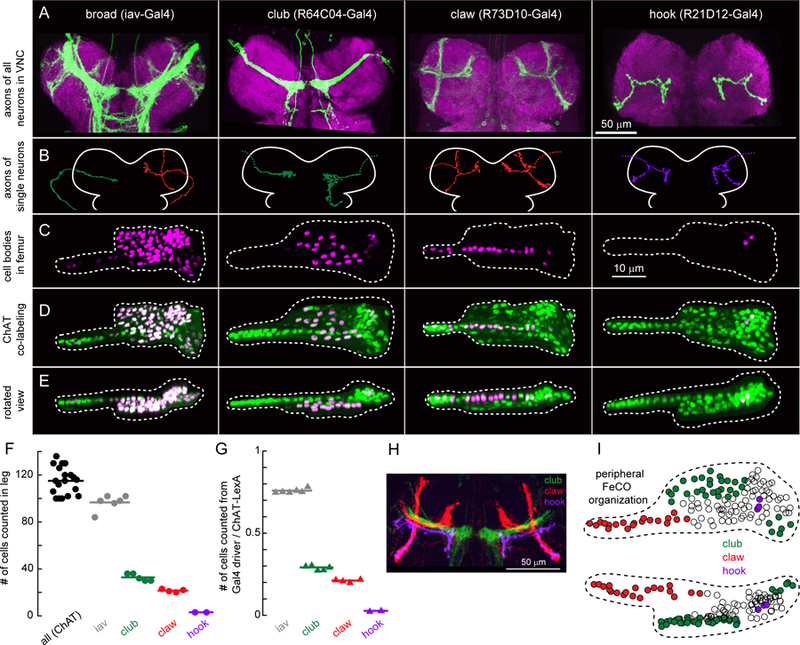
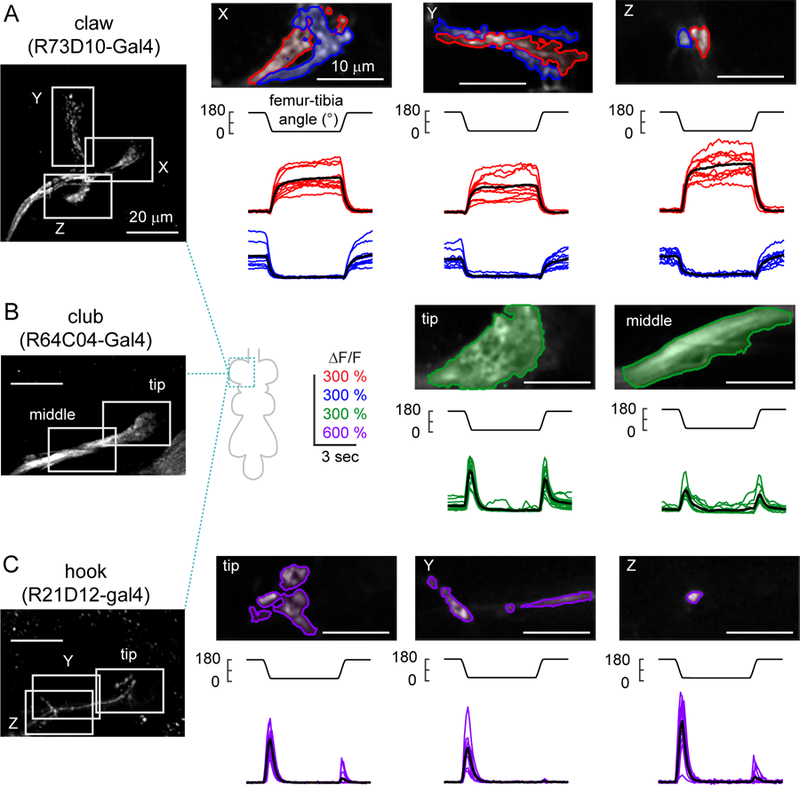
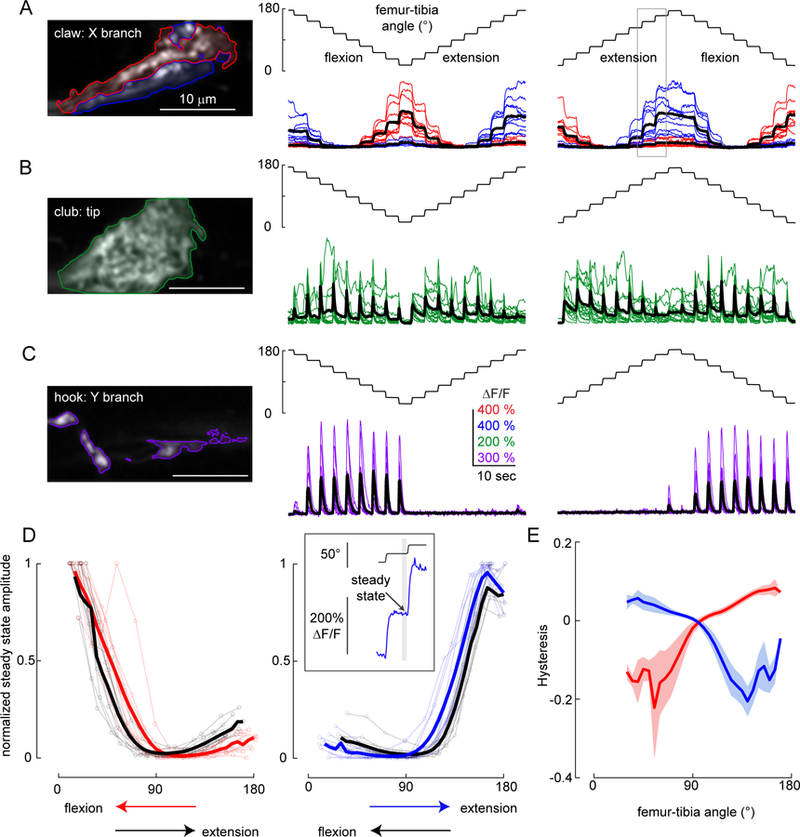
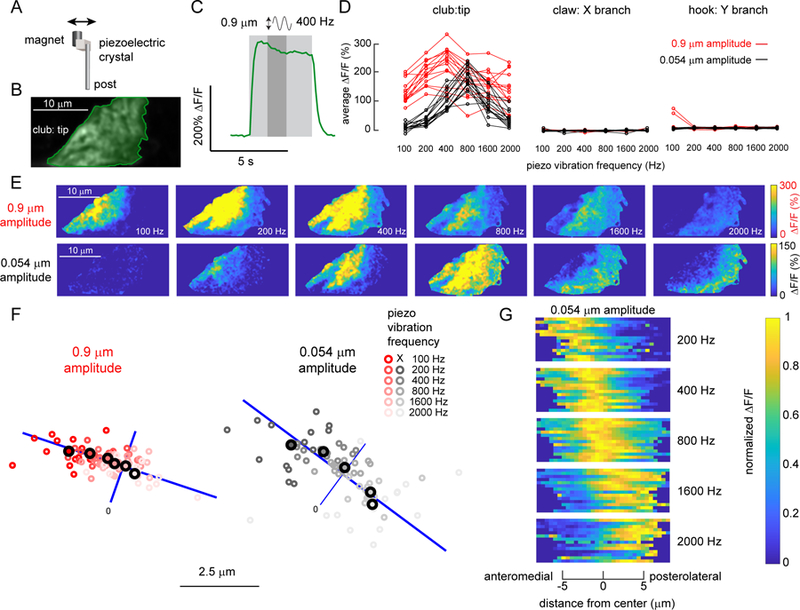
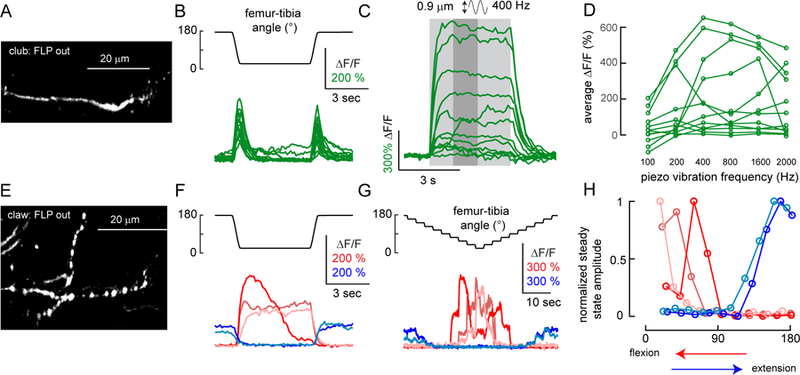
Animals rely on an internal sense of body position and movement to effectively control motor behavior. This sense of proprioception is mediated by diverse populations of mechanosensory neurons distributed throughout the body. Here, we investigate neural coding of leg proprioception in Drosophila, using in vivo two-photon calcium imaging of proprioceptive sensory neurons during controlled movements of the fly tibia. We found that the axons of leg proprioceptors are organized into distinct functional projections that contain topographic representations of specific kinematic features. Using subclass-specific genetic driver lines, we show that one group of axons encodes tibia position (flexion/extension), another encodes movement direction, and a third encodes bidirectional movement and vibration frequency. Overall, our findings reveal how proprioceptive stimuli from a single leg joint are encoded by a diverse population of sensory neurons, and provide a framework for understanding how proprioceptive feedback signals are used by motor circuits to coordinate the body.

Keywords: Drosophila; chordotonal; mechanosensation; mechanosensory; motor control; neural coding; proprioception; proprioceptive; proprioceptor; two-photon imaging.


Conflict of interest statement

Declaration of interests

The authors declare no competing interests.

Figures

Figure 1.
Figure 1.. Investigating proprioceptive tuning of the Drosophila femoral chordotonal organ (FeCO).
A. A confocal image of the front (T1) leg of Drosophila melanogaster, showing the location of the FeCO cell bodies and dendrites (green). Magenta is auto-fluorescence from the cuticle. B. An experimental setup for 2-photon calcium imaging from the axons of FeCO neurons while controlling and tracking the femur-tibia joint. To control joint angle, we glued a pin to the tibia and positioned it using a magnet mounted on a servo motor. In vibration trials, we vibrated the tibia with a piezoelectric crystal fixed to the magnet. We backlit the tibia with an IR LED and recorded the tibia position from below using a prism and high-speed video camera. C. An example frame from a video used to track joint angle. The pin is painted black to enhance the contrast against the background. D. FeCO axon terminals (green) in the fly ventral nerve cord (VNC). Magenta is a neuropil stain (nc82). Teal box indicates region imaged by the 2-photon microscope. E. 2-photon image of FeCO axon terminals expressing GCaMP6f driven by iav-Gal4. The teal box indicates the region imaged in the example recording shown in panels G-H. F. A cross-correlation matrix showing pixel-to-pixel correlations of the changes in GCaMP6f fluorescence (∆F/F) during an example trial shown in panels G-H. Left: the cross-correlation matrix before correlation based clustering. Right: the matrix after clustering. The colors on the right of the correlation matrix correspond to the cluster colors used in G-H. G. Image of GCaMP6f fluorescence showing the recording region for the example trial shown in F and H. Each group of pixels is shaded according to its cluster identity. The colors correspond to the ∆F/F traces shown in H. H. Calcium signals from different clusters of pixels during an example trial. Each trace shows the changes in GCaMP6f fluorescence (∆F/F) for the groups of pixels shaded with the same color in the panel G. See also Figure S1.
Figure 2.
Figure 2.. FeCO axons encode distinct proprioceptive features.
Each panel (A-D) shows calcium signals recorded from FeCO axons (UAS-GCamp6f; iav-Gal4) within a different region of interest. A. Imaging from an anterolateral region. Left column: example images of GCaMP6f fluorescence from three flies. In each fly, we categorized the pixels into three clusters (as in Figure 1F). The red and blue regions are tonically active when the tibia is flexed (red) or extended (blue). The green region responds phasically during tibia movement. The color scheme is maintained throughout the figure and also corresponds to the color scheme used in Figure 1G–H. A white cross represents the center of the recording region, aligned to the long axis of each axon projection. Middle column: Calcium signals for each group of pixels recorded from multiple flies. Red, blue, and green lines show GCaMP6f fluorescence (F/F) during the trial for each cluster of pixels (red: n= 10 flies, blue: n = 10, green: n = 9). Black lines show the response average. Right column: the location of each cluster relative to the center of the recording region across flies. The larger outlined circles represent the mean location of the center for each cluster. Each image was rotated to a common axis (see Methods for details). B. Imaging from an anteromedial region (red: n= 11 flies, blue: n = 11, green: n = 10, orange: n = 10). In addition to the three response subclasses we identified in A, this region also contained a group of pixels that responded phasically during tibia extension (orange). C. Imaging from a posterolateral region (red: n= 10 flies, blue: n = 10, purple: n = 8, orange: n = 9). Here, we identified pixels that responded phasically during joint flexion (purple). D. Imaging from a medial region (green: n = 10 flies, purple: n = 11, orange: n = 10). The scale bar in the center image is 20 µm. See also Figures S1 and S2.
Figure 3.
Figure 3.. Organization of genetically-defined FeCO neuron subclasses in the VNC and leg.
A. Four Gal4 lines label subsets of FeCO axons in the VNC. Green: GFP driven by each Gal4 line, magenta: nc82 neuropil staining. Scale bar is 50 µm. B. Example morphologies of single FeCO neurons driven by each Gal4 line, traced from images obtained by stochastic labeling with the multi-color FlpOut technique. Dotted lines indicate severed axons. C. FeCO cell bodies are clustered in characteristic locations in the fly leg. Cell bodies were labeled with UAS-Redstinger driven by each Gal4 line. Scale bars are 10 µm. D. Co-labeling of FeCO cell bodies from each Gal4 line (as in C), with a green reference marker that labels all FeCO neurons (ChAT-Lexa; LexAop - nlsGFP). E. Same as D, but viewed from the dorsal side. F. Number of neurons labeled by each Gal4 line shown in A. Circles are individual flies, lines indicate the mean (iav, n = 6 flies; club, n = 5; claw, n = 4; hook, n = 2; ChAT, n = 19). G. Ratio of neurons labeled by each Gal4 line to those labeled by ChAT-LexA in the same leg. H. in silico overlay of the axon projections of the club, claw, and hook neurons in the VNC. I. A schematic of the FeCO in the femur, showing the location of cell bodies labeled by each Gal4 line. See also Figure S3.
Figure 4.
Figure 4.. Three Gal4 lines delineate FeCO functional subclasses.
A. Claw neurons encode tibia position, with distinct pixels responding to either flexion (red) or extension (blue). Left: The claw axon projection in the VNC visualized with GCaMP6f fluorescence driven by R73D10-Gal4. White rectangles represent the imaging locations for the X, Y, and Z branches shown in the right three columns. In each column, the top image shows a representative region of interest, with flexion-encoding pixels shaded in red, extension encoding pixels in blue. The Y branch is rotated 90 degrees clockwise. The bottom rows show changes in GCaMP6f fluorescence relative to the baseline (F/F) recorded from each sub-region in different flies (n = 10 flies for each region). Thick black lines represent average responses. B. Same as A, but for movement-sensitive club neurons (R64C04-Gal4). The club neurons respond phasically to both the flexion and the extension of the joint (n = 14 flies for tip, 11 flies for middle). C. Same as A and B, but for directionally-tuned hook neurons (R21D12-Gal4). The hook neurons respond phasically to flexion of the joint, but not extension (n = 14 flies for tip and Z, 9 flies for Y). See also Figures S4 and S5.
Figure 5.
Figure 5.. Claw neurons encode joint position, club neurons encode bidirectional movements, and hook neurons encode movement direction.
A. Responses of position-encoding claw neurons (R73D10-Gal4) to ramp-and-hold stimuli. Left column: Average GCaMP6f fluorescence from the X branch of the claw projection where the example recordings were made (red: flexion encoding, blue: extension encoding). Middle column: Responses from the two regions to a ramp-and-hold stimulus that starts with the joint extended (n = 10 flies). Right column: Same as above but starting with the joint flexed. The grey rectangle indicates the location of the trace shown in the top inset in D. B. Same as A, but for club neurons (R64C04-Gal4), which increase their activity phasically in response to each step (n = 14 flies). C. Same as A and B, but for hook neurons (driven by R21D12-Gal4), which only respond during flexion (n = 9 flies). D. Calcium signals of claw neurons depend on movement history. Left column: steady state ∆F/F at different joint angles for the flexion activated (red: during flexion, black: during extension, thick lines: average response) sub-branches of the claw, normalized by the maximum peak response recorded in each fly (n= 10 flies). Steady-state responses were measured at the end of the hold step (top inset at right). In these recordings, flexion preceded extension. Right column: Same as the left column but for the extension activated (blue: during extension, black: during flexion, thick lines: average response) sub-branches of the claw (n = 10 flies). In these recordings, extension preceded flexion. E. Hysteresis (difference between the response to the activating direction and the non-activating direction) of the steady-state response for flexion (red) and extension (blue) activated sub-branches of the claw (thick lines: average response, shading: standard error of the mean).
Figure 6.
Figure 6.. A map of vibration frequency in the axons of club neurons.
A. To vibrate the fly’s tibia, we attached one side of a piezoelectric crystal to a magnet and the other to a post fixed to a servo motor. The magnet was placed directly onto a pin glued to the tibia (see Figure S6 for details). B. Average GCaMP6f fluorescence from an example recording location, at the tip of the club axons (R64C04-Gal4). C. An example time course of the club’s response (∆F/F) to a 400 Hz, 0.9 µm vibration of the magnet. We averaged the activity level in a 1.25 second window (indicated by a darker grey shading) starting from 1.25 seconds after the stimulation onset, and used it as a measure of response amplitude in D and as activity maps in E. D. Only club neurons respond reliably to the vibration stimulus. Plots show the activity of different subsets of FeCO axons in response to tibia vibrations at different frequencies and amplitudes. Each line represents an average response from one fly. E. Example ∆F/F maps of GCaMP6f fluorescence at the tip of the club in response to tibia vibration at different frequencies and amplitudes. For both amplitudes, the responding regions shifted from the anterolateral side to the posteromedial side of the axon projection as stimulation frequency increased. F. A map of vibration frequency in club axon terminals. Smaller empty circles with different shades of red (0.9 µm amplitude) or grey (0.054 µm amplitude) represent the location of the weighted center of the responding region in different flies (n = 14 flies for both amplitudes). Larger, outlined circles represent the average location. The blue line represents the best fit line to the average locations across frequencies. We rotated the images from each fly to match the orientation of the example images shown in E. G. Distribution of activity (∆F/F) along the anterolateral to posteromedial axis (blue lines in F) of the club axons during tibia vibration. Signals were normalized by the maximum average activity during each stimulus in that fly. Responses shifted from the anterolateral to posteromedial side as vibration frequency increased. See also Figure S6
Figure 7.
Figure 7.. Calcium imaging from single FeCO axons reveals narrow tuning of club and claw neurons.
A. GCamp6f fluorescence in a single club neuron (R64C04-Gal4), imaged with a 2-photon microscope. B. Single club neurons respond to swing movements of the tibia in both directions (flexion and extension). Each trace indicates the average response of one club axon (n = 13 cells from 9 flies). C. Single club neurons respond to tibia vibration. Each trace is the average response of one axon (n = 12 cells from 7 flies). The stimulus duration is indicated by light grey shading. D. Frequency tuning of club neurons is diverse. Each line represents an average response from one neuron. We averaged the activity level in a 1.25 second window (indicated by the darker grey shading in C) starting from 1.25 seconds after the stimulation onset. E. GCamp6f fluorescence in a single claw axon (R73D10-Gal4). F. Single claw neurons encode either flexion or extension. Each trace shows the average calcium signal from a single claw axon (n = 5 cells from 5 flies, indicated by different colors). G. Position tuning of single claw neurons. Each trace shows average calcium responses to ramp-and-hold movement of the tibia. H. Single claw neurons encode different tibia angles. Each line indicates steady state activity at different joint angles for the claw neurons shown in F and G, normalized by the maximum response of each cell. Steady-state responses were measured at the end of the hold step, as in Figure 5D. To remove the effect of hysteresis, we plotted the responses during flexion for the flexion-activated neurons (red) and during extension for the extension activated neurons (blue). See also Figure S7.

Similar articles

Cited by

References

    1. Abraira VE, and Ginty DD (2013). The sensory neurons of touch. Neuron 79, 618–639. - PMC - PubMed
    1. Ahrens MB, Orger MB, Robson DN, Li JM, and Keller PJ (2013). Whole-brain functional imaging at cellular resolution using light-sheet microscopy. Nat Methods 10, 413–420. - PubMed
    1. Albert JT, and Gopfert MC (2015). Hearing in Drosophila. Current opinion in neurobiology 34, 79–85. - PMC - PubMed
    1. Alivisatos AP, Chun M, Church GM, Deisseroth K, Donoghue JP, Greenspan RJ, McEuen PL, Roukes ML, Sejnowski TJ, Weiss PS, et al. (2013). Neuroscience. The brain activity map. Science 339, 1284–1285. - PMC - PubMed
    1. Bässler U (1988). Functional principles of pattern generation for walking movements of stick insect forelegs: the role of the femoral chordotonal organ afferences. Journal of Experimental Biology 136, 125–147.

Publication types

LinkOut - more resources