. 2018 Nov 5;47(3):348-362.e7.
doi: 10.1016/j.devcel.2018.09.003. Epub 2018 Oct 4.

Inheritance of CENP-A Nucleosomes during DNA Replication Requires HJURP

Affiliations

Inheritance of CENP-A Nucleosomes during DNA Replication Requires HJURP

Ewelina Zasadzińska et al. Dev Cell. .

Abstract

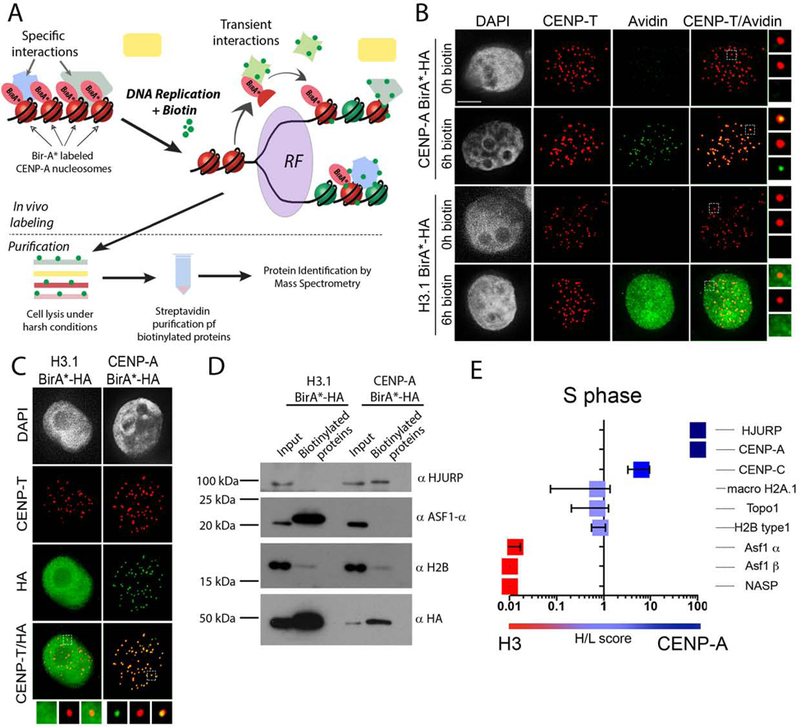
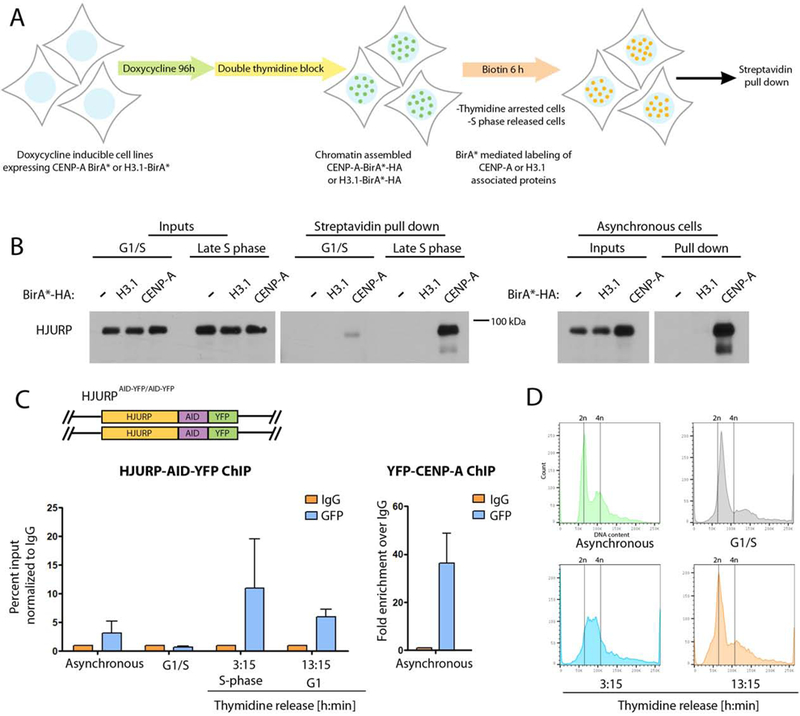
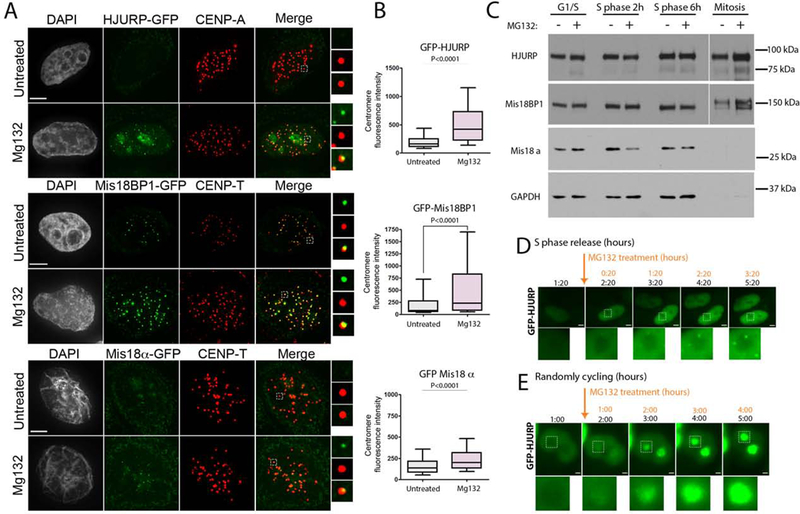
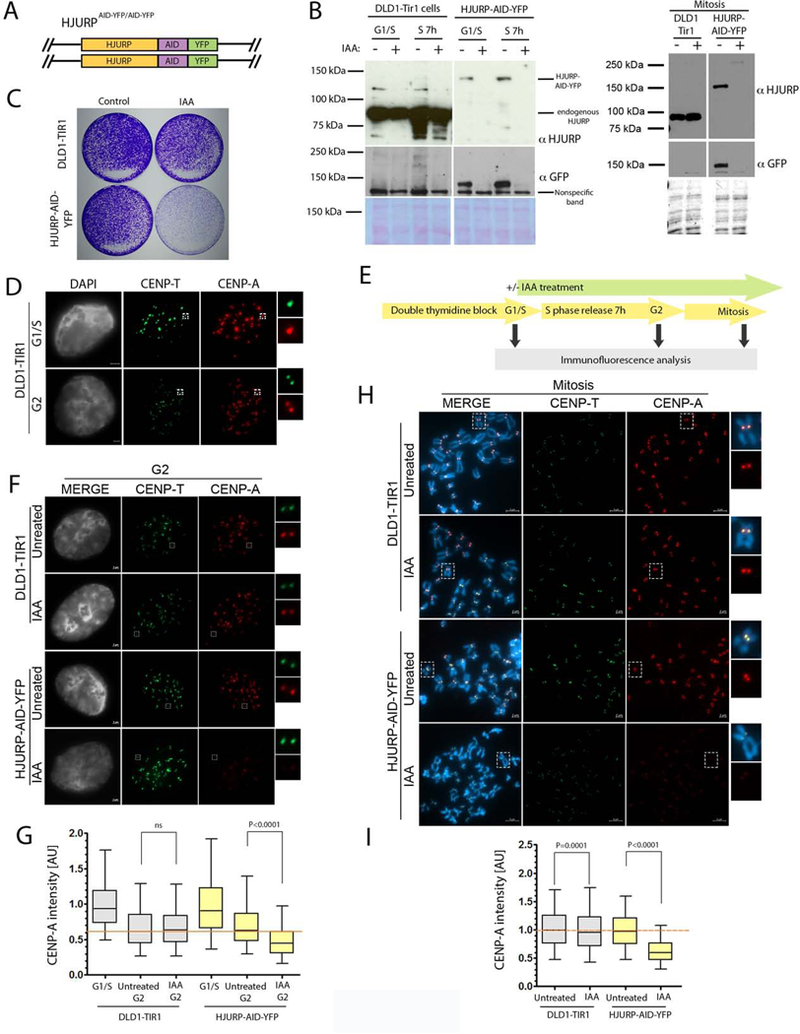
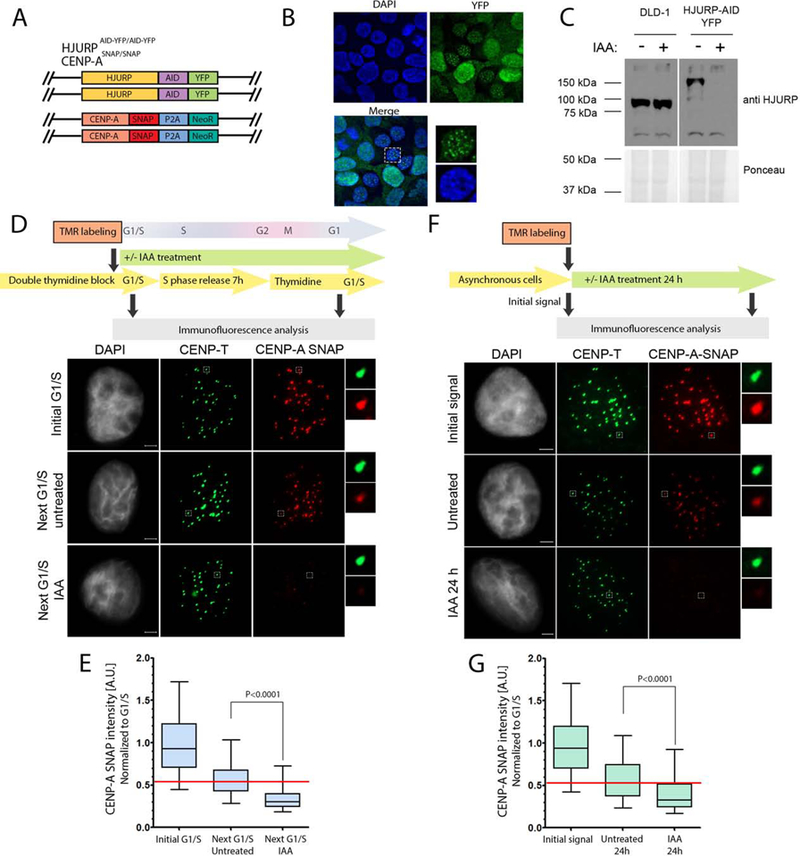
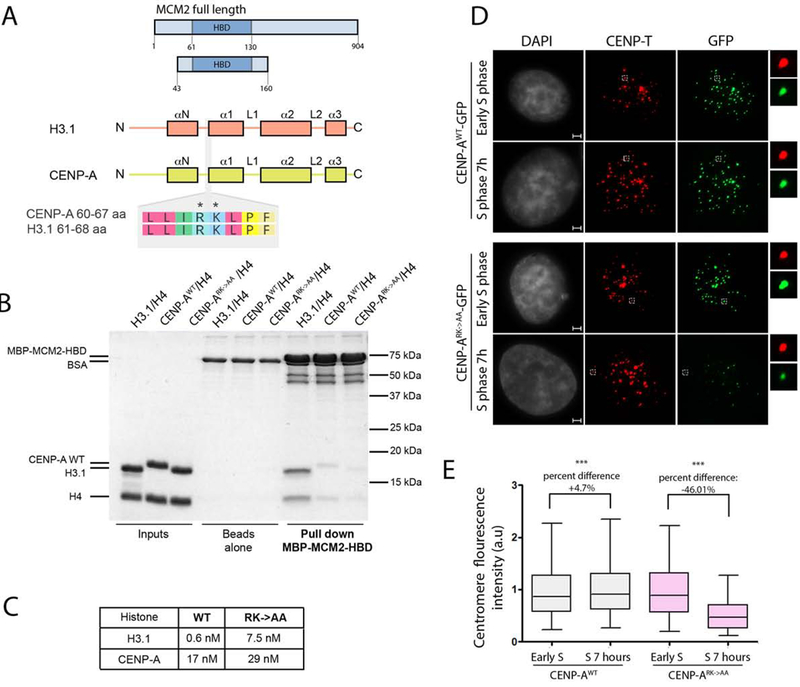
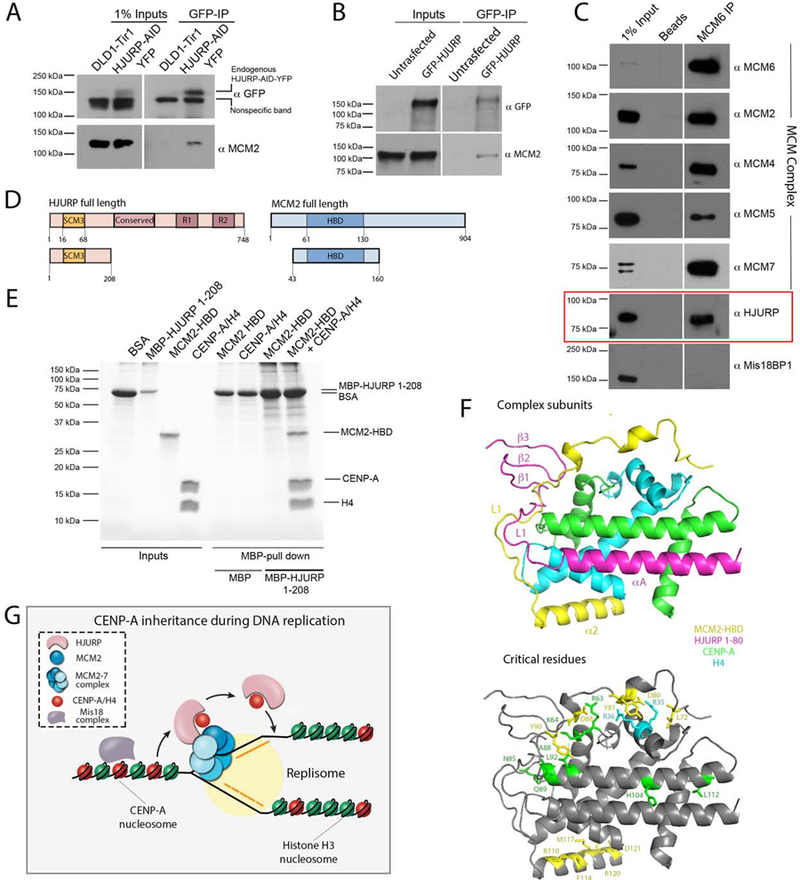
Centromeric chromatin defines the site of kinetochore formation and ensures faithful chromosome segregation. Centromeric identity is epigenetically specified by the incorporation of CENP-A nucleosomes. DNA replication presents a challenge for inheritance of centromeric identity because nucleosomes are removed to allow for replication fork progression. Despite this challenge, CENP-A nucleosomes are stably retained through S phase. We used BioID to identify proteins transiently associated with CENP-A during DNA replication. We found that during S phase, HJURP transiently associates with centromeres and binds to pre-existing CENP-A, suggesting a distinct role for HJURP in CENP-A retention. We demonstrate that HJURP is required for centromeric nucleosome inheritance during S phase. HJURP co-purifies with the MCM2-7 helicase complex and, together with the MCM2 subunit, binds CENP-A simultaneously. Therefore, pre-existing CENP-A nucleosomes require an S phase function of the HJURP chaperone and interaction with MCM2 to ensure faithful inheritance of centromere identity through DNA replication.

Keywords: DNA replication; centromere; chromatin; chromosome; epigenetics; helicase; mitosis; nucleosome.


Conflict of interest statement

Declaration of Interests

The authors declare no competing interests.

Figures

Figure 1.
Figure 1.. Labeling of proteins transiently associated with CENP-A and H3.1 nucleosomes.
(A) Schematic representation of the experimental approach. (B) (C) Representative images of cells stably expressing indicated proteins fused to the BirA* ligase and HA tag, and incubated with medium supplemented with or without biotin for 5 hours. DNA is visualized by DAPI staining, immunofluorescence for CENP-T is shown in red, biotinylated proteins (B) or BirA*-HA fusion proteins (C) are shown in green. Scale bar is 5μm. (D) Streptavidin purification of biotinylated proteins from indicated cells lines analyzed by immunoblot. Cell media was supplemented with or without biotin for 24 hours. (E) Graph showing SILAC comparison between CENP-A-BirA*-HA biotinylation profile (heavy) versus biotinylation profile of H3.1-BirA-HA* (light) in cells undergoing S phase. Corresponding H/L scores for selected proteins are displayed. The graph represents an average of two independently performed experiments +/− SEM.
Figure 2.
Figure 2.. CENP-A deposition proteins are associated with centromeres during DNA replication.
(A) Schematic representation of the experimental approach used in B. Cells were blocked at the G1/S boundary or early S phase by addition of thymidine, and allowed to under S phase following thymidine removal. (B) Cells expressing BirA*-fused proteins under doxycycline inducible promoter were treated as shown in A. Biotinylated proteins were isolated by streptavidin purification following by immunoblot analysis with an HJURP antibody. The experiment was conducted twice, each experiment was conducted using 0.9*107 cells. Input and pull down fractions in the experiment were run on independent gels. (C) Schematic representation of the DLD1-Tir1 cell line where HJURP was endogenously tagged at both alleles with AID-YFP. ChiP from HJURP-AID-YFP cells (left) or YFP-CENP-A cells (right) at indicated time points. ChIP was performed using anti-GFP antibody or normal rabbit IgG. RT-PCR was performed using primers specific for α-satellite DNA of chromosome 7. The graph represents an average of two independent experiments, +/− SEM. (D) FACS profiles of cells used as an input for ChIP.
Figure 3
Figure 3. CENP-A deposition proteins accumulate at centromeres during DNA replication in response to MG132 treatment.
(A) Representative images of cells expressing GFP-fused HJURP, Mis18BP1 or Mis18α during S phase with or without MG132 treatment. Scale bar is 5μm. (B) Quantification of the GFP fluorescence intensity in A. Data was plotted using box-and-whisker plot: 10–90 percentile. The statistical significance was calculated using unpaired t-test and the p values are indicated, n > 434 (C) Immunoblot analysis of HJURP, Mis18BP1 and Mis18α protein levels in response to MG132 treatment at indicated cell cycle stages. The separated section of the blot corresponds to a longer exposure required due to unequal loading (see GAPDH). (D)(E) Live-cell images of cells expressing GFP-HJURP undergoing S phase. (D) or in asynchronous (E) cell populations. Cells were treated with MG132 during imaging starting from the time points indicated by the arrow. Scale bar is 5μm and 2μm, respectively.
Figure 4.
Figure 4.. HJURP is required for CENPA retention across S phase
(A) Schematic representation DLD1-Tir1 cell line where HJURP was endogenously tagged with AID-YFP at both alleles. (B) Immunoblot analysis showing the efficiency of IAA dependent HJURP degradation. Ponceau was used as a loading control. The blots in B were separated into two sections due to removal of extraneous samples present on the same blot. (C) Clonogenic assay using the parental DLD1-Tir1 and HJURP-AID-YFP cells plus or minus IAA treatment for 10 days. (D) Representative images of DLD1-Tir1 cells in G1/S arrest and G2 phase. Insets are showing single centromeres and sister centromeres in G1/S and G2 phase cells, respectively. DNA was visualized by DAPI, immunofluorescence for CENP-T is shown in green and CENP-A is shown in red. Scale bar is 2μm. (E) Schematic representation of the experiment in F and H. (F)(H) Representative images of cells in G2 phase and mitosis, respectively, and treated as shown in E. DNA was visualized by DAPI, immunofluorescence for CENP-T is shown in green and CENP-A is shown in red. Scale bar is indicated. (G)(I) Quantification of F and H, respectively. The data normalized to G1/S phase condition (G) and untreated condition (I) within cell lines. Normalized data from four (G) or three (I) independent experiments was plotted using box-and-whisker plot: 5–95 percentile, n > 2946 (G) and 8414 centromeres (I). The statistical significance was calculated using unpaired t-test and the p values are indicated. For reference, red line indicates level of CENP-A retention in (G) untreated parental control in G2 phase or (I) untreated parental control in mitosis. The percent loss of CENP-A was calculated to be 31.53% and 36.68% in G and I, respectively.
Figure 5.
Figure 5.. HJURP is required for CENPA inheritance of existing CENP-A nucleosomes.
(A) Schematic representation of the DLD1-Tir1 cell line where HJURP was endogenously tagged with AID-YFP and CENP-A was endogenously tagged with the SNAP tag. (B) The immunofluorescence images of the localization profile of HJURP-AID-YFP in cell line shown in A. (C) Immunoblot analysis of the efficiency of IAA dependent HJURP degradation during mitosis demonstrated by staining with HJURP antibody. Ponceau staining was used as a loading control. The blots were separated in two sections due to removal of empty lanes from the original blot. (D) (F) Schematic representation of the experiment (top). Representative images of cells at indicated time points and treated as shown in the top panel. DNA was visualized by DAPI, immunofluorescence for CENP-T is shown in green and CENP-A is shown in red (bottom). Scale bar is 2μm. (E)(G) Quantification of D and F, respectively. The data was normalized to initial G1/S condition (E) or initial signal (G) within each individual experiment. Normalized data from two (E) or three (G) independent experiments was plotted using box-and-whisker plot: 5–95 percentile, n at least 4674 (E) and 2295 (G). The statistical significance was calculated using unpaired t-test and the p values are indicated. For reference, red line indicates the median level of CENP-A retention in untreated control. The percent loss of CENP-A was calculated to be 38.41% and 27.91% in E and G, respectively.
Figure 6.
Figure 6.. MCM2 binds CENP-A and is involved in its maintenance during DNA replication
(A) Schematic representation of constructs used in B and C. The CENP-A and H3.1 domain structure is shown. The alignment of an 8 amino acid stretch corresponding to both histones demonstrates the conservation of Arginine 63 and Lysine 64 between the variants. (B) MBP-MCM2-HBD in vitro pull down demonstrating the interaction with indicated histone variants in the wild type and mutant form. (C) Table indicating Kd values measured SPR to assess the strength of interaction between MBP-MCM2-HBD and indicated histone variants in the wild type and mutant form. (D) Representative images of HeLa cells expressing either CENP-AWT-GFP or CENP-ARK->AA-GFP mutant at indicated cell cycle stages. DNA was visualized by DAPI, immunofluorescence for CENP-T is shown in red, expressed CENP-A was detected by GFP signal. Scale bar is 2μm. (E) Quantification of D. The data vas plotted using box-and-whisker plot: 5–95 percentile, n > 5660. The percent change of the levels of centromeric CENP-AWT-GFP and CENP-ARK->AA-GFP forms between experimental time points is indicated, (***) indicates p value <0.0001, statistical significance was calculated using unpaired t-test.
Figure 7.
Figure 7.. HJURP copurifies with the MCM2–7 helicase complex and simultaneously interact with MCM2-CENP-A/H4 proteins.
(A) Immunoblot analysis of GFP immunoprecipitation (IP) demonstrating the interaction of endogenous HJURP with endogenous MCM2. HJURP-AID-YFP DLD-1 cells were used as an input for the IP and samples were analyzed with indicated antibodies. (B) Immunoblot analysis of GFP IP performed from HEK293 cells overexpressing HJURP-GFP. Samples were analyzed with indicated antibodies. The blots in (A) and (B) were separated in two sections as the input and IP fractions correspond to different exposure times. (C) Immunoblot analysis of MCM6 IP performed from HEK293-derived cell lysates treated with Micrococcal nuclease. Samples were analyzed with indicated antibodies. (D) Schematic representation of constructs used in E. (E) Coomassie gel of MBP-HJURP1−208 in vitro pull down demonstrating the interaction with MCM2-HBD only in the presence of CENP-A/H4 heterodimer. (F) The superimposed model of 3R45 and 5BNX crystal structures where H3.3 and CENP-A were used as a reference. MCM2-HBD is shown in yellow, HJURP1−80, CENP-A and H4 are shown in pink, green, and aqua, respectively. Residues critical for facilitating the interaction of MCM2 with histones and mediating CENP-A recognition by HJURP are depicted in bottom panel. (G) The model of inheritance of CENP-A nucleosomes across DNA replication. MCM2–7 helicase complex is involved in unwinding chromatin ahead of the replication fork. HJURP is associated with MCM2–7 complex, and both MCM2 and HJURP can bind CENP-A nucleosomes simultaneously. The ability of CENP-A to be recognized by HJURP through the CATD domain and MCM2 through the R63-K64 motif are both essential for facilitating CENP-A retention across S phase and maintaining centromere identity.

Comment in

Similar articles

Cited by

References

    1. Alabert C, Bukowski-Wills JC, Lee SB, Kustatscher G, Nakamura K, de Lima Alves F, Menard P, Mejlvang J, Rappsilber J, and Groth A (2014). Nascent chromatin capture proteomics determines chromatin dynamics during DNA replication and identifies unknown fork components. Nat Cell Biol 16, 281–293. - PMC - PubMed
    1. Alabert C, and Groth A (2012). Chromatin replication and epigenome maintenance. Nature reviews Molecular cell biology 13, 153–167. - PubMed
    1. Allshire RC, and Karpen GH (2008). Epigenetic regulation of centromeric chromatin: old dogs, new tricks? Nat Rev Genet 9, 923–937. - PMC - PubMed
    1. Amano M, Suzuki A, Hori T, Backer C, Okawa K, Cheeseman IM, and Fukagawa T (2009). The CENP-S complex is essential for the stable assembly of outer kinetochore structure. The Journal of cell biology 186, 173–182. - PMC - PubMed
    1. Annunziato AT, Schindler RK, Thomas CA Jr., and Seale RL (1981). Dual nature of newly replicated chromatin. Evidence for nucleosomal and non-nucleosomal DNA at the site of native replication forks. The Journal of biological chemistry 256, 11880–11886. - PubMed

Publication types

MeSH terms