

A Computational Model of Deep-Brain Stimulation for Acquired Dystonia in Children
- PMID: 30294268
- PMCID: PMC6158364
- DOI: 10.3389/fncom.2018.00077
A Computational Model of Deep-Brain Stimulation for Acquired Dystonia in Children
Abstract
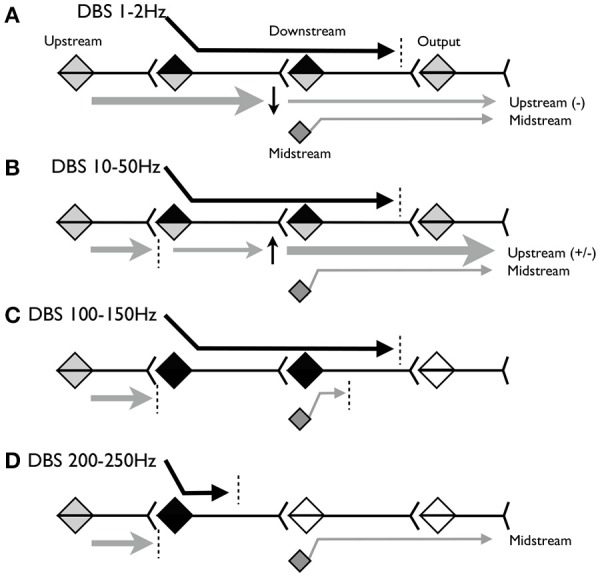
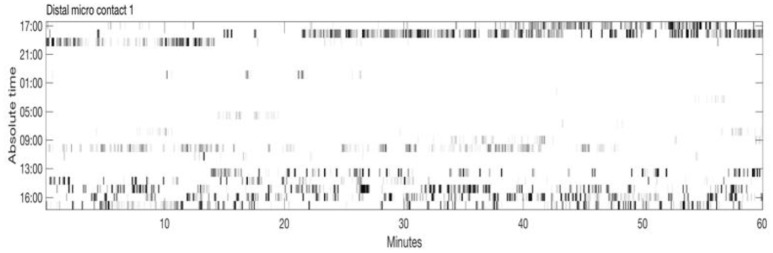
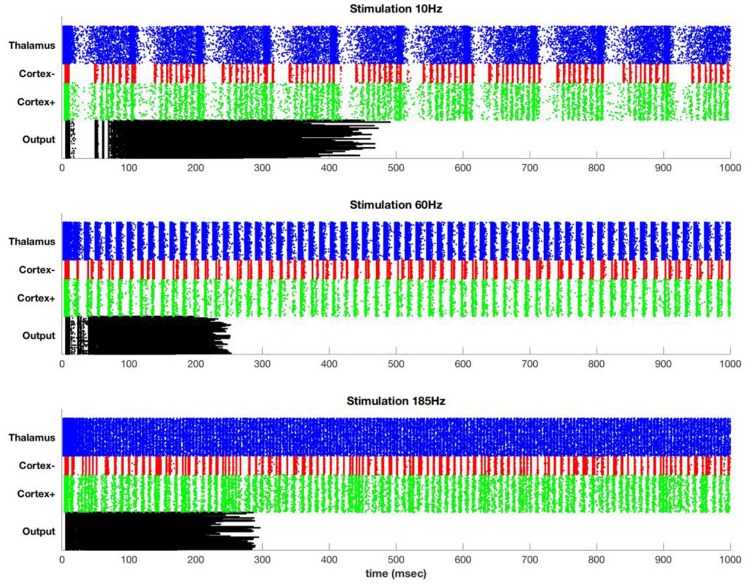
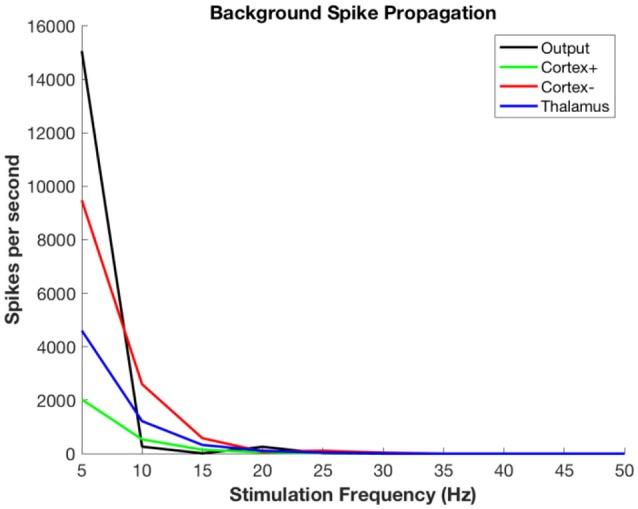
The mechanism by which deep brain stimulation (DBS) improves dystonia is not understood, partly heterogeneity of the underlying disorders leads to differing effects of stimulation in different locations. Similarity between the effects of DBS and the effects of lesions has led to biophysical models of blockade or reduced transmission of involuntary activity in individual cells in the pathways responsible for dystonia. Here, we expand these theories by modeling the effect of DBS on populations of neurons. We emphasize the important observation that the DBS signal itself causes surprisingly few side effects and does not normally appear in the electromyographic signal. We hypothesize that, at the population level, massively synchronous rhythmic firing caused by DBS is only poorly transmitted through downstream populations. However, the high frequency of stimulation overwhelms incoming dystonic activity, thereby substituting an ineffectively transmitted exogenous signal for the endogenous abnormal signal. Changes in sensitivity can occur not only at the site of stimulation, but also at downstream sites due to synaptic and homeostatic plasticity mechanisms. The mechanism is predicted to depend strongly on the stimulation frequency. We provide preliminary data from simultaneous multichannel recordings in basal ganglia and thalamus in children with secondary dystonia. We also provide illustrative simulations of the effect of stimulation frequency on the transmission of the DBS pulses through sequential populations of neurons in the dystonia pathway. Our experimental results and model provide a new hypothesis and computational framework consistent with the clinical features of DBS in childhood acquired dystonia.
Keywords: basal ganglia; deep brain stimulation; dystonia; pediatric; single unit recording; thalamus.
Figures


Similar articles
-
Deep brain stimulation changes basal ganglia output nuclei firing pattern in the dystonic hamster.Neurobiol Dis. 2010 May;38(2):288-98. doi: 10.1016/j.nbd.2010.01.020. Epub 2010 Feb 4. Neurobiol Dis. 2010. PMID: 20138992
-
Historical developments in children's deep brain stimulation.Eur J Paediatr Neurol. 2017 Jan;21(1):109-117. doi: 10.1016/j.ejpn.2016.08.010. Epub 2016 Sep 7. Eur J Paediatr Neurol. 2017. PMID: 27693334 Review.
-
Frequency-dependent effects of electrical stimulation in the globus pallidus of dystonia patients.J Neurophysiol. 2012 Jul;108(1):5-17. doi: 10.1152/jn.00527.2011. Epub 2012 Mar 28. J Neurophysiol. 2012. PMID: 22457462
-
Pallidal Deep-Brain Stimulation Disrupts Pallidal Beta Oscillations and Coherence with Primary Motor Cortex in Parkinson's Disease.J Neurosci. 2018 May 9;38(19):4556-4568. doi: 10.1523/JNEUROSCI.0431-18.2018. Epub 2018 Apr 16. J Neurosci. 2018. PMID: 29661966 Free PMC article.
-
The physiological effects of pallidal deep brain stimulation in dystonia.IEEE Trans Neural Syst Rehabil Eng. 2007 Jun;15(2):166-72. doi: 10.1109/TNSRE.2007.896994. IEEE Trans Neural Syst Rehabil Eng. 2007. PMID: 17601185 Review.
Cited by
-
The Efficacy and Predictors of Using GPi-DBS to Treat Early-Onset Dystonia: An Individual Patient Analysis.Neural Plast. 2021 May 7;2021:9924639. doi: 10.1155/2021/9924639. eCollection 2021. Neural Plast. 2021. PMID: 34040641 Free PMC article.
-
Deep brain stimulation of the subthalamic nucleus in severe Parkinson's disease: relationships between dual-contact topographic setting and 1-year worsening of speech and gait.Acta Neurochir (Wien). 2023 Dec;165(12):3927-3941. doi: 10.1007/s00701-023-05843-9. Epub 2023 Oct 27. Acta Neurochir (Wien). 2023. PMID: 37889334
-
Neuro4PD: An Initial Neurorobotics Model of Parkinson's Disease.Front Neurorobot. 2021 Jul 1;15:640449. doi: 10.3389/fnbot.2021.640449. eCollection 2021. Front Neurorobot. 2021. PMID: 34276331 Free PMC article.
-
Deep brain stimulation in globus pallidus internus travels to thalamus and subthalamic nuclei along physiological pathways.Front Neurosci. 2025 Jul 24;19:1592689. doi: 10.3389/fnins.2025.1592689. eCollection 2025. Front Neurosci. 2025. PMID: 40778353 Free PMC article.
-
Thalamic deep brain stimulation for acquired dystonia in children and young adults: a phase 1 clinical trial.J Neurosurg Pediatr. 2020 Nov 27;27(2):203-212. doi: 10.3171/2020.7.PEDS20348. Print 2021 Feb 1. J Neurosurg Pediatr. 2020. PMID: 33254134 Free PMC article. Clinical Trial.
References
LinkOut - more resources
Full Text Sources