. 2018 Nov 1;128(11):5018-5033.
doi: 10.1172/JCI99659. Epub 2018 Oct 8.

Angiopoietin-2 exacerbates cardiac hypoxia and inflammation after myocardial infarction

Affiliations

Angiopoietin-2 exacerbates cardiac hypoxia and inflammation after myocardial infarction

Seung-Jun Lee et al. J Clin Invest. .

Abstract

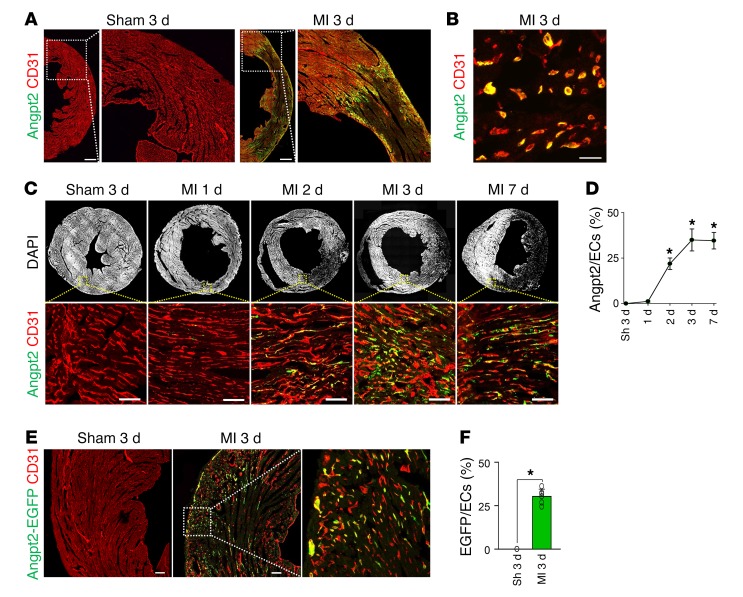
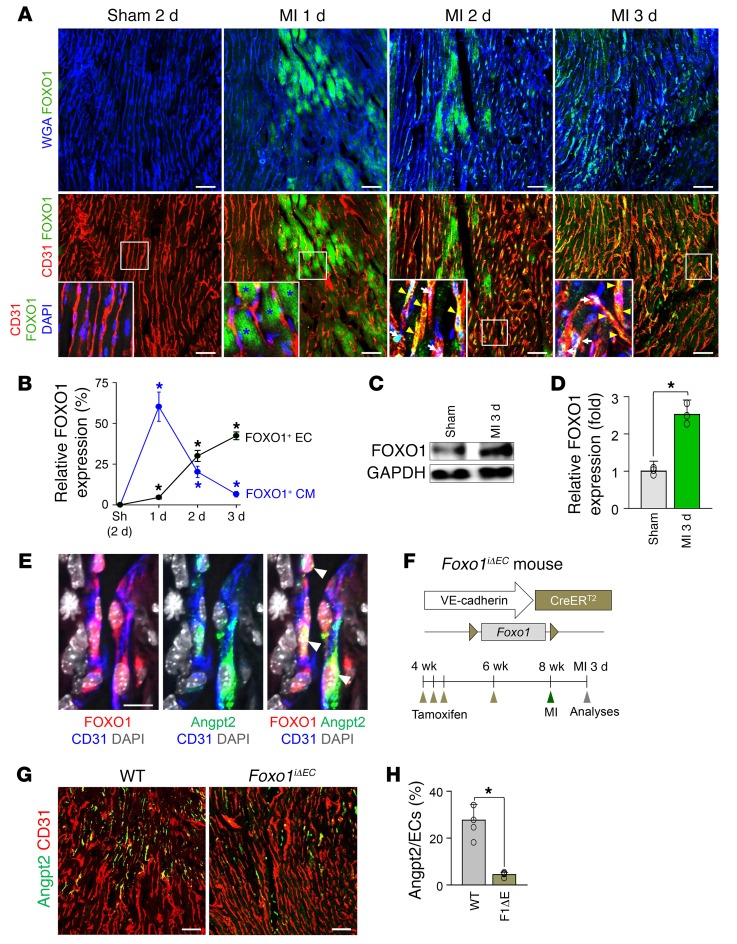
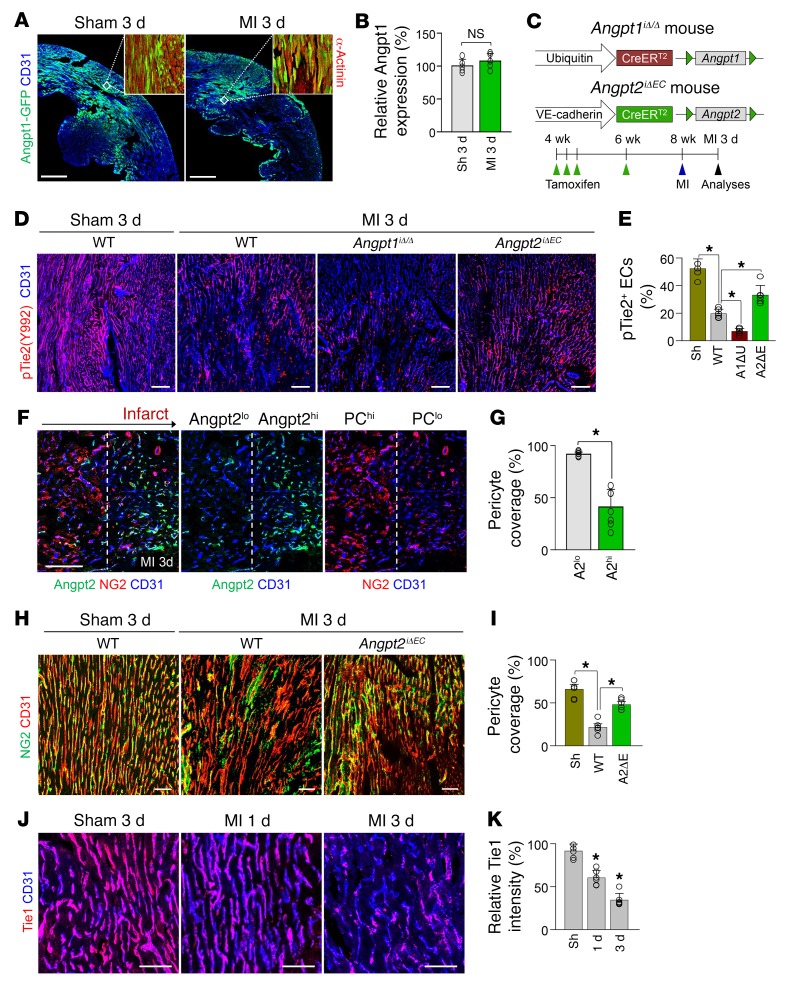
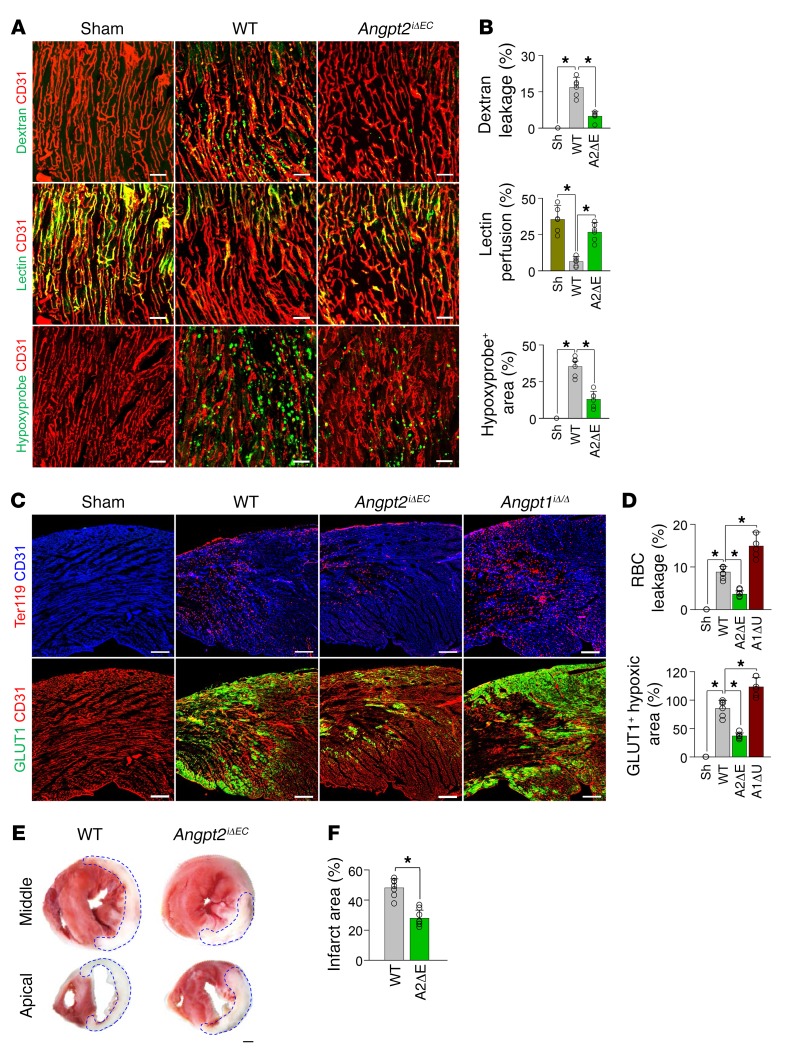
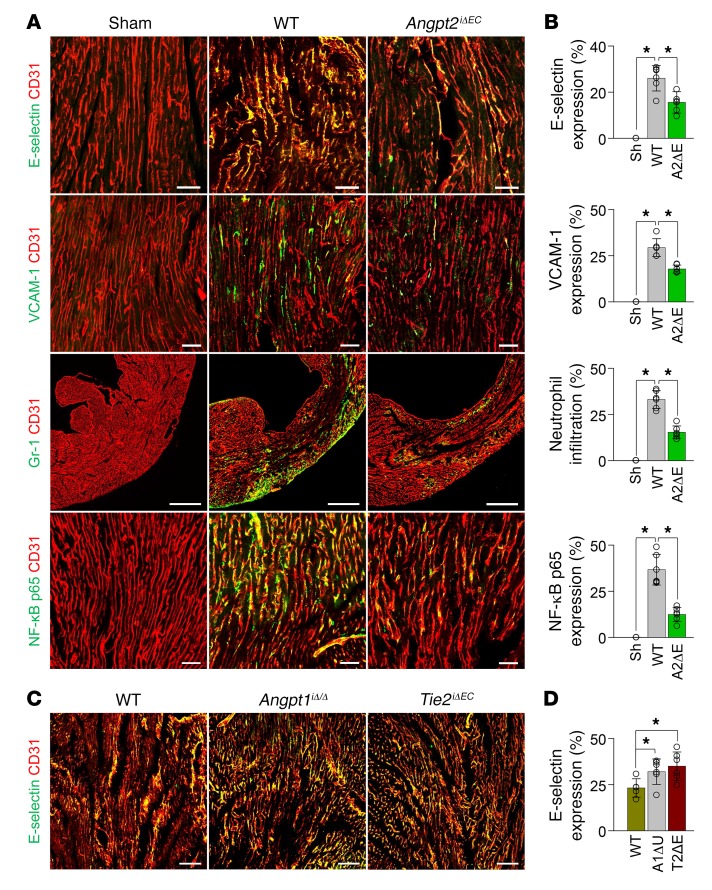
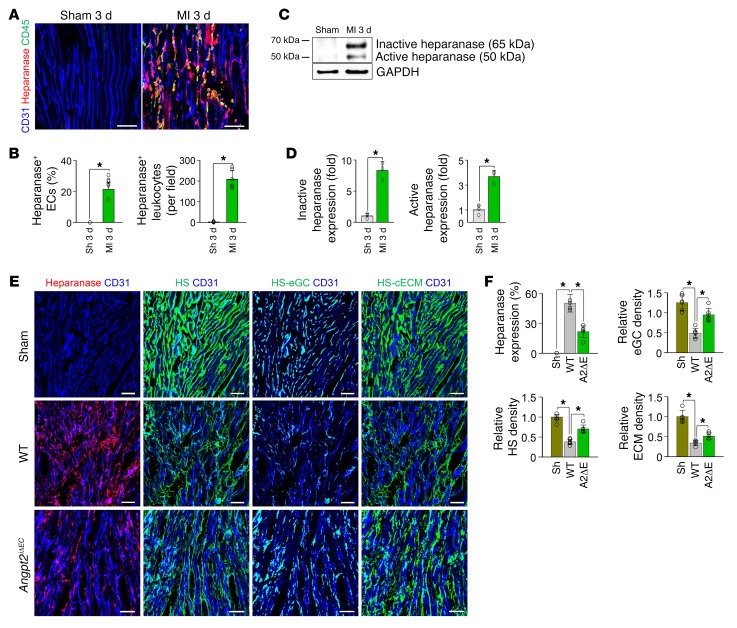
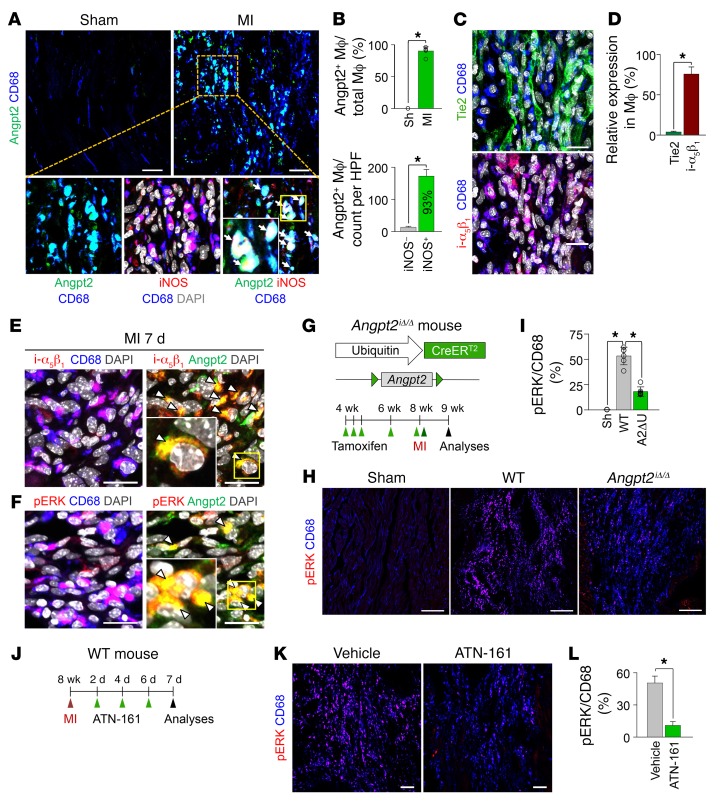
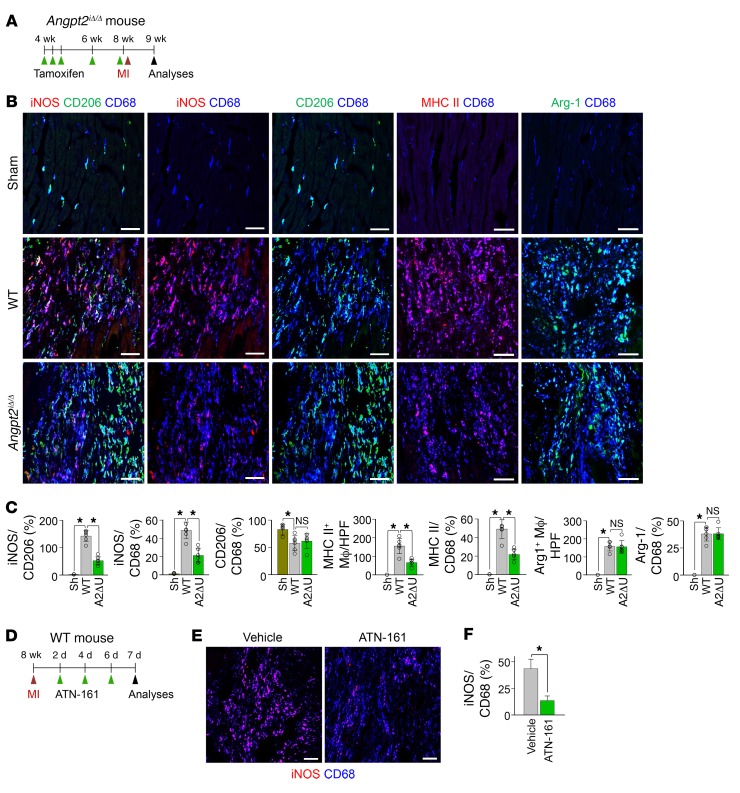
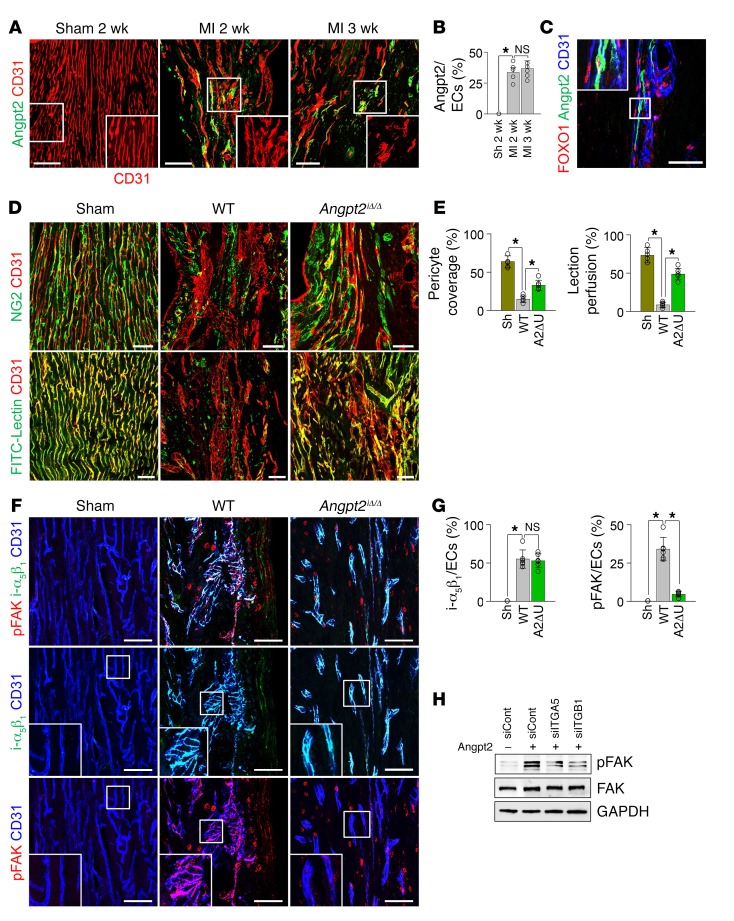
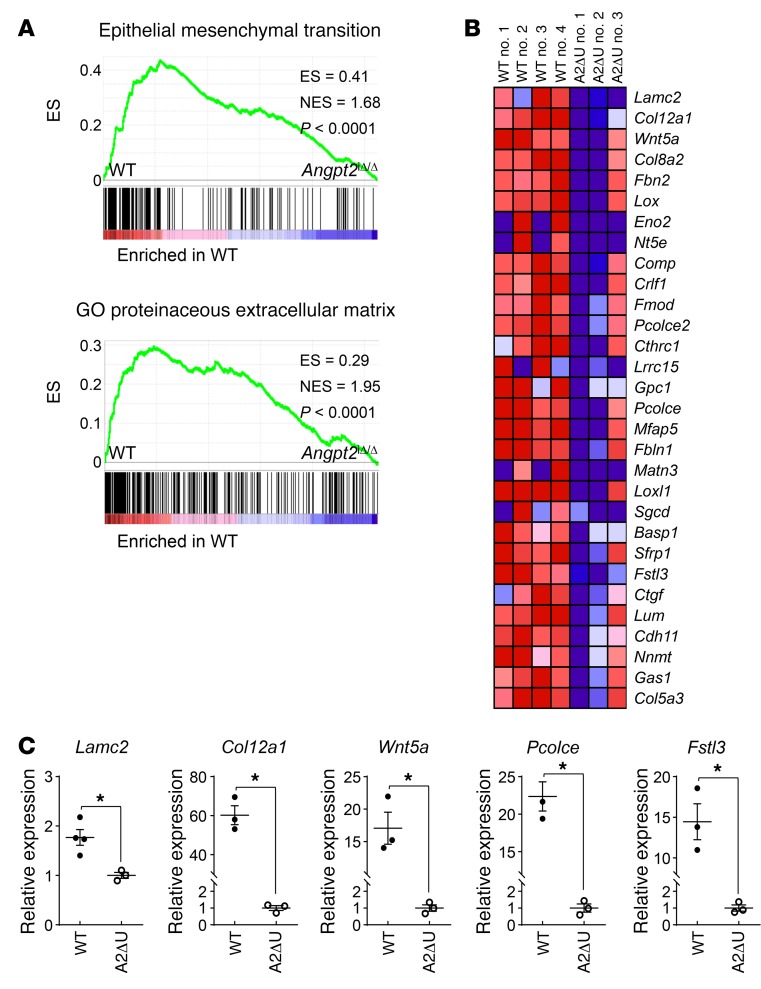
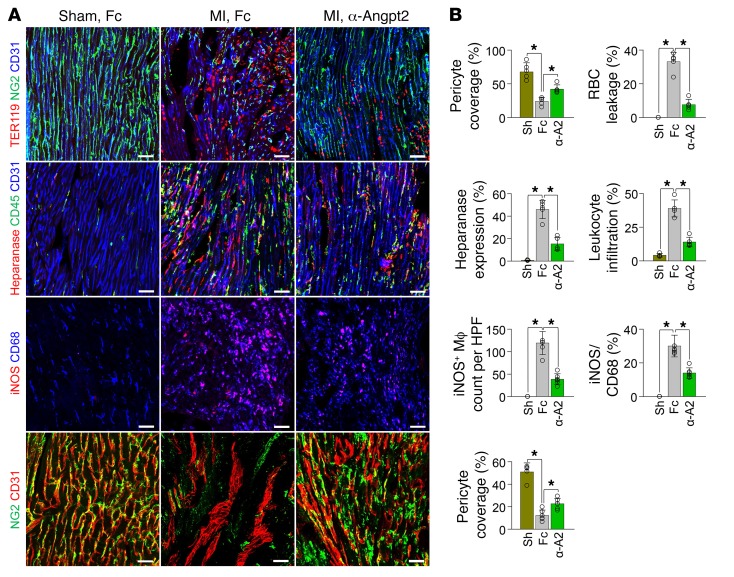
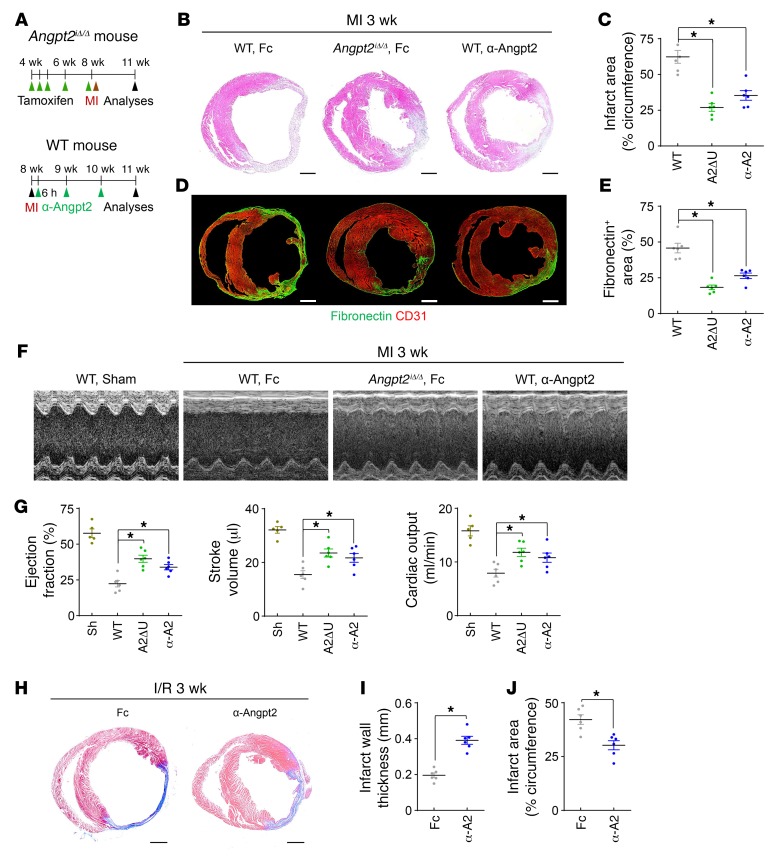
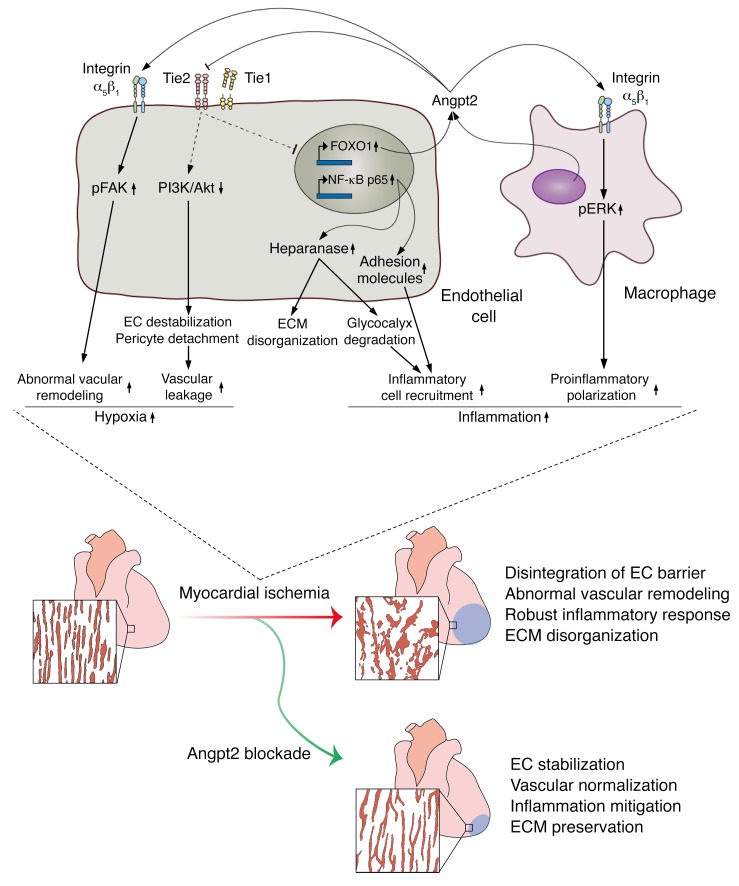
Emerging evidence indicates that angiopoietin-2 (Angpt2), a well-recognized vascular destabilizing factor, is a biomarker of poor outcome in ischemic heart disease. However, its precise role in postischemic cardiovascular remodeling is poorly understood. Here, we show that Angpt2 plays multifaceted roles in the exacerbation of cardiac hypoxia and inflammation after myocardial ischemia. Angpt2 was highly expressed in endothelial cells at the infarct border zone after myocardial infarction (MI) or ischemia/reperfusion injury in mice. In the acute phase of MI, endothelial-derived Angpt2 antagonized Angpt1/Tie2 signaling, which was greatly involved in pericyte detachment, vascular leakage, increased adhesion molecular expression, degradation of the glycocalyx and extracellular matrix, and enhanced neutrophil infiltration and hypoxia in the infarct border area. In the chronic remodeling phase after MI, endothelial- and macrophage-derived Angpt2 continuously promoted abnormal vascular remodeling and proinflammatory macrophage polarization through integrin α5β1 signaling, worsening cardiac hypoxia and inflammation. Accordingly, inhibition of Angpt2 either by gene deletion or using an anti-Angpt2 blocking antibody substantially alleviated these pathological findings and ameliorated postischemic cardiovascular remodeling. Blockade of Angpt2 thus has potential as a therapeutic option for ischemic heart failure.

Keywords: Cardiology; Cardiovascular disease; Pericytes; Vascular Biology; endothelial cells.


Conflict of interest statement

Conflict of interest: The authors have declared that no conflict of interest exists.

Figures

Figure 1
Figure 1. Angpt2 is highly expressed in ECs of the border zone after MI.
Adult WT mice were subject to MI or sham procedure (Sh), hearts were harvested at indicated time points, and indicated molecules in heart sections were detected by immunostaining. (A and B) Images for Angpt2 in ECs at the infarct border. Scale bars: 500 μm (A); 20 μm (B). (C and D) Temporal changes of Angpt2 in border zone ECs at indicated day after MI. n = 6, each time point. Each box region is magnified below. Scale bars: 100 μm. *P < 0.05 versus sham, Mann-Whitney U test. (E and F) Images and comparisons of Angpt2 expression in ECs at the infarct border of Angpt2-EGFP mice. Box region is magnified at right. n = 5, each group. Scale bars: 100 μm. *P < 0.05 versus sham, Mann-Whitney U test. Error bars represent mean ± SD.
Figure 2
Figure 2. Marked increase of FOXO1 governs Angpt2 expression in ECs of the infarct border after MI.
Adult WT or Foxo1iΔEC mice were subject to MI or sham procedure, hearts were harvested at indicated time points, and indicated molecules in heart sections were detected by immunostaining. CM borders are highlighted by wheat germ agglutinin (WGA) staining. (A) Temporal changes of expression and distribution of FOXO1 after MI. Note rapidly increased FOXO1 in CMs (blue asterisks) at day 1 after MI and prominent nuclear (white arrows) or nucleocytoplasmic (yellow arrowheads) localization of FOXO1 in ECs at day 2 after MI. Each box region is magnified in left corner. Scale bars: 50 μm. (B) Comparisons of relative FOXO1 expression in CMs and ECs after MI. n = 4–5, each time point. *P < 0.05 versus sham, Mann-Whitney U test. (C and D) Immunoblot and densitometric analyses of indicated proteins at the infarct border after MI. Note increased expression of FOXO1 after MI. n = 3, each group. *P < 0.05 versus sham, Mann-Whitney U test. (E) Images representing nuclear localization of FOXO1 in Angpt2+ border zone ECs (white arrowheads) at 3 days after MI. Scale bar: 20 μm. (F) Diagram depicting generation of Foxo1iΔEC mice and experiment schedule. (G and H) Images and comparisons of Angpt2 expression in the ECs of WT and Foxo1iΔEC (F1ΔE) mice. n = 5, each group. Scale bars: 50 μm. *P < 0.05 versus WT, Mann-Whitney U test. Error bars represent mean ± SD.
Figure 3
Figure 3. Angpt2 destabilizes endothelial integrity of ischemic heart by antagonizing Angpt1/Tie2 signaling.
Adult WT, Angpt1iΔ/Δ (A1ΔU), or Angpt2iΔEC (A2ΔE) mice were subjected to MI or sham procedure, and hearts were harvested at 3 days after MI. (A and B) Images and comparisons of Angpt1 expression in heart of Angpt1-GFP mice at 3 days after sham or MI procedure. Each region marked by a box demonstrating the expression of Angpt1 in myocardium is magnified in the right corner. Scale bars: 500 μm. n = 4–5. (C) Diagram depicting generation of Angpt1iΔ/Δ or Angpt2iΔEC mice and experiment schedule. (D and E) Immunofluorescence images and quantification show the decrease in pTie2 in border zone ECs after MI; pTie2 level was lower in Angpt1iΔ/Δ mice, but higher in Angpt2iΔEC mice compared with WT. Scale bars: 100 μm. n = 5–6, each time point. *P < 0.01, Kruskal-Wallis test followed by Mann-Whitney U test for post hoc pairwise comparisons. (F and G) Images and comparisons of NG2+ pericyte (PC) coverage on ECs at the border zone. Direction of arrow indicates the border zone closer to infarct area. Dashed lines distinguish PChi/Angpt2lo region from PClo/Angpt2hi region at the infarct border. PC coverage was compared between the ECs within high Angpt2 expression zone (A2hi) and low Angpt2 expression zone (A2lo). n = 4, each group. Scale bars: 100 μm. *P < 0.05 versus A2lo zone, Mann-Whitney U test. (H and I) Images and comparisons of NG2+ PC coverage onto ECs at the border zone. n = 5–6, each group. Scale bars: 50 μm. *P < 0.025, Kruskal-Wallis test followed by Mann-Whitney U test for post hoc pairwise comparisons (WT versus sham and WT versus Angpt2iΔEC). (J and K) Temporal changes of relative expression of Tie1 in the ECs of infarct border. n = 5–6, each time point. Scale bars: 50 μm. *P < 0.05 versus sham, Mann-Whitney U test. Error bars represent mean ± SD.
Figure 4
Figure 4. EC-specific depletion of Angpt2 mitigates vascular leakage and improves microvascular perfusion and tissue oxygenation in ischemic heart.
Adult WT, Angpt1iΔ/Δ, or Angpt2iΔEC mice were subject to MI or sham procedure, and hearts were harvested at 3 days after MI. (A and B) Images and comparisons of dextran leakage, FITC-lectin perfusion, and Hypoxyprobe+ hypoxic area. n = 5–6, each group. Scale bars: 50 μm. *P < 0.025, Kruskal-Wallis test followed by Mann-Whitney U test for post hoc pairwise comparisons. (C and D) Images and comparisons of TER119+ RBC leakage, and GLUT1+ hypoxic area. n = 5–6, each group. Scale bars: 200 μm. *P < 0.01, Kruskal-Wallis test followed by Mann-Whitney U test for post hoc pairwise comparisons. (E and F) Representative images of TTC-stained cross-sections at middle and apical portions of hearts. White area demarcated by dashed lines corresponds to infarcted region. Each infarcted area per total area in the middle section is compared. n = 7, each group. Scale bar: 500 μm. *P < 0.05 versus WT, Mann-Whitney U test. Error bars represent mean ± SD.
Figure 5
Figure 5. EC-specific depletion of Angpt2 ameliorates expressions of adhesion molecules and neutrophil infiltration in ischemic heart.
Adult WT, Angpt1iΔ/Δ, Angpt2iΔEC, or Tie2iΔEC (T2ΔE) mice were subject to MI or sham procedure, hearts were harvested at 3 days after MI, and indicated molecules in heart sections at the infarct border were detected by immunostaining. (A and B) Images and comparisons of E-selectin, VCAM-1, and NF-κB p65 on ECs and Gr-1+ neutrophil infiltration in the infarct border. n = 5–6, each group. Scale bars: 50 μm, except for Gr-1+ neutrophil infiltration (500 μm). (C and D) Images and comparisons of E-selectin expression on ECs at the infarct border. n = 5–6, each group. Scale bars: 100 μm. *P < 0.025, Kruskal-Wallis test followed by Mann-Whitney U test for post hoc pairwise comparisons. Error bars represent mean ± SD.
Figure 6
Figure 6. EC-specific depletion of Angpt2 mitigates degradation of eGC and ECM in ischemic heart.
Adult WT or Angpt2iΔEC mice were subject to MI or sham procedure, hearts were harvested at 3 days after MI, and indicated molecules in heart sections at the infarct border were detected by immunostaining. (A and B) Images and comparisons showing increased heparanase in ECs and infiltrating CD45+ leukocytes. n = 5–6, each group. Scale bars: 50 μm. *P < 0.05 versus sham, Mann-Whitney U test. (C and D) Immunoblot and densitometric analyses of heparanase expression and activation at the infarct border after MI. n=3, each group. *P < 0.05 versus sham, Mann-Whitney U test. (E and F) Images and comparisons of heparanase expression, HS-eGC density, and HS-cECM density. n = 5–6, each group. Scale bars: 50 μm. *P < 0.025, Kruskal-Wallis test followed by Mann-Whitney U test for post hoc pairwise comparisons. Error bars represent mean ± SD.
Figure 7
Figure 7. Angpt2/integrin α5β1 signaling is positively associated with pERK expression in macrophages in ischemic heart.
Adult WT or Angpt2iΔ/Δ (A2ΔU) mice were subject to MI or sham procedure, hearts were harvested at 7 days after MI, and indicated molecules in heart sections at the border zone were detected by immunostaining. (A and B) Images and comparisons of Angpt2 expression in CD68+ macrophages. Box region is magnified below. Note colocalization of Angpt2 and iNOS (white arrows). n = 5–6, each group. Scale bars: 50 μm. HPF, high-power field. *P < 0.05 by Mann-Whitney U test. (C and D) Images and comparisons of expression of Tie2 and integrin α5β1 (i-α5β1) in CD68+ macrophages. Scale bars: 20 μm. n = 4–5, each group. *P < 0.05 by Mann-Whitney U test. (E) Images showing colocalization of integrin α5β1 and Angpt2 in CD68+ macrophages (white arrowheads). Scale bars: 20 μm. (F) Images showing colocalization of pERK (at Thr202/Tyr 204) and Angpt2 in CD68+ macrophages (white arrowheads). Scale bars: 20 μm. (A, E, and F) Each area marked by a yellow box is magnified in the left bottom corner. (G) Diagram depicting generation of Angpt2iΔ/Δ mice and their experiment schedule. (H and I) Images and comparisons of pERK in CD68+ macrophages. n = 5–6, each group. Scale bars: 100 μm. *P < 0.025, Kruskal-Wallis test followed by Mann-Whitney U test for post hoc pairwise comparisons. (J) Diagram depicting the experiment schedule for integrin α5β1 inhibitor treatment (ATN-161, 30 mg/kg, intraperitoneal injection) after MI. (K and L) Images and comparisons of pERK in CD68+ macrophages. n = 4–5, each group. Scale bars: 100 μm. *P < 0.05, Mann-Whitney U test. Error bars represent mean ± SD.
Figure 8
Figure 8. Angpt2 plays a substantial role in proinflammatory macrophage polarization in ischemic heart.
Adult WT or Angpt2iΔ/Δ mice were subject to MI or sham procedure, hearts were harvested at 7 days after MI, and indicated molecules in heart sections at the infarct border were detected by immunostaining. (A) Diagram depicting generation of Angpt2iΔ/Δ mice and their experiment schedule. (B) Images of expression of iNOS, CD206, MHC II, and Arg-1 in CD68+ macrophages. Scale bars: 50 μm. (C) Comparisons of indicated parameters. n = 5–6, each group. *P < 0.025. Kruskal-Wallis test followed by Mann-Whitney U test for post hoc pairwise comparisons. Significance was adjusted for multiple comparisons using Bonferroni’s method. Error bars represent mean ± SD. (D) Diagram depicting the experiment schedule for integrin α5β1 inhibitor treatment (ATN-161, 30 mg/kg, intraperitoneal injection) after MI. (E and F) Images and comparisons of iNOS expression in CD68+ macrophages. n = 4–5, each group. Scale bars: 100 μm. *P < 0.05, Mann-Whitney U test. Error bars represent mean ± SD.
Figure 9
Figure 9. Angpt2 contributes to adverse vascular remodeling, thereby inhibiting effective microvascular perfusion in chronically ischemic heart.
Adult WT or Angpt2iΔ/Δ mice were subject to MI or sham procedure, hearts were harvested at 2 weeks after MI, and indicated molecules in heart sections at the infarct border were detected by immunostaining. (A and B) Images and comparisons of Angpt2 in ECs of remodeling vessels at the border zone. Each box region is magnified in right corner. Note high Angpt2 in the disintegrated ECs. n = 5, each group. Scale bars: 50 μm. (C) Images showing nuclear localization of FOXO1 in Angpt2+ ECs of the remodeling vessels. Boxed region is magnified in left corner. Scale bar: 50 μm. (D and E) Images and comparisons of NG2+ pericyte coverage and FITC-lectin perfusion in ECs. n = 5–6, each group. Scale bars: 50 μm. (F and G) Images and comparisons of i-α5β1 and FAK phosphorylation at Tyr397 (pFAK-Tyr 397) in ECs. Each boxed region is magnified in left corner. n = 5–6, each group. Scale bars: 50 μm. (H) Immunoblot images showing reduced Angpt2-induced FAK phosphorylation in HUVECs transfected with siRNAs for integrin α5 (siITGA5), integrin β1 (siITGB1), or scrambled control (siCont). (B, E, and G) Comparisons of indicated parameters. *P < 0.025, Kruskal-Wallis test followed by Mann-Whitney U test for post hoc pairwise comparisons. Significance was adjusted for multiple comparisons using Bonferroni’s method. Error bars represent mean ± SD.
Figure 10
Figure 10. Genetic depletion of Angpt2 mitigates expression of EndoMT-related genes.
Adult WT or Angpt2iΔ/Δ (A2ΔU) mice were subject to MI, and the infarct border zone ECs were freshly isolated at 2 weeks after MI. (A) GSEA of isolated ECs at the border zone showing downregulation of the genes of EMT signature and GO terms proteinaceous ECM in Angpt2iΔ/Δ mice compared with WT mice. ES, enrichment score. NES, normalized enrichment score. n = 3–4, each group. (B) Heatmap of EMT signature genes of ECs sorted from WT and Angpt2iΔ/Δ mice. (C) The relative expression level of each EndoMT-related gene was confirmed by quantitative PCR (n = 3, each group). *P < 0.05 versus WT, Mann-Whitney U test. Error bars represent mean ± SD.
Figure 11
Figure 11. Therapeutic inhibition of Angpt2 prevents vascular disintegration, permeability, inflammation, adverse remodeling, and proinflammatory macrophage polarization after MI.
Fc or α-Angpt2 (α-A2) (20 mg/kg, intraperitoneally) was administered to WT mice at 6 hours after MI or sham procedure, followed by repeated injection of the same dose at 1 week intervals. (A and B) Images and comparisons of NG2+ pericyte coverage, TER119+ RBC leakage, heparanase expression, CD45+ leukocytes infiltration at 3 days after, iNOS+ macrophage count and proportion at 7 days after, and NG2+ pericyte coverage at 14 days after MI. n = 5–6, each group. Scale bars: 50 μm. *P < 0.025, Kruskal-Wallis test followed by Mann-Whitney U test for post hoc pairwise comparisons. Error bars represent mean ± SD.
Figure 12
Figure 12. Genetic deletion or blocking antibody of Angpt2 ameliorates infarct size and adverse cardiac remodeling after myocardial ischemia.
Adult WT or Angpt2iΔ/Δ mice were subject to MI, I/R, or sham procedure, and hearts were analyzed at 3 weeks after the procedure. (A) Diagram depicting preparation of animals and experimental schedules. Fc or α-Angpt2 (20 mg/kg, intraperitoneally) was administered to WT or Angpt2iΔ/Δ mice at 6 hours after MI, followed by repeated injections of the same dose at 1-week intervals. (B and C) Images and comparisons of infarction area. n = 5–6, each group. Scale bars: 1 mm. (D and E) Images and comparisons of cardiac fibrosis represented by fibronectin+ area. n = 6, each group. Scale bars: 1 mm. (F and G) Images and comparisons of cardiac systolic function evaluated by echocardiography. n = 6, each group. (C, E, and G) Comparisons of indicated parameters. *P < 0.025, Kruskal-Wallis test followed by Mann-Whitney U test for post hoc pairwise comparisons. Significance was adjusted for multiple comparisons using Bonferroni’s method. (HJ) Fc or α-Angpt2 (20 mg/kg, intraperitoneally) was administered to WT mice at 6 hours after I/R, followed by repeated injections of the same dose at 1 week intervals. Images of cardiac fibrosis determined by Masson trichrome stain and comparisons of indicated parameters. n = 6, each group. Scale bars: 1 mm. *P < 0.05 versus WT, Mann-Whitney U test. Error bars represent mean ± SD.
Figure 13
Figure 13. Schematic diagram depicting the roles of Angpt2 in exacerbating cardiac hypoxia and inflammation after myocardial ischemia.
Myocardial ischemia induces disintegration of endothelial barrier, abnormal vascular remodeling, robust inflammatory responses, and ECM disorganization, and these pathological changes can be effectively mitigated by Angpt2 blockade. Mechanistically, in ECs, the increase in Angpt2 expression is directly regulated by FOXO1, which antagonizes Tie2 signaling and consequently attenuates PI3K/Akt signaling and enhances NF-κB p65 and FOXO1 expression. Thus, increased FOXO1 transcriptional activity forms a positive feedback loop with Angpt2 and exerts a sustained effect on ECs, leading to destabilization and remodeling. Pericyte detachment and EC destabilization presumably due to attenuated PI3K/Akt signaling exacerbate vascular leakage. Enhanced activity of NF-κB p65 augments endothelial expression of heparanase and adhesion molecules, further promoting inflammatory cell recruitment and ECM disorganization. In addition, Angpt2/integrin α5β1 signaling promotes abnormal vascular remodeling through FAK phosphorylation, resulting in chronic hypoxia. In macrophages, the Angpt2/integrin α5β1/ERK–signaling pathway plays an important role in proinflammatory macrophage polarization in autocrine and paracrine manners. These exacerbating roles of Angpt2 in cardiac hypoxia and inflammation after myocardial ischemia eventually trigger deterioration of cardiac structure and function, leading to heart failure.

References

    1. World Health Organization. The top 10 causes of death. http://www.who.int/mediacentre/factsheets/fs310/en/ WHO website. Published May 24, 2018. Accessed September 25, 2018.
    1. Braunwald E. The war against heart failure: the Lancet lecture. Lancet. 2015;385(9970):812–824. doi: 10.1016/S0140-6736(14)61889-4. - DOI - PubMed
    1. Sano M, et al. p53-induced inhibition of Hif-1 causes cardiac dysfunction during pressure overload. Nature. 2007;446(7134):444–448. doi: 10.1038/nature05602. - DOI - PubMed
    1. Taimeh Z, Loughran J, Birks EJ, Bolli R. Vascular endothelial growth factor in heart failure. Nat Rev Cardiol. 2013;10(9):519–530. doi: 10.1038/nrcardio.2013.94. - DOI - PubMed
    1. Ylä-Herttuala S, Rissanen TT, Vajanto I, Hartikainen J. Vascular endothelial growth factors: biology and current status of clinical applications in cardiovascular medicine. J Am Coll Cardiol. 2007;49(10):1015–1026. doi: 10.1016/j.jacc.2006.09.053. - DOI - PubMed

Publication types

MeSH terms