. 2018 Nov 1;128(11):4997-5007.
doi: 10.1172/JCI93090. Epub 2018 Oct 8.

Macrophage migration inhibitory factor mediates metabolic dysfunction induced by atypical antipsychotic therapy

Affiliations

Macrophage migration inhibitory factor mediates metabolic dysfunction induced by atypical antipsychotic therapy

Donghong Cui et al. J Clin Invest. .

Abstract

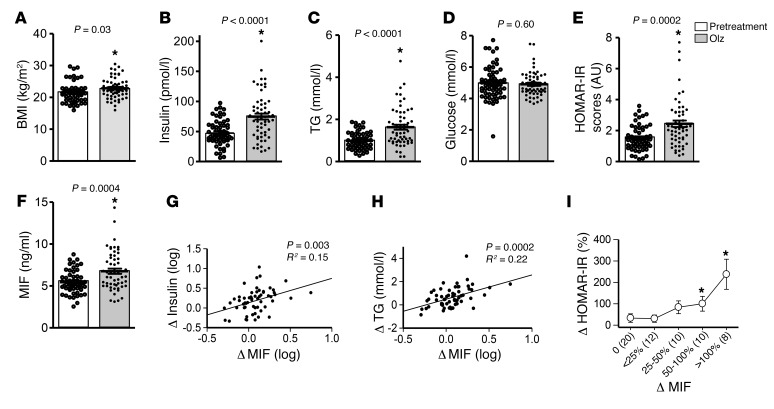
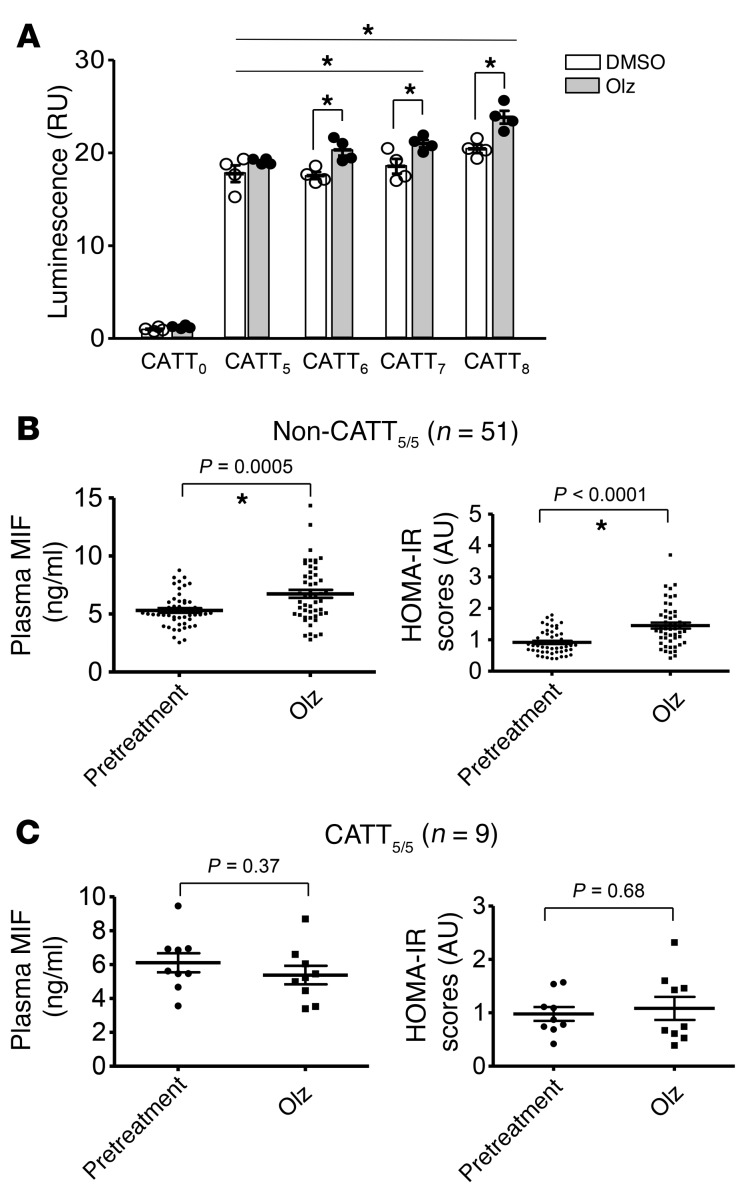
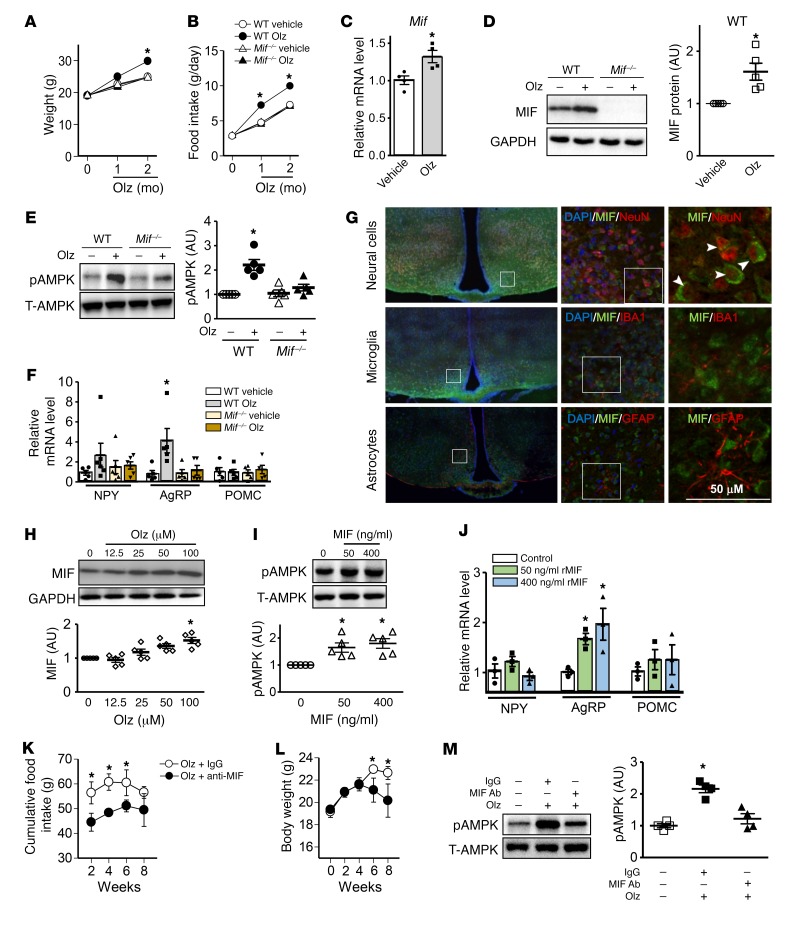
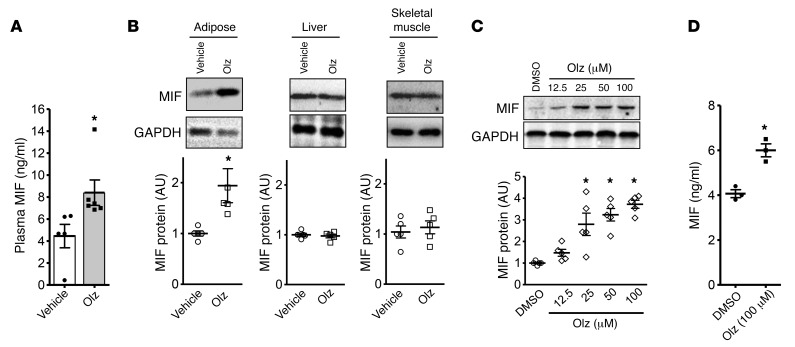
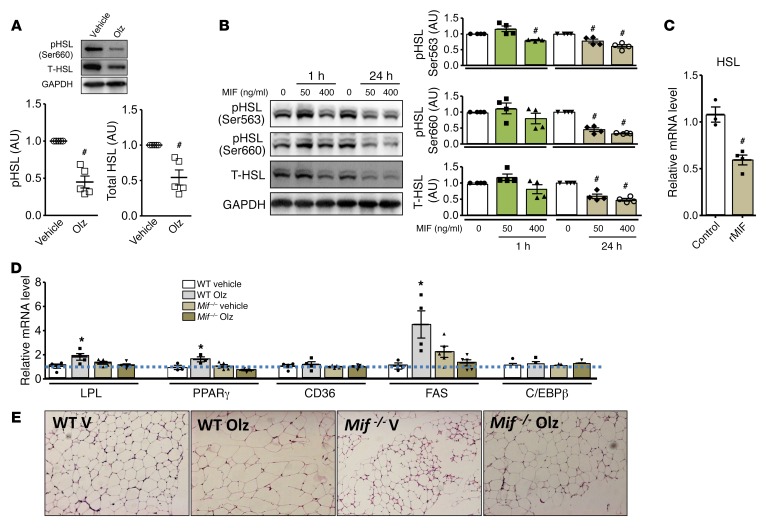
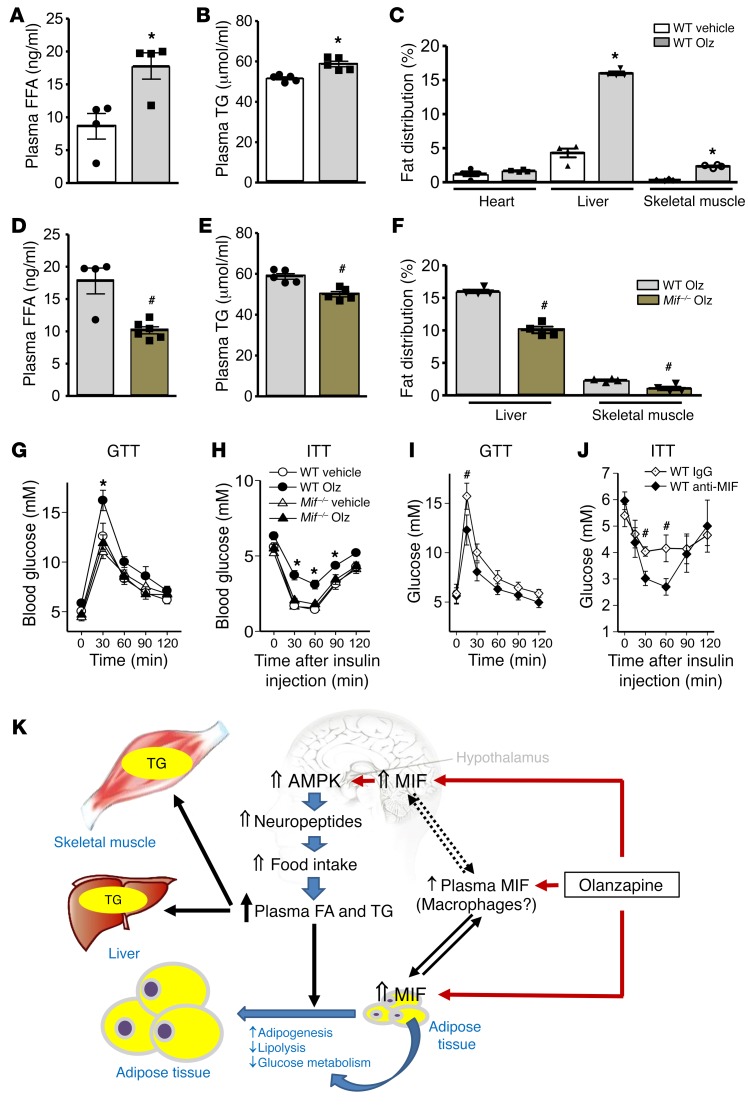
Atypical antipsychotics are highly effective antischizophrenic medications but their clinical utility is limited by adverse metabolic sequelae. We investigated whether upregulation of macrophage migration inhibitory factor (MIF) underlies the insulin resistance that develops during treatment with the most commonly prescribed atypical antipsychotic, olanzapine. Olanzapine monotherapy increased BMI and circulating insulin, triglyceride, and MIF concentrations in drug-naive schizophrenic patients with normal MIF expression, but not in genotypic low MIF expressers. Olanzapine administration to mice increased their food intake and hypothalamic MIF expression, which led to activation of the appetite-related AMP-activated protein kinase and Agouti-related protein pathway. Olanzapine also upregulated MIF expression in adipose tissue, which reduced lipolysis and increased lipogenic pathways. Increased plasma lipid concentrations were associated with abnormal fat deposition in liver and skeletal muscle, which are important determinants of insulin resistance. Global MIF-gene deletion protected mice from olanzapine-induced insulin resistance, as did intracerebroventricular injection of neutralizing anti-MIF antibody, supporting the role of increased hypothalamic MIF expression in metabolic dysfunction. These findings uphold the potential pharmacogenomic value of MIF genotype determination and suggest that MIF may be a tractable target for reducing the metabolic side effects of atypical antipsychotic therapy.

Keywords: Metabolism; Schizophrenia.


Conflict of interest statement

Conflict of interest: Yale University holds rights to patents that describe the potential utility of MIF inhibition and MIF genotype determination. RB has applied for a patent related to MIF modulators (9540322). RB and LL have applied for a patent related to the method of inhibiting binding or activity of MIF by administering a MIF antagonist (9221903). RB has applied for a patent related to MIF promoter polymorphism in inflammatory disease (9139877).

Figures

Figure 1
Figure 1. MIF is associated with the development of metabolic dysfunction in first-episode schizophrenia patients following olanzapine treatment.
Sixty first-episode patients with schizophrenia were studied for (A) BMI, (B) insulin, (C) triglyceride (TG), (D) glucose, and (F) plasma MIF before and after olanzapine monotherapy. HOMA-IR scores (E) were determined on the basis of plasma insulin and glucose values. The changes in MIF correlated with alterations in insulin (G), TG (H), and HOMA-IR scores (I) following olanzapine. Student’s t test (AF), Pearson correlation (G, H), and 1-way ANOVA plus Tukey’s test (I) were used for data analysis. All t tests were 2-tailed. Mean ± SD.*P < 0.05 versus pretreatment.
Figure 2
Figure 2. MIF promoter activity is regulated in a –794 CATT length-dependent manner and is associated with olanzapine treatment–related alterations in plasma MIF levels and insulin resistance.
(A) HeLa cells cotransfected with MIF promoter-luciferase reporter plasmids bearing 0, 5, 6, 7, or 8 CATT repeats were treated with olanzapine (Olz, 5 mM) or vehicle (DMSO) for 18 hours and MIF promoter activity was determined by luciferase activity relative to a cotransfected pRL-β actin vector. In the schizophrenic patients (n = 60), plasma MIF levels and HOMA-IR scores were measured before and after 2 months of olanzapine treatment. DNA was extracted from whole-blood samples and the MIF gene was sequenced for determination of –794 CATT5–8 polymorphism (rs5844572). Mean ± SD; *P < 0.05. (B) High-expression –794 non-CATT5/5 (non-CATT5/5) genotypes (n = 51) are associated with posttreatment increases in plasma MIF levels and HOMA-IR scores. (C) The low-expression –794 CATT5/5 genotype (CATT5/5) (n = 9) is associated with protection from metabolic dysfunction. One-way ANOVA plus Tukey’s test or 2-tailed Student’s t test was performed for the data analysis. Mean ± SD; *P < 0.05 versus pretreatment.
Figure 3
Figure 3. MIF modulates food intake and obesity by activating AMPK in the hypothalamus following olanzapine treatment.
WT and MIF knockout (Mif–/–) C57BL/6 mice were administered vehicle or 3 mg/kg olanzapine per day for 2 months. (A) Body weight and (B) food intake were monitored. Quantification of (C) MIF transcript levels by qPCR, (D) MIF protein, and (E) AMPK levels (pAMPK: Thr172 phosphorylated AMPK; T-AMPK: total AMPK) in homogenates of murine hypothalamic tissue after 2 months of treatment. (F) Transcript levels of NPY, AgRP, and POMC measured by qPCR in hypothalamic homogenates from mice treated with or without olanzapine for 2 months. Immunostaining was performed in the hypothalamus from WT mice. The staining for neural cells (NeuN, top panels), microglia (IBA1, middle panels), and astrocytes (GFAP, bottom panels) is red, while the staining for MIF is green (G). Arrow and arrowheads represent costaining of MIF and NeuN in neural cells. Isolated hypothalamic cells were treated with increasing concentrations of olanzapine for 24 hours, after which (H) MIF protein content was measured by Western blot. (I) Total and phospho-AMPK levels in isolated hypothalamic cells were evaluated following 24-hour MIF stimulation in vitro. (J) NPY, AgRP, and POMC gene expression measured in hypothalamic cells following 24 hours of MIF treatment. IgG or anti–MIF monoclonal antibody (2 μg/day) was administered i.c.v. by an osmotic pump to WT mice treated with olanzapine for 2 months. The cumulative food intake (K) and body weight gain (L) were subsequently evaluated. The hypothalamic tissues were collected for AMPK measurements (M). The pAMPK and T-AMPK Western blots are from parallel gels run contemporaneously on identical samples. For each animal group, n = 4–6. A, B, K, and L were analyzed by multivariate (2-way) ANOVA and the rest of the data were analyzed by 2-tailed Student’s t test or 1-way ANOVA. Mean ± SE in A, B, K, and L; mean ± SD in other panels; *P < 0.05 versus vehicle in CF, versus other groups in A and B, versus control in HJ, versus IgG group in KM. Olz: olanzapine.
Figure 4
Figure 4. Olanzapine increases plasma MIF levels and MIF expression in adipose tissue.
WT and MIF knockout (Mif–/–) C57BL/6 mice were administered vehicle or 3 mg/kg olanzapine per day for 2 months. Plasma MIF concentrations in WT mice with or without olanzapine treatment were measured by ELISA (A). Adipose, liver, and skeletal muscle tissues were subsequently isolated and (B) tissue MIF content was evaluated by Western blot. Olanzapine stimulation for 24 hours induced a dose-dependent increase in intracellular MIF protein levels in fully differentiated 3T3-L1 adipocytes (C) and induced MIF release into conditioned medium (D) (DMSO was employed as vehicle). Values are mean ± SD. A 2-tailed Student’s t test was used for data analysis in A, B, and D and 1-way ANOVA followed by Tukey’s test was used in C. Mean ± SD; *P < 0.05 versus vehicle or control in A, B, and C, and versus DMSO in D. For each animal group, n = 4–5 in A and B; n = 5 in C, and n = 3 in D.
Figure 5
Figure 5. MIF downregulates lipolysis and upregulates adipogenesis following olanzapine treatment.
WT mice were treated with olanzapine (Olz, 3 mg/kg) or vehicle control for 2 months, and adipose tissue was isolated for the measurement of hormone-sensitive lipase (HSL) activation (A) by Western blotting. MIF (50 ng/ml and 400 ng/ml for 1 to 24 hours of treatment) was added to cultured 3T3-L1 adipocytes and (B) phospho- and total-HSL evaluated by Western blot, and (C) HSL mRNA by qPCR (400 ng/ml MIF). The GAPDH Western blot shown in B is from a parallel gel run contemporaneously on identical samples. (D) Adipose transcript levels of lipoprotein lipase (LPL), PPARγ, CD36, and fatty acid synthase (FAS) were quantified by qPCR in WT or Mif–/– mice treated for 2 months with olanzapine or vehicle. (E) H&E staining of representative adipose tissue sections (n = 5 examined per experimental group) was performed to evaluate adipocyte hypertrophy in WT and Mif–/– mice following 2 months of treatment with olanzapine (Olz) or vehicle (V). Original magnification, ×40. A 2-tailed Student’s t test or 1-way ANOVA plus Tukey’s test was used for statistical analysis. Mean ± SD; *P < 0.05 shows an increase versus vehicle or control; #P < 0.05 shows a reduction versus vehicle or control; n = 4–5 for each animal group.
Figure 6
Figure 6. MIF regulates abnormal lipid storage in liver and skeletal muscle, which may contribute to the occurrence of whole-body insulin resistance.
(A) Plasma free fatty acid (FFA) and (B) triglyceride (TG) levels were measured in blood samples collected from vehicle- or olanzapine-treated WT mice. (C) Fat distribution in heart, liver, and skeletal muscle was quantified in mice by MRI scanning using the T2*-IDEAL water-fat decomposition method (1). Plasma FFA (D) and TG (E) levels were quantified in olanzapine-treated WT and Mif–/– mice. Panel F shows the comparison of fat distribution in liver and skeletal muscle between WT and Mif–/– mice following 2 months of olanzapine treatment. In a separate experiment, intraperitoneal glucose tolerance (G) and insulin tolerance (H) tests (GTT, ITT) were performed following 2 months of olanzapine treatment in WT or Mif–/– mice. Glucose and insulin tolerance tests (I, J) in mice that received IgG or anti–MIF monoclonal antibody (2 μg/day) i.c.v. by an osmotic pump, accompanied with olanzapine for 2 months as in Figure 3, I and J. Mean ± SE shown in GI; mean ± SD in the other panels. *P < 0.05 versus vehicle in AC; #P < 0.05 versus WT Olz in DF; *P < 0.05 versus other groups in G and H; #P < 0.05 versus IgG group in I and J. Data in AF were analyzed by Student’s t test and GJ were analyzed by multivariate ANOVA. For each animal group, n = 4–5. Olz: olanzapine; Anti-MIF: anti–MIF antibody. (K) Schematic diagram for a proposed mechanism of olanzapine-induced metabolic dysfunction. Olanzapine induces MIF expression in the hypothalamus, which upregulates AMPK phosphorylation and food intake. In peripheral tissues, olanzapine stimulates MIF expression and release from adipose tissue, which may contribute to circulating levels of MIF. In adipose tissue, MIF also mediates glucose metabolism, adipogenesis, and adipolysis, leading to adiposity. Hyperlipidemia contributes to increased TG storage in liver and skeletal muscle, leading to insulin resistance in peripheral tissues.

Similar articles

Cited by

References

    1. Muench J, Hamer AM. Adverse effects of antipsychotic medications. Am Fam Physician. 2010;81(5):617–622. - PubMed
    1. Newcomer JW. Second-generation (atypical) antipsychotics and metabolic effects: a comprehensive literature review. CNS Drugs. 2005;19(Suppl 1):1–93. - PubMed
    1. Domecq JP, et al. Clinical review: Drugs commonly associated with weight change: a systematic review and meta-analysis. J Clin Endocrinol Metab. 2015;100(2):363–370. doi: 10.1210/jc.2014-3421. - DOI - PMC - PubMed
    1. Albaugh VL, Singareddy R, Mauger D, Lynch CJ. A double blind, placebo-controlled, randomized crossover study of the acute metabolic effects of olanzapine in healthy volunteers. PLoS ONE. 2011;6(8):e22662. doi: 10.1371/journal.pone.0022662. - DOI - PMC - PubMed
    1. Chintoh AF, Mann SW, Lam TK, Giacca A, Remington G. Insulin resistance following continuous, chronic olanzapine treatment: an animal model. Schizophr Res. 2008;104(1–3):23–30. - PubMed

Publication types

MeSH terms