. 2018 Sep 14;69(20):4867-4880.
doi: 10.1093/jxb/ery284.

A SOC1-like gene MtSOC1a promotes flowering and primary stem elongation in Medicago

Affiliations

A SOC1-like gene MtSOC1a promotes flowering and primary stem elongation in Medicago

Mauren Jaudal et al. J Exp Bot. .

Abstract

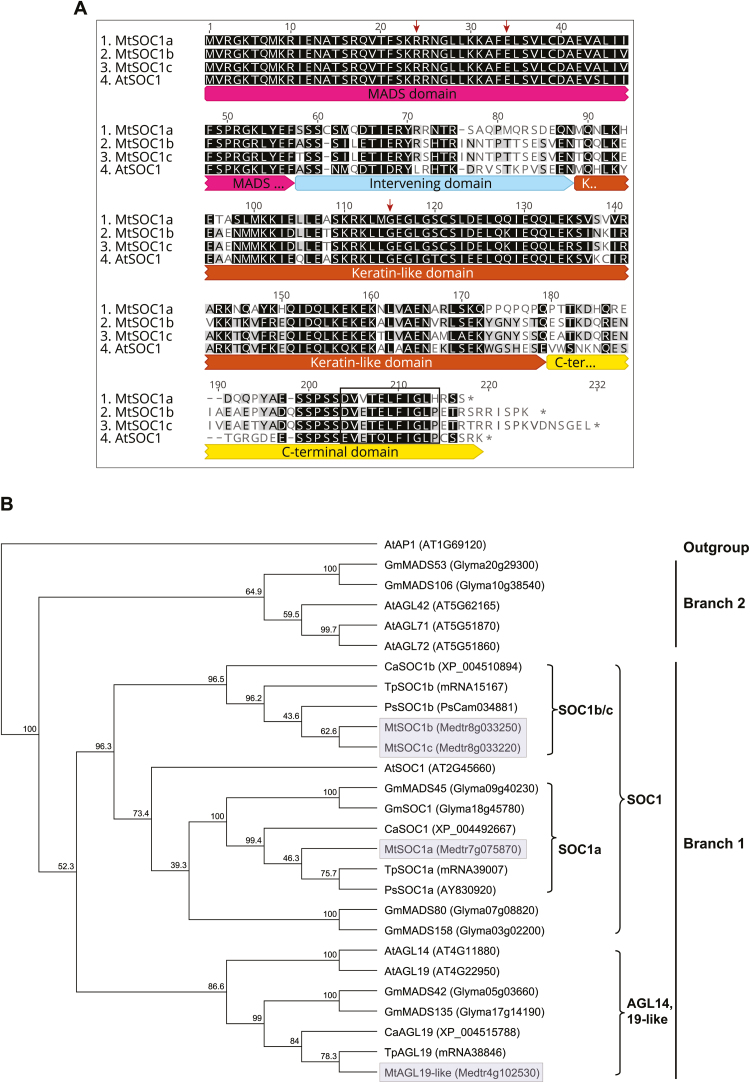
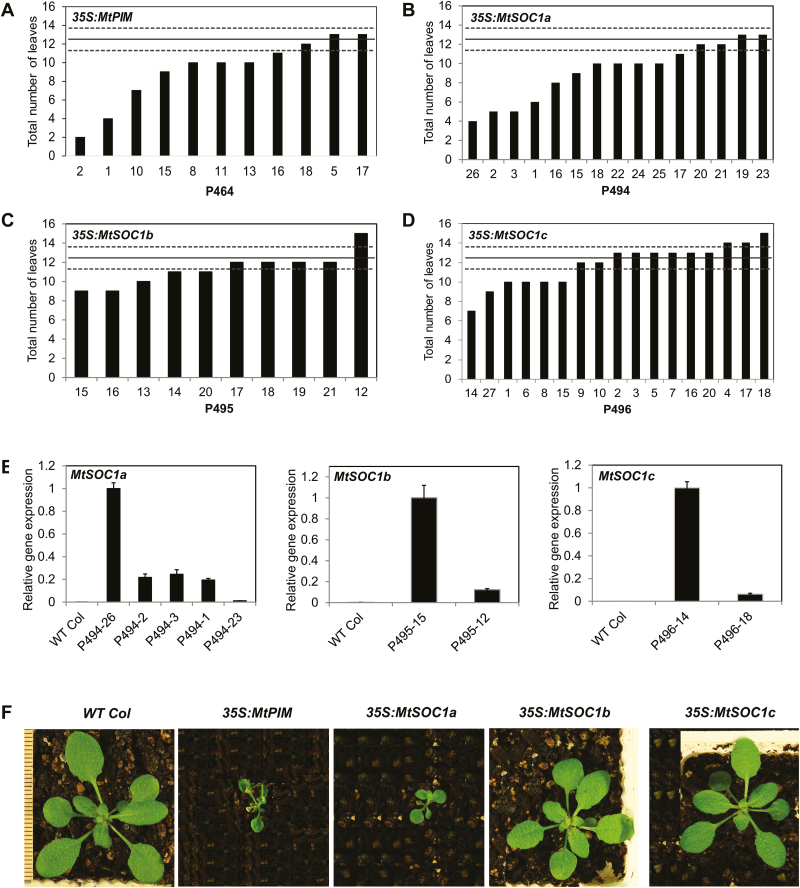
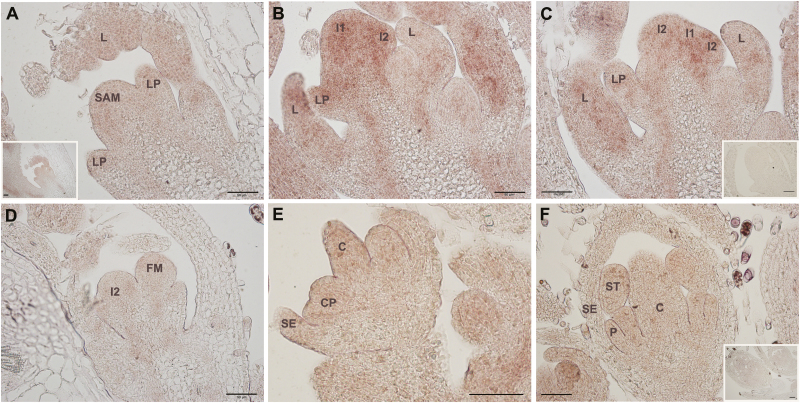
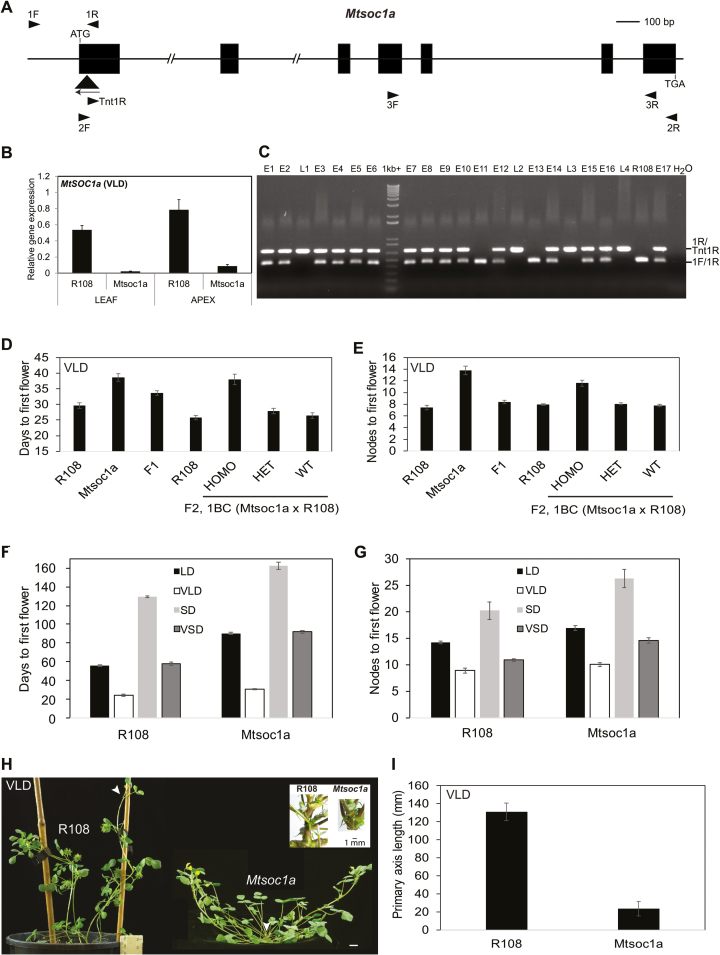
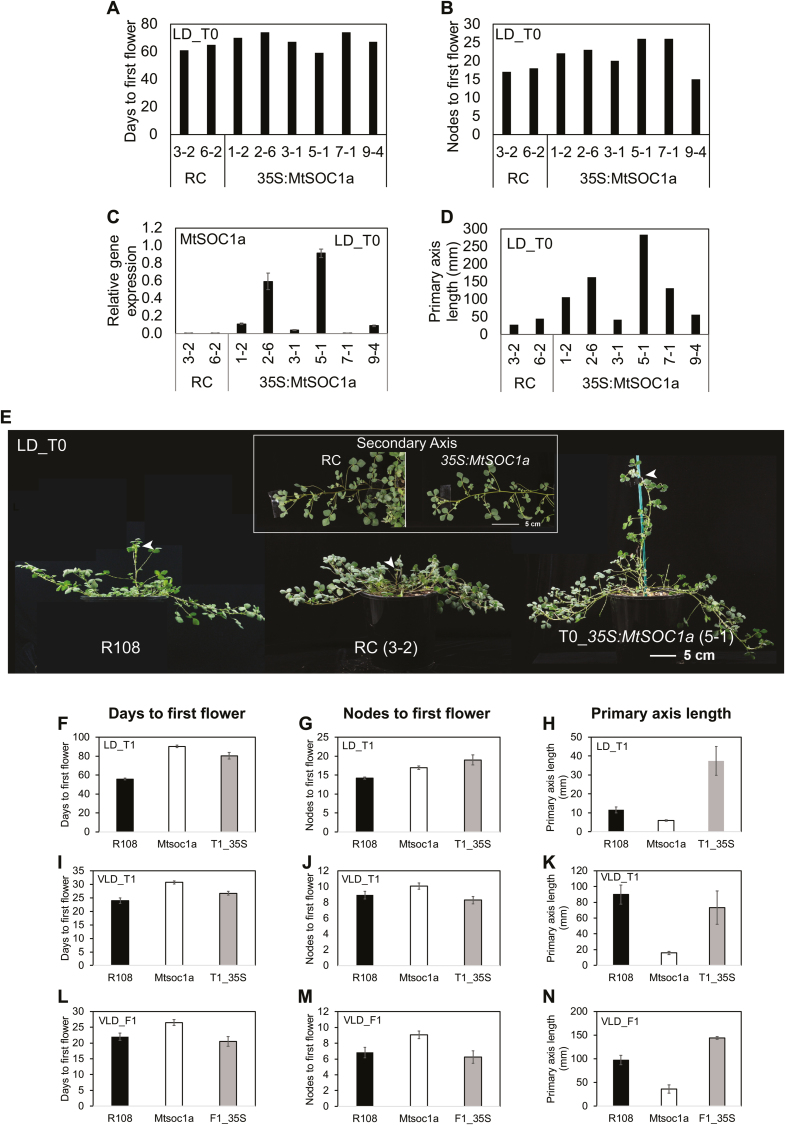
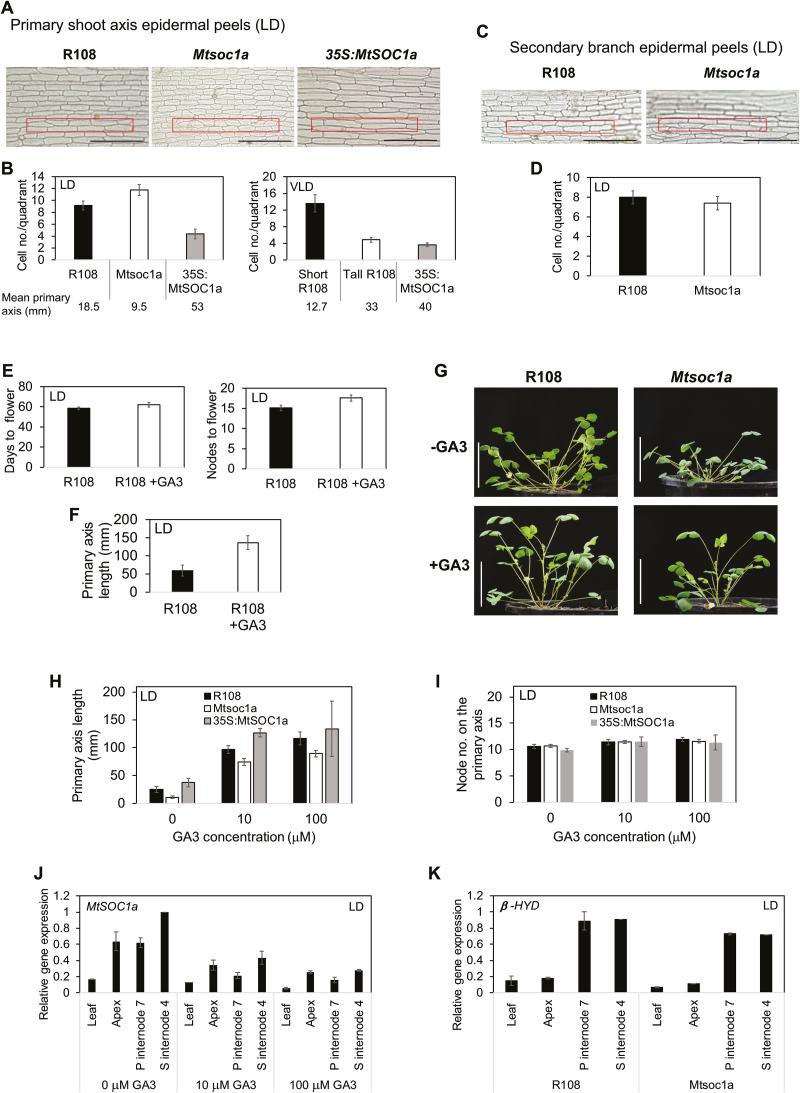
Medicago flowering, like that of Arabidopsis, is promoted by vernalization and long days, but alternative mechanisms are predicted because Medicago lacks the key regulators CO and FLC. Three Medicago SOC1-like genes, including MtSOC1a, were previously implicated in flowering control, but no legume soc1 mutants with altered flowering were reported. Here, reverse transciption-quantitative PCR (RT-qPCR) indicated that the timing and magnitude of MtSOC1a expression was regulated by the flowering promoter FTa1, while in situ hybridization indicated that MtSOC1a expression increased in the shoot apical meristem during the floral transition. A Mtsoc1a mutant showed delayed flowering and short primary stems. Overexpression of MtSOC1a partially rescued the flowering of Mtsoc1a, but caused a dramatic increase in primary stem height, well before the transition to flowering. Internode cell length correlated with stem height, indicating that MtSOC1a promotes cell elongation in the primary stem. However, application of gibberellin (GA3) caused stem elongation in both the wild type and Mtsoc1a, indicating that the mutant was not defective in gibberellin responsiveness. These results indicate that MtSOC1a may function as a floral integrator gene and promotes primary stem elongation. Overall, this study suggests that apart from some conservation with the Arabidopsis flowering network, MtSOC1a has a novel role in regulating aspects of shoot architecture.


Figures

Fig. 1.
Fig. 1.
Alignment and phylogenetic analysis of MtSOC1-like proteins. (A) Protein sequence alignment of AtSOC1, MtSOC1a, MtSOC1b, and MtSOC1c indicating the conserved MADS (M), intervening (I), and Keratin-like (K) domains of the MIKC MADS box proteins. The SOC1 motif (EVETQLFIGLP) (Ding et al., 2013) is boxed and the three functional residues identified by previous functional analysis of AtSOC1 (Wang et al., 2015) are marked with arrows. Identical and similar residues are highlighted in black. (B) A consensus phylogenetic tree based on the MIK domains of TM3 members from Arabidopsis, soybean, and the temperate legumes, Medicago, pea, chick pea, and red clover rooted on Arabidopsis APETALA1 (AtAP1). The tree was generated using the Neighbor–Joining (NJ) method via bootstrap resampling with a support threshold of 39%. The numbers indicate the bootstrap values based on 1000 replicates. The branch numbering is from Dorca-Fornell et al. (2011). The four Medicago proteins are highlighted in grey. At, Arabidopsis thaliana; Ca, Cicer arietinum (chick pea); Gm, Glycine max (soybean); Mt, Medicago truncatula; Ps, Pisum sativum (pea); Tp, Trifolium pratense (red clover).
Fig. 2.
Fig. 2.
Flowering time and gene expression analyses of transgenic Arabidopsis plants with 35S:MtPIM and 35S:MtSOC1 transgenes in long-day (LD) conditions. (A–D) Graphs showing the flowering time in LDs of transgenic T1 Col plants transformed with 35S:MtPIM (A), 35S:MtSOC1a (B), 35S:MtSOC1b (C), and 35S:MtSOC1c (D). Flowering time was measured as the total number of rosette and cauline leaves at flowering. The solid line represents the average flowering time of Arabidopsis wild-type Columbia, 12.5 ± 1.10 (t.SE) leaves (0.05) (dashed lines). (E) Gene expression of MtSOC1a, MtSOC1b, and MtSOC1c in representative T1 transgenic 35S:MtSOC1 Arabidopsis plants shown in (B–D) as compared with wild-type Col plants. Gene expression was determined in selected T1 plants with a range of flowering times using RT–qPCR and normalized to At2g32170. The data are shown as the mean ±SE of three PCR technical replicates. Data are presented relative to the plant with the highest transgene expression for each overexpression construct. (F) Photographs at the time of flowering of wild-type Col plants, a T1 plant from 35S:MtPIM (P464-2), and representative T2 progeny from 35S:MtSOC1a (P494-3), 35S:MtSOC1b (P495-16), and 35S:MtSOC1c (P496-27). The scale bar has lines 1 mm apart.
Fig. 3.
Fig. 3.
In situ localization of MtSOC1a transcripts through the floral transition in longitudinal sections of wild-type R108 plants grown in LDs, after 1 week of vernalization. (A) Vegetative shoot apical meristem (SAM) with leaf primordium (LP) and leaf (L). The inset shows the same section at a lower magnification. (B and C) SAM at the initial reproductive stage. Increased transcript abundance was detected in SAM, L, LP, and primary (I1) and secondary (I2) inflorescence meristems. (D–F) Weak MtSOC1a expression was detected during early stages of floral meristem development (D), during differentiation of floral organs (E), and in young flower buds (F). No expression was detected using a sense control MtSOC1a probe (inset images in C and F). C, carpel; CP, common primordium for petal and stamen; P, petal; SE, sepal; ST, stamen. The black scale bar represents 50 µm.
Fig. 4.
Fig. 4.
Mtsoc1a mutants have a recessive late flowering phenotype and reduced elongation of the primary stem. (A) Diagram of the MtSOC1a gene with the Tnt1 insertion (black triangle) in the Mtsoc1a mutant. Exons are the black boxes and introns are thin lines. Arrowheads indicate primers. (B) Relative expression of MtSOC1a in 14-day-old R108 and Mtsoc1a seedlings in VLDs. Gene expression was determined using RT–qPCR with 3F and 3R primers, and the data are the mean ±SE of three biological replicates, normalized to Medicago PP2A. Data are presented relative to the highest value. Tissues were harvested 2 h after dawn. (C) Photograph showing PCR genotyping fragments from segregating VLD F2 plants. Plants were scored as early (E) (like R108) or late (L) flowering relative to R108. Three genotyping primers were pooled in the PCR. (D and E) Graphs showing the flowering time in vernalized LDs (VLDs) scored as the number of days to flowering (D) or the number of nodes on the primary axis at flowering (E) of the F1 progeny (n=14) from a backcross of Mtsoc1a mutants to wild-type R108 plants compared with Mtsoc1a mutants (self-cross) (n=10) and R108 plants (n=13), and the segregating F2 progeny from this backcross (n=206: Mtsoc1a Tnt1 homozygotes, n=50; heterozygotes, n=111; wild-type segregants, n=45) with R108 wild-type control plants (n=28). The data are shown as the mean ± (t.SE) (0.05). (F and G) Graphs showing the flowering time in different conditions including short days (SDs) of Mtsoc1a mutants and R108 scored in either days (F) or nodes to first flower (G). The Mtsoc1a plants in LDs and VLDs were F3 plants after a backcross to R108. The mean ± (t.SE) (0.05) is presented (n=6–50). (H) Photographs of R108 wild-type plants with seed barrels and a prostrate, late flowering Mtsoc1a F2 homozygote with a very short primary axis taken at 45–47 d under VLDs. Arrowheads indicate the primary axis. Scale bar=1 cm. The inset image shows close-up photographs of primary shoot axes of 56-day-old LD wild-type R108 and Mtsoc1a F3 plants. (I) Graph showing the length of the primary axis of Mtsoc1a F2 homozygous mutants (n=39) after a backcross to R108 as compared with wild-type R108 (n=10). The measurements were taken at 45–50 d in VLDs and the data are shown as the mean ± (t.SE) (0.05).
Fig. 5.
Fig. 5.
Overexpression of MtSOC1a in Medicago results in elongation of the primary stem. (A and B) Flowering time in either days (A) or nodes (B) to first flower of individual regeneration controls (RCs) and T035S:MtSOC1a plants in LDs. (C) MtSOC1a transcript accumulation in leaves of RC and T035S:MtSOC1a plants (32–39 d old) at ZT4. Gene expression was determined using RT–qPCR with data shown as the mean ±SE of three biological replicates, normalized to PP2A and relative to the highest value. (D) Graph showing the length of the primary axis of RC and T035S:MtSOC1a plants (53–56 d in LDs). (E) Photographs of wild-type R108, RC, and T035S:MtSOC1a plants in LDs, 55–57 d after transfer of germinated seeds (for R108) or regenerated plantlets to soil. Arrowheads indicate the primary axis. The inset image shows close-up photographs of secondary branches from the primary axis of RC and T035S:MtSOC1a plants. (F–G, I–J) Graphs showing the flowering time of R108, Mtsoc1a mutants, and T135S:MtSOC1a (T1_35S) in LDs and VLDs scored in either days (F, I) or nodes (G, J) to first flower. The mean ± (t.SE) (0.05) is presented (n=7–18). (H, K) Graphs showing the length of the primary axis of T135S:MtSOC1a transformants in LDs (H) and VLDs (K) compared with Mtsoc1a and R108 plants. The measurements were taken at 33 d in LDs and 28 d in VLDs. The mean ± (t.SE) (0.05) is presented (n=7–18). The T135S:MtSOC1a plants in (F–K) were progeny of T035S:MtSOC1a (5-1). (L–N) Graphs showing the flowering time either in days (L) or nodes (M) to first flower and length of the primary axis measured at 28 d (N) in VLDs of the F1 progeny from a cross of T135S:MtSOC1a to wild-type R108 (F1_35S) compared with Mtsoc1a and R108 plants. The mean ± (t.SE) (0.05) is presented (n=4–16). The Mtsoc1a plants in (F–N) were F3 homozygous mutants after a backcross to R108.
Fig. 6.
Fig. 6.
MtSOC1a promotes cell and internode elongation in the Medicago primary shoot axis, but is not required for the response to GA3 spray. (A) Photographs of epidermal peels taken from the primary shoot axis of R108 (internode 6), Mtsoc1a mutant, and a 35S:MtSOC1a F2 plant (internode 6) (from a cross of T135S:MtSOC1a to wild-type R108) of 31- to 32-day-old plants in LDs. (B) Graphs showing average cell number ± (t.SE) (0.05) within the boxed area (400 μm×50 μm) as shown in (A) on 9–12 epidermal peels of LD plants (left graph) and 5–8 peels of VLD plants (right graph). (C) Photographs of epidermal peels taken from internode 4 of secondary branches of 50-day-old LD R108 and Mtsoc1a plants. (D) Graph showing counts of the average cell number ± (t.SE)(0.05) on 5–6 epidermal peels within the boxed area. The scale bars in (A) and (C) are 200 µm. (E and F) Graphs showing the flowering time (E) scored in either days or nodes to first flower and the length of primary axis (F) at 67 d of LD R108 plants sprayed with 100 μM GA3 or control spray. The mean ± (t.SE) (0.05) is presented (n=8). (G) Photographs of 29-day-old LD plants sprayed with 100 μM GA3 (+GA3) or control spray (–GA) with a scale bar of 5 cm. (H and I) Graphs showing the lengths of primary shoot axes (H) and their node number (I) of 33-day-old LD R108, Mtsoc1a, and T135S:MtSOC1a plants sprayed with 10 μM and 100 μM GA3 or control spray. Data are presented as the mean ± (t.SE) (0.05) (n=3–15). (J) Relative expression of MtSOC1a at ZT5 in the leaf, shoot apices of the primary and secondary branches (apex), internode 7 of the primary axis (P internode 7), and internode 4 of the longest secondary axis (S internode 4) of 42-day-old LD R108 plants sprayed with 10 μM and 100 μM GA3 or control spray. (K) Relative expression of GIBBERELLIN 3 BETA-HYDROXYLASE 1-LIKE (β-HYD, Medtr2g102570) in 42-day-old LD R108 and Mtsoc1a plants. Gene expression in (J–K) was determined using RT–qPCR, and data are the mean ±SE of two biological replicates, normalized to PP2A and presented relative to the highest value. The Mtsoc1a plants (C, D, G–K) were F3 homozygous mutants after a backcross to R108.

Similar articles

Cited by

References

    1. Alter P, Bircheneder S, Zhou LZ, Schlüter U, Gahrtz M, Sonnewald U, Dresselhaus T. 2016. Flowering time-regulated genes in maize include the transcription factor ZmMADS1. Plant Physiology 172, 389–404. - PMC - PubMed
    1. Andrés F, Coupland G. 2012. The genetic basis of flowering responses to seasonal cues. Nature Reviews. Genetics 13, 627–639. - PubMed
    1. Balanzà V, Martínez-Fernández I, Ferrándiz C. 2014. Sequential action of FRUITFULL as a modulator of the activity of the floral regulators SVP and SOC1. Journal of Experimental Botany 65, 1193–1203. - PMC - PubMed
    1. Bell CD, Soltis DE, Soltis PS. 2010. The age and diversification of the angiosperms re-revisited. American Journal of Botany 97, 1296–1303. - PubMed
    1. Benlloch R, d’Erfurth I, Ferrandiz C, Cosson V, Beltrán JP, Cañas LA, Kondorosi A, Madueño F, Ratet P. 2006. Isolation of mtpim proves Tnt1 a useful reverse genetics tool in Medicago truncatula and uncovers new aspects of AP1-like functions in legumes. Plant Physiology 142, 972–983. - PMC - PubMed

Publication types