. 2018 Nov 13;14(11):5959-5968.
doi: 10.1021/acs.jctc.8b00625. Epub 2018 Oct 23.

Shear Viscosity Computed from the Finite-Size Effects of Self-Diffusivity in Equilibrium Molecular Dynamics

Affiliations

Shear Viscosity Computed from the Finite-Size Effects of Self-Diffusivity in Equilibrium Molecular Dynamics

Seyed Hossein Jamali et al. J Chem Theory Comput. .

Abstract

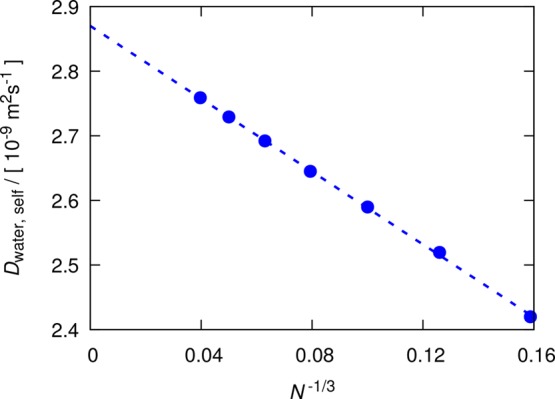
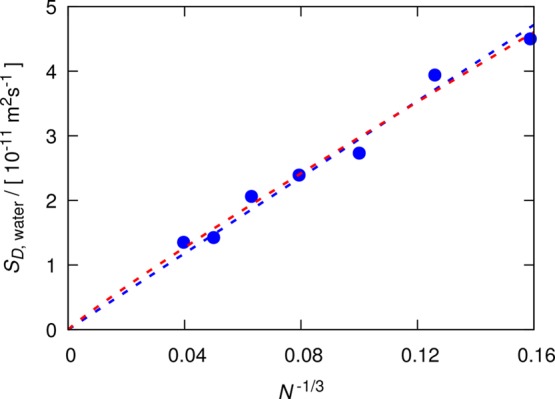
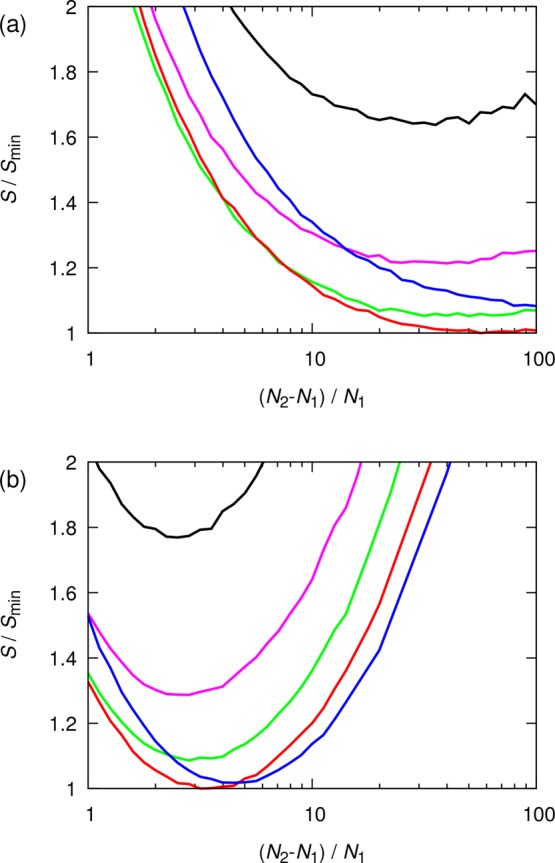
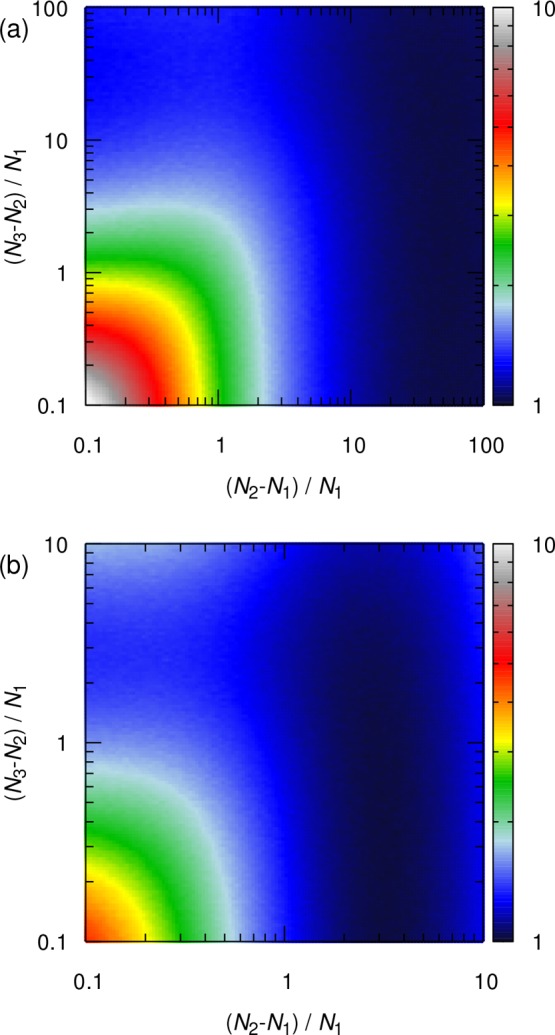
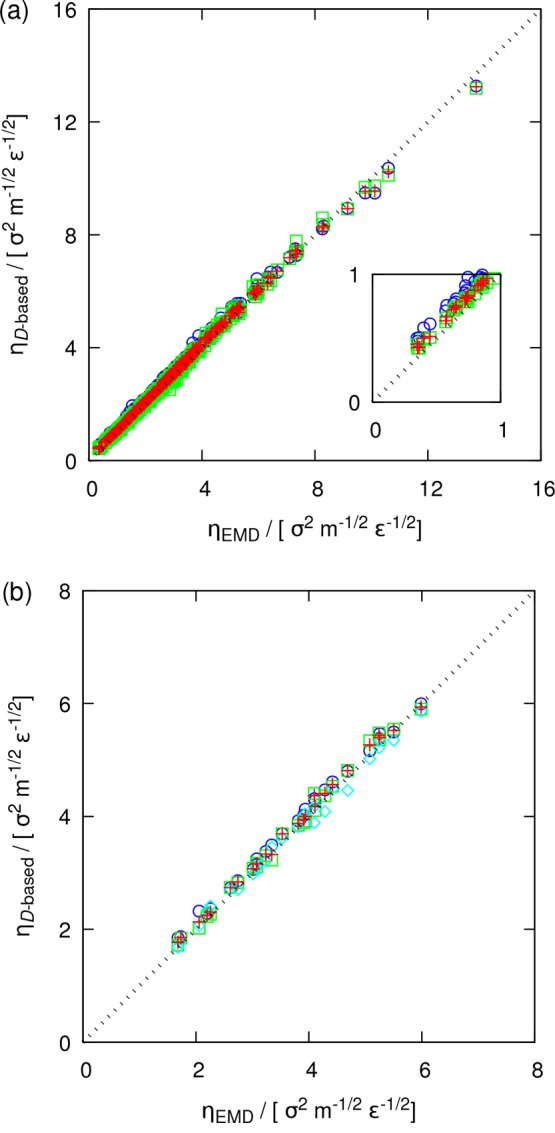
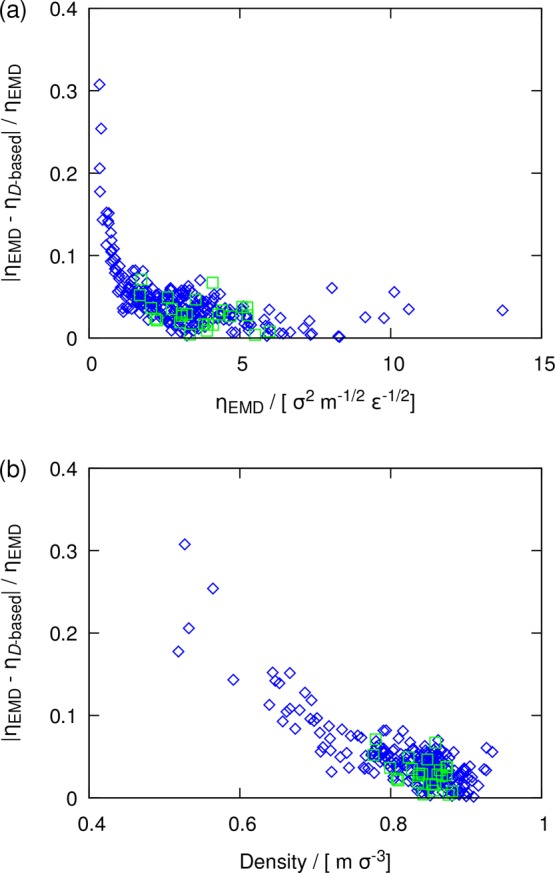
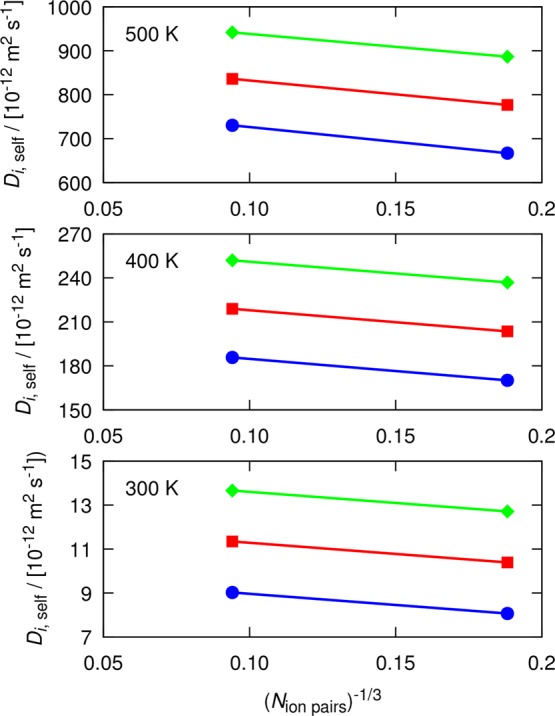
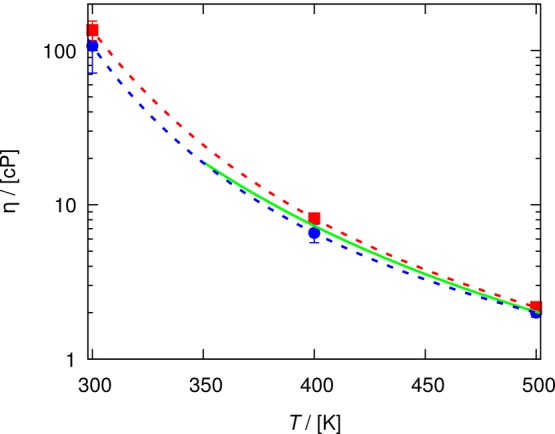
A method is proposed for calculating the shear viscosity of a liquid from finite-size effects of self-diffusion coefficients in Molecular Dynamics simulations. This method uses the difference in the self-diffusivities, computed from at least two system sizes, and an analytic equation to calculate the shear viscosity. To enable the efficient use of this method, a set of guidelines is developed. The most efficient number of system sizes is two and the large system is at least four times the small system. The number of independent simulations for each system size should be assigned in such a way that 50%-70% of the total available computational resources are allocated to the large system. We verified the method for 250 binary and 26 ternary Lennard-Jones systems, pure water, and an ionic liquid ([Bmim][Tf2N]). The computed shear viscosities are in good agreement with viscosities obtained from equilibrium Molecular Dynamics simulations for all liquid systems far from the critical point. Our results indicate that the proposed method is suitable for multicomponent mixtures and highly viscous liquids. This may enable the systematic screening of the viscosities of ionic liquids and deep eutectic solvents.


Conflict of interest statement

The authors declare no competing financial interest.

Figures

Figure 1
Figure 1
Computed self-diffusion coefficients of the SPC/E water model at 298 K and 1 atm for seven system sizes: N = 250, 500, 1000, 2000, 4000, 8000, and 16 000 water molecules. A total of 100 independent simulations of 0.5 ns were performed for each system size. The dashed line is fitted with the weighted least-squares linear regression (eq 12) to the YH equation (eq 4). Error bars are smaller than the symbol sizes. The self-diffusivities are tabulated in Table S1 of the Supporting Information.
Figure 2
Figure 2
Estimated standard deviations of the self-diffusion coefficients of the SPC/E water model at 298 K and 1 atm, computed for seven system sizes: N = 250, 500, 1000, 2000, 4000, 8000, and 16 000 water molecules. A total of 100 independent simulations of 0.5 ns were performed for each system size. The red and blue dashed lines are fits to a power-law (eq 13) and a linear function (eq 14), respectively.
Figure 3
Figure 3
Normalized estimated standard deviation (S/Smin) of the shear viscosity as a function of the normalized size difference between two systems ((N2N1)/N1). The total amount of computational resources is fixed. Different colors indicate various ratios α of the computational resources allocated to large and small system sizes (eq 15): 0.2 (black), 0.5 (magenta), 1.0 (green), 2.0 (red), and 5.0 (blue). Two types of scalability for MD simulations are considered: (a) high scalability (γ = 1) and (b) low scalability (γ = 2).
Figure 4
Figure 4
Normalized estimated standard deviations (S/Smin) of the shear viscosities as a function of the normalized size difference between small and medium systems ((N2N1)/N1), and between medium and large system sizes ((N3N2)/N1). A fixed amount of computational resources is equally distributed between the three system sizes. Two types of scalability for the MD simulations are considered: (a) high scalability (γ = 1) and (b) low scalability (γ = 2).
Figure 5
Figure 5
Comparison between the shear viscosities of (a) 250 binary and (b) 26 ternary LJ systems computed from the Einstein relation (ηEMD, eq 1) and the D-based method (ηD-based, eq 4) at a reduced temperature of 0.65 and a reduced pressure of 0.05. The D-based shear viscosities are computed from the self-diffusion coefficients of species 1 (blue circles), species 2 (green squares), and species 3 (cyan diamonds; only for ternary systems) as well as the average self-diffusivity (eq 9, red crosses). Error bars are omitted for clarity. All computed shear viscosities and their statistical uncertainties are listed in the Supporting Information, Tables S4 and S7.
Figure 6
Figure 6
Normalized absolute difference between shear viscosities computed from the Einstein relation and the D-based method as a function of (a) the shear viscosity and (b) the density. Data are shown for binary (blue diamonds) and ternary (green squares) LJ systems at a temperature of 0.65 and a pressure of 0.05. The D-based method shear viscosities are computed from average self-diffusivities (Davg).
Figure 7
Figure 7
Computed self-diffusion coefficients of [Bmim][Tf2N] at 300, 400, and 500 K and 1 atm. In all, 40 and 8 independent simulations were performed for two system sizes of 150 and 1200 ion pairs, respectively. Self-diffusivities are shown for [Bmim] (blue circles), [Tf2N] (green diamonds), and Davg (red squares). The slope of the line connecting each two points yields the shear viscosity. The simulation length at 400 and 500 K is 20 ns. Simulations at 300 K were performed for 50 ns. All self-diffusivities are listed in Tables S8–S10 of the Supporting Information. Error bars are smaller than the symbol sizes.
Figure 8
Figure 8
Shear viscosity of [Bmim][Tf2N] as a function of temperature at 1 atm, computed from the D-based method (blue circles, eq 4) and the Einstein relation (red squares, eq 1). The lines are fits to the Vogel equation (eq 16) for the D-based method (blue dashed, eq 4), Einstein relation (red dashed), and Green–Kubo relation (green solid; data extracted from the work of Zhang et al.). The shear viscosities and coefficients of the Vogel equation are provided in Tables S11 and S12 of the Supporting Information.

References

    1. Teja A. S.; Rice P. Generalized Corresponding States Method for the Viscosities of Liquid Mixtures. Ind. Eng. Chem. Fundam. 1981, 20, 77–81. 10.1021/i100001a015. - DOI
    1. Ely J. F.; Hanley H. J. M. Prediction of Transport Properties. 1. Viscosity of Fluids and Mixtures. Ind. Eng. Chem. Fundam. 1981, 20, 323–332. 10.1021/i100004a004. - DOI
    1. Pedersen K. S.; Fredenslund A. An Improved Corresponding States Model for the Prediction of Oil and Gas Viscosities and Thermal Conductivities. Chem. Eng. Sci. 1987, 42, 182–186. 10.1016/0009-2509(87)80225-7. - DOI
    1. Assael M. J.; Dymond J. H.; Papadaki M.; Patterson P. M. Correlation and Prediction of Dense Fluid Transport Coefficients. I. n-alkanes. Int. J. Thermophys. 1992, 13, 269–281. 10.1007/BF00504436. - DOI
    1. Rosenfeld Y. Relation between the Transport Coefficients and the Internal Entropy of Simple Systems. Phys. Rev. A: At., Mol., Opt. Phys. 1977, 15, 2545–2549. 10.1103/PhysRevA.15.2545. - DOI