. 2019 Apr:181:325-345.
doi: 10.1016/j.exer.2018.09.012. Epub 2018 Oct 5.

Light-induced generation and toxicity of docosahexaenoate-derived oxidation products in retinal pigmented epithelial cells

Affiliations

Light-induced generation and toxicity of docosahexaenoate-derived oxidation products in retinal pigmented epithelial cells

Yu-Shiuan Cheng et al. Exp Eye Res. 2019 Apr.

Abstract

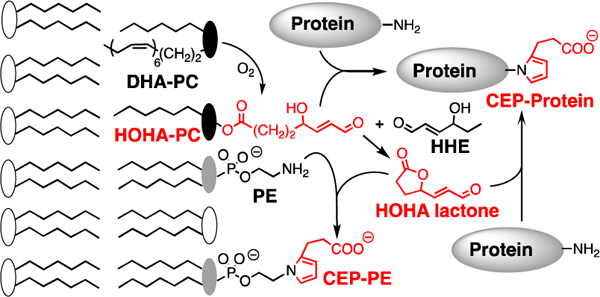
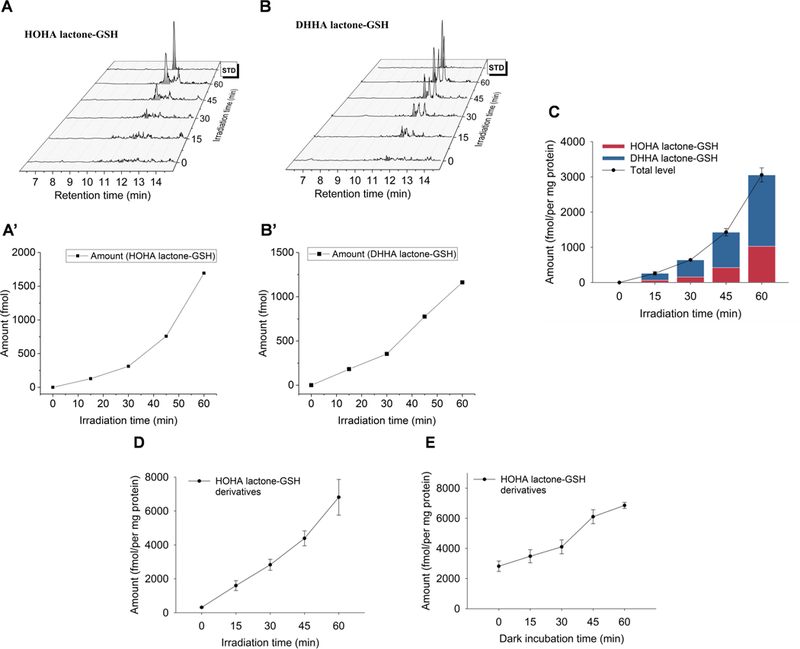
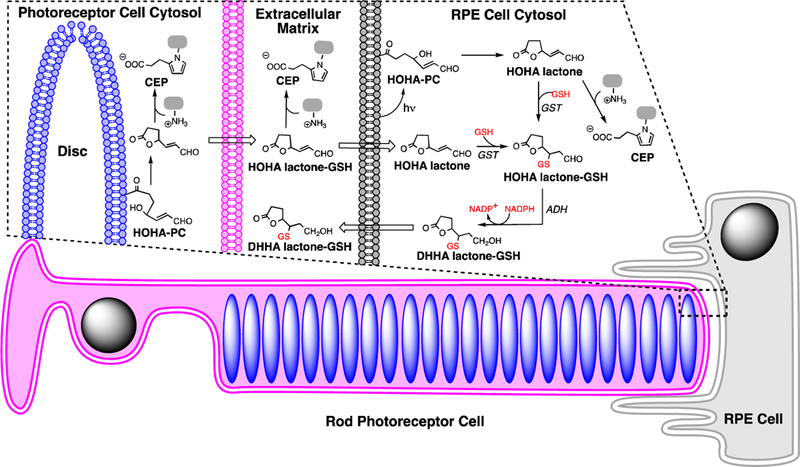
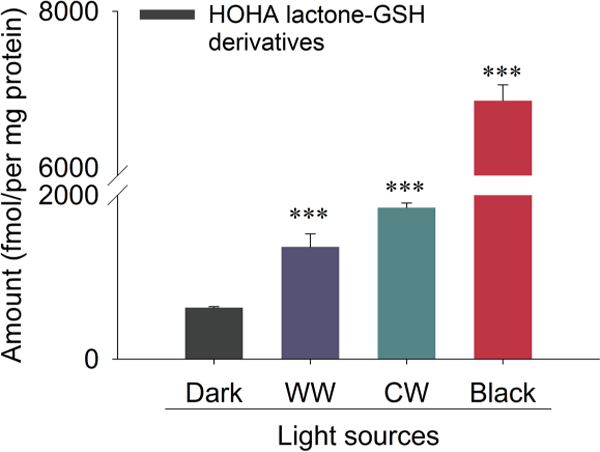
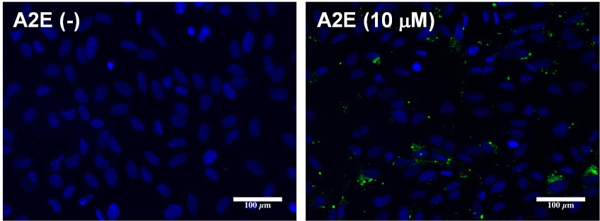
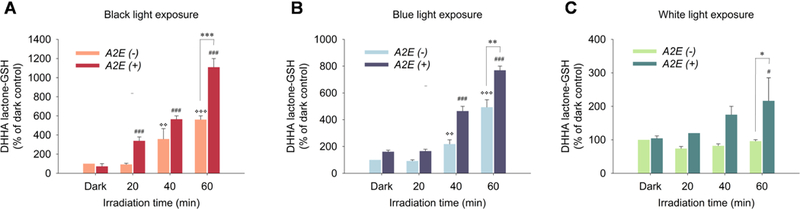
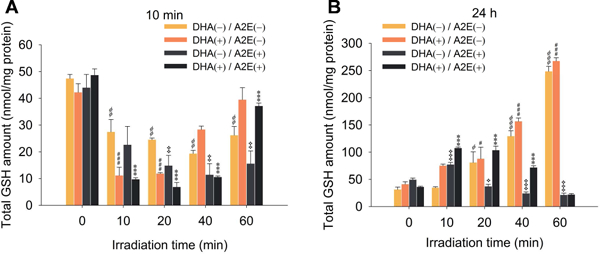
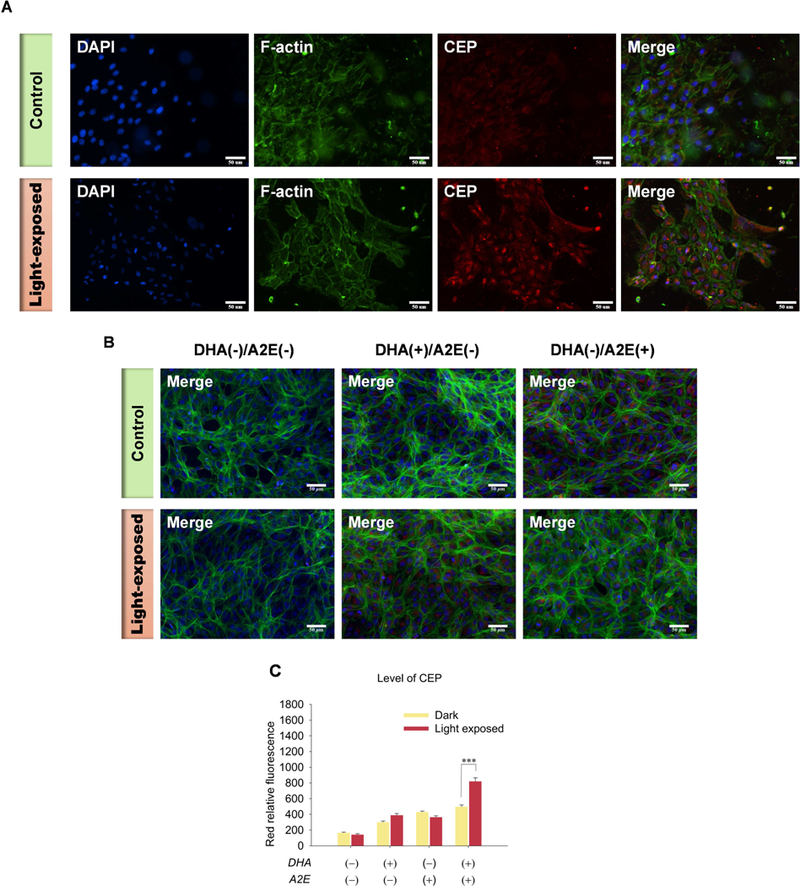
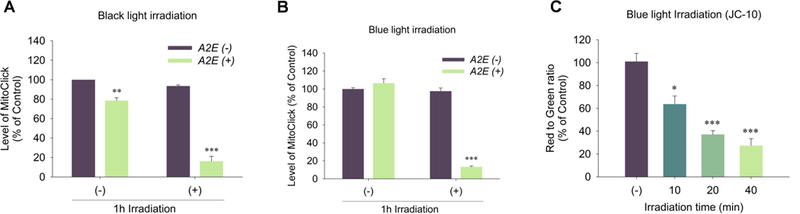
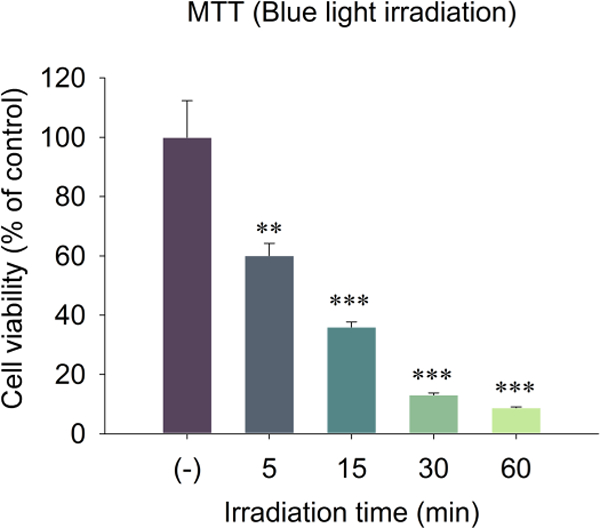
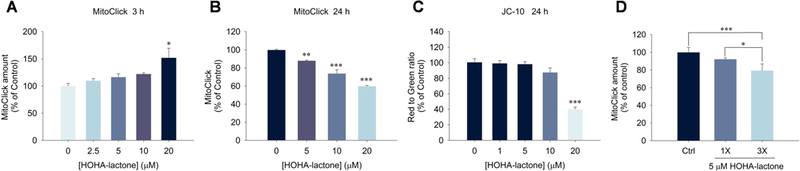
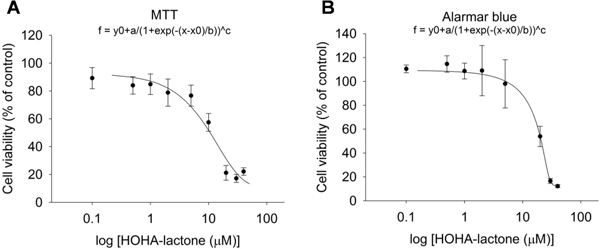
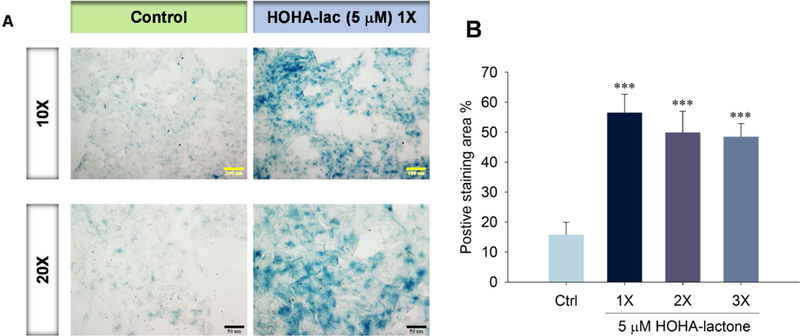
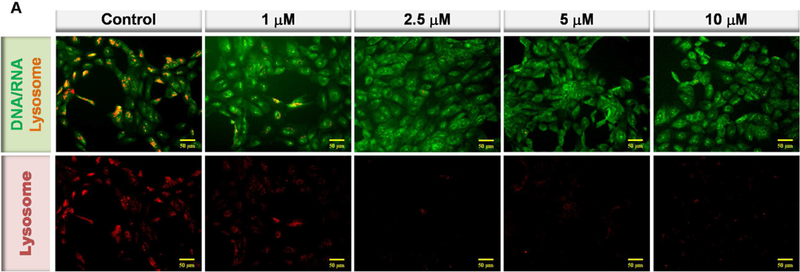
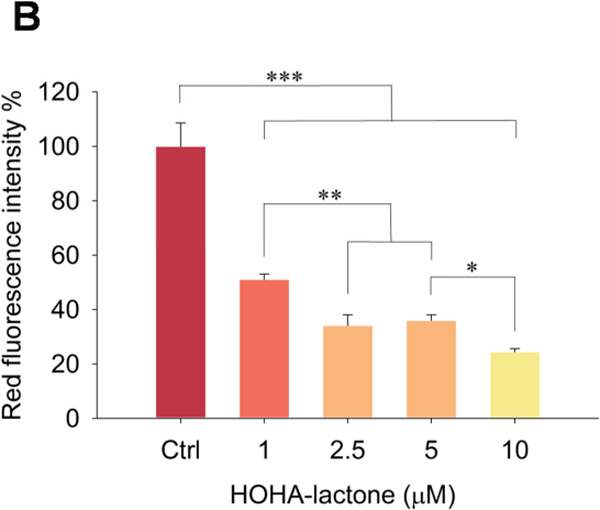
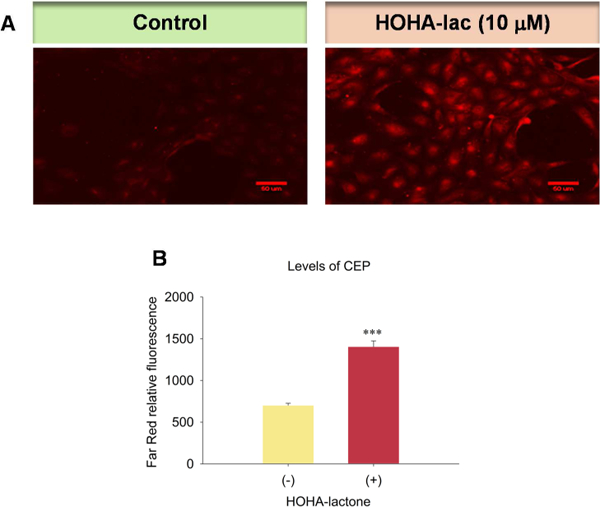
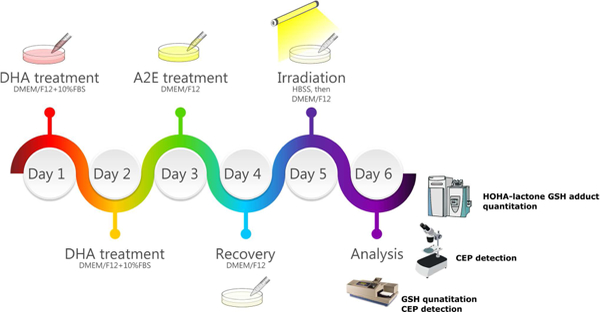
Oxidative cleavage of docosahexaenoate (DHA) in retinal pigmented epithelial (RPE) cells produces 4-hydroxy-7-oxohept-5-enoic acid (HOHA) esters of 2-lysophosphatidylcholine (PC). HOHA-PC spontaneously releases a membrane-permeant HOHA lactone that modifies primary amino groups of proteins and ethanolamine phospholipids to produce 2-(ω-carboxyethyl)pyrrole (CEP) derivatives. CEPs have significant pathological relevance to age-related macular degeneration (AMD) including activation of CEP-specific T-cells leading to inflammatory M1 polarization of macrophages in the retina involved in "dry AMD" and TLR2-dependent induction of angiogenesis that characterizes "wet AMD". RPE cells accumulate DHA from shed rod photoreceptor outer segments through phagocytosis and from plasma lipoproteins secreted by the liver through active uptake from the choriocapillaris. As a cell model of light-induced oxidative damage of DHA phospholipids in RPE cells, ARPE-19 cells were supplemented with DHA, with or without the lipofuscin fluorophore A2E. In this model, light exposure, in the absence of A2E, promoted the generation HOHA lactone-glutathione (GSH) adducts, depletion of intracellular GSH and a competing generation of CEPs. While DHA-rich RPE cells exhibit an inherent proclivity toward light-induced oxidative damage, photosensitization by A2E nearly doubled the amount of lipid oxidation and expanded the spectral range of photosensitivity to longer wavelengths. Exposure of ARPE-19 cells to 1 μM HOHA lactone for 24 h induced massive (50%) loss of lysosomal membrane integrity and caused loss of mitochondrial membrane potential. Using senescence-associated β-galactosidase (SA β-gal) staining that detects lysosomal β-galactosidase, we determined that exposure to HOHA lactone induces senescence in ARPE-19 cells. The present study shows that products of light-induced oxidative damage of DHA phospholipids in the absence of A2E can lead to RPE cell dysfunction. Therefore, their toxicity may be especially important in the early stages of AMD before RPE cells accumulate lipofuscin fluorophores.

Keywords: A2E; Age-related macular degeneration; Carboxyethylpyrrole; Lipid oxidation; Lysosome; Mitochondrial membrane potential.


Figures

Fig. 1.
Fig. 1.
Oxidative cleavage of DHA-PC delivers HOHA-PC. HOHA lactone is released from bilayer phospholipid membranes by spontaneous intramolecular transesterification. Covalent adduction of HOHA-PC and HOHA lactone to primary amino groups of protein lysyl residues and phosphatidyl ethanolamines (PE) produces CEP derivatives.
Fig. 2.
Fig. 2.
Time-course of the formation of HOHA lactone GSH derivatives: aldehyde (HOHA lactone-GSH, Panel A) and alcohol (DHHA lactone-GSH, Panel B) in bovine retina extracts as the result of black light (UV) exposure determined by LC-MS/MS. The MRM transition in the Panel A for the HOHA lactone-GSH is 448.1→301.1 and the MRM transition in Panel B for the DHHA lactone-GSH is 450.1→321.1. Fig. 2A’ and Fig. 2B’ show the levels of HOHA lactone-GSH and DHHA lactone-GSH in the Fig.2A and Fig.2B time- course experiments, respectively. Panel C shows the accumulation of HOHA lactone-GSH (blue) and DHHA lactone-GSH (red) in bovine retina extract as the result of light exposure. Panel D: irradiation time dependence of total GSH derivative (HOHA lactone-GSH plus DHHA lactone-GSH) production after UV treatment for various time periods at 0 °C followed by 1 h incubation at 23 °C; Panel E: post irradiation incubation time dependence of total GSH derivative (HOHA lactone-GSH plus DHHA lactone-GSH) production after irradiation at 0 °C for 1 h followed by various periods of incubation at 23 °C. The data are presented as mean ± SD, n = 3 (three independent experiments).
Fig. 3.
Fig. 3.
Photogeneration of HOHA-PC from DHA-PC is followed by release of HOHA lactone. HOHA lactone-GSH adduct is generated by glutathionylation of HOHA lactone. NADPH-dependent reduction of the HOHA lactone-GSH adduct delivers the reduced GSH adduct, DHHA lactone-GSH, that is also produced by RPE cells exposed to HOHA lactone, e.g., that may be released by oxidatively damaged photoreceptor cells.
Fig. 4.
Fig. 4.
Quantitative LC-MS/MS analysis of HOHA lactone GSH derivatives (HOHA lactone-GSH plus DHHA lactone-GSH) production induced in bovine retina extracts by light sources of various wavelengths. (The adduct MRM transition for the HOHA lactone-GSH is 448.1→301.1 and the MRM transition for the DHHA lactone-GSH is 450.1μ321.1). The data are presented as mean ± SD, n = 3. Student’s t-test: ***- P<0.001
Fig. 5.
Fig. 5.
Internalization of A2E: representative images showing green A2E autofluorescence in ARPE-19 cells preloaded 24 h with A2E.
Fig. 6.
Fig. 6.
Generation of DHHA lactone-GSH upon exposure to black light (Panel A), blue light (Panel B) or white light (Panel C) in ARPE-19 cells (A2E(−)) pre-incubated with 50 μg/mL DHA for 48 h or cells (A2E(+)) pre-incubated with DHA for 48 h followed by 10 A2E for 24 h with 24 h recovery in basal medium. Levels of GSH derivatives were determined by LC-MS/MS. The adduct MRM transition monitored for DHHA lactone-GSH was 450.1→321.1. The data are presented as mean ± SD, n = 3. Student’s t-test: *-P˂0.05, **- P˂0.01, ***- P˂0.001,*> = significant difference from A2E(−)/dark control; # = significant difference from A2E(+)/dark control.
Fig. 7.
Fig. 7.
Quantitation of GSH levels remaining in DHA/A2E-laden ARPE-19 cells 10 min (Panel A) or 24 h (Panel B) after irradiation for various times from 0 to 60 min. The data are presented as mean ± SD, n = 3. Student’s t-test: *=P˂0.05, **=P˂0.01, ***=P˂0.001
Fig. 8.
Fig. 8.
Generation of CEP in ARPE-19 cells after 20 min exposure to blue light. Panel A: Images of the generation of CEP in DHA-rich A2E-laden ARPE-19 cells (Top panel: Control; Bottom panel: light-exposed). Panel B: Images of CEP immunostaining in ARPE-19 cells (Top panel: Control; Bottom panel: light-exposed; From Left to right: DHA(−)/A2E(−), DHA(+)/A2E(−), DHA(−)/A2E(+)). Panel C: Quantification CEP levels in ARPE-19 cells. A2E-laden ARPE-19 cells were exposed to blue light for 20 min followed by 24 h incubation and then immunostained with rabbit anti-CEP polyclonal antibody/goat anti-rabbit Texas Red-X antibodies (red), Flash Phalloidin™ Green 488 (green, F-actin) and DAPI (blue). The figure is representative of 4~6 independent experiments, which showed very similar results. Student’s t-test: ***- P˂0.001.
Fig. 9.
Fig. 9.
Measurement of mitochondrial membrane potential in light exposed DHA-rich A2E-laden ARPE-19 cells. Panel A: to cells exposed to black light (365 nm) for 0 and 1 h, after 24 h recovery, were added TPP probes for 3 h and the amount of MitoClick was quantified by LC-MS/MS; Panel B: to DHA-rich A2E-laden ARPE-19 cells exposed to blue light (430 nm) for 0 and 1 h, after 24 h recovery, were added the TPP probes for 3 h and the amount of MitoClick produced was quantified by LC-MS/MS; Panel C: DHA-rich A2E-laden ARPE-19 cells were exposed to blue light (365 nm) for 0 to 40 min and, after 24 h recovery, the ΔΨm was measured by JC-10. The data are presented as mean ± SD of %control, n = 3. The cells without light exposure (−) served as control. Student’s t-test: *- P˂0.05, **- P˂0.01, ***- P˂0.001.
Fig. 10.
Fig. 10.
Measurement of the cell viability by MTT assay 24 h after A2E-laden ARPE-19 cells were exposed to blue light (430 nm) for 0 to 60 min. The data are presented as mean ± SD of % control, n = 3. Student’s t-test: **- P˂0.01, ***- P˂0.001. The cells without light exposure (−) served as control.
Fig. 11.
Fig. 11.
Measurement of mitochondrial membrane potential changes in ARPE-19 cells upon exposure to HOHA lactone. Panel A: dose- dependent effect of 3 h exposure to HOHA lactone on ARPE-19 cell mitochondrial membrane potential measured with the TPP MitoClick probe; Panel B: dose-dependent effect of 24 h exposure to HOHA lactone on ARPE-19 cell mitochondrial membrane potential measured with the TPP MitoClick probe; Panel C: effect of 24 h exposure to HOHA lactone on ARPE-19 cell mitochondrial membrane potential measured with the JC-10 probe; Panel D: effects of a single treatment (1X) with 5 μM HOHA lactone incubated for 8 h or a triple treatment (3X) with 5 μM HOHA lactone every 8 h, total incubation time was 24 h, measured with the TPP MitoClick probe. The data are presented as mean ± SD of % control, n = 3 (MitoClick) or n = 6 (JC-10). Student’s t-test: *-P˂0.05, **- P˂0.01, ***- P˂0.001.
Fig. 12.
Fig. 12.
Measurement of the cell viability of ARPE-19 cells after exposure to 0 to 40 μM HOHA lactone for 24 h assessed by MTT assay (Panel A) and by Alamar Blue assay (Panel B). The data are presented as mean ± SD of % control, n = 8.
Fig. 13.
Fig. 13.
Senescence in ARPE-19 cells exposed to HOHA lactone. Panel A: SA-P-Gal activity in ARPE-19 cells treated with 5 μM HOHA lactone and then maintained in fresh medium (DMEM/F12 containing 1% FBS) for a total of 7 days. Micrographs were obtained with bright field/phase contrast combined mode microscopy; Panel B: Quantification of SA-β-Gal positive cells shown in panel A (1X) and in those treated again after 12 h (2X) and 24 h (3X) with 5 mM HOHA lactone. SA-P-Gal positive regions were scored in 3 fields in duplicate wells. Results are expressed as the percentage of stained area (mean ± SD).
Fig. 14.
Fig. 14.
Lysosomal membrane perturbation in ARPE-19 cells after incubation with HOHA lactone. Panel A: Inverted fluorescence microscope images (10X) of Acridine Orange sequestered in ARPE-19 intact lysosomes (red) or bound to DNA, RNA and other cell constituents (green). Panel B: Relative fluorescence intensity of AO-stained lysosomes in the control and in the HOHA lactone treated ARPE-19 cells after 24 h of incubation under standard conditions. ARPE-19 cells were incubated with 0~10 HOHA lactone for 24 h incubation and then stained with Acridine Orange. Lysosomal fluorescence was quantified in the raw image after background subtraction using Metamorph sofware. The figure is representative of 4 independent experiments, which showed very similar results. Student’s t-test: *-P˂0.05, **- P˂0.01, ***- P˂0.001.
Fig. 14.
Fig. 14.
Lysosomal membrane perturbation in ARPE-19 cells after incubation with HOHA lactone. Panel A: Inverted fluorescence microscope images (10X) of Acridine Orange sequestered in ARPE-19 intact lysosomes (red) or bound to DNA, RNA and other cell constituents (green). Panel B: Relative fluorescence intensity of AO-stained lysosomes in the control and in the HOHA lactone treated ARPE-19 cells after 24 h of incubation under standard conditions. ARPE-19 cells were incubated with 0~10 HOHA lactone for 24 h incubation and then stained with Acridine Orange. Lysosomal fluorescence was quantified in the raw image after background subtraction using Metamorph sofware. The figure is representative of 4 independent experiments, which showed very similar results. Student’s t-test: *-P˂0.05, **- P˂0.01, ***- P˂0.001.
Fig. 15.
Fig. 15.
Generation of CEP in ARPE-19 cells upon exposure to HOHA lactone. Panel A: Images revealing the generation of CEP in ARPE-19 cells (Left: Control; Right: cells exposed to 10 μM HOHA lactone). Panel B: Quantification of the levels of CEP in ARPE-19 cells. ARPE-19 cells were exposed to 10 μM HOHA lactone for 24 h and then immunostained with rabbit anti-CEP polyclonal antibody/goat anti-rabbit Texas Red-X antibodies. The figure is representative of two independent experiments that showed very similar results. Student’s t-test: ***- P˂0.001.
Scheme 1.
Scheme 1.
The work-flow of the ARPE-19 cell light damage model.

Similar articles

Cited by

References

    1. Ablonczy Z, Higbee D, Anderson DM, Dahrouj M, Grey AC, Gutierrez D, Koutalos Y,L,SK, Hanneken A, Crouch RK, 2013. Lack of correlation between the spatial distribution of A2E and lipofuscin fluorescence in the human retinal pigment epithelium. Invest Ophthalmol Vis Sci. 54, 5535–5542. - PMC - PubMed
    1. Age-Related Eye Disease Study Research, G., 2001. A randomized, placebo-controlled, clinical trial of high-dose supplementation with vitamins C and E, beta carotene, and zinc for age-related macular degeneration and vision loss: AREDS report no. 8. Arch Ophthalmol 119, 1417–1436. - PMC - PubMed
    1. Alary J, Fernandez Y, Debrauwer L, Perdu E, Gueraud F, 2003. Identification of intermediate pathways of 4-hydroxynonenal metabolism in the rat. Chem Res Toxicol 16, 320–327. - PubMed
    1. Anoopkumar-Dukie S, Carey JB, Conere T, O’Sullivan E, van Pelt FN, Allshire A, 2005. Resazurin assay of radiation response in cultured cells. Br J Radiol 78, 945–947. - PubMed
    1. Artigas JM, Felipe A, Navea A, Fandino A, Artigas C, 2012. Spectral transmission of the human crystalline lens in adult and elderly persons: color and total transmission of visible light. Invest Ophthalmol Vis Sci 53, 4076–4084. - PubMed

Publication types

MeSH terms

Substances