

Prevalence thresholds for wasting, overweight and stunting in children under 5 years
- PMID: 30296964
- PMCID: PMC6390397
- DOI: 10.1017/S1368980018002434
Prevalence thresholds for wasting, overweight and stunting in children under 5 years
Abstract
Objective: Prevalence ranges to classify levels of wasting and stunting have been used since the 1990s for global monitoring of malnutrition. Recent developments prompted a re-examination of existing ranges and development of new ones for childhood overweight. The present paper reports from the WHO-UNICEF Technical Expert Advisory Group on Nutrition Monitoring.
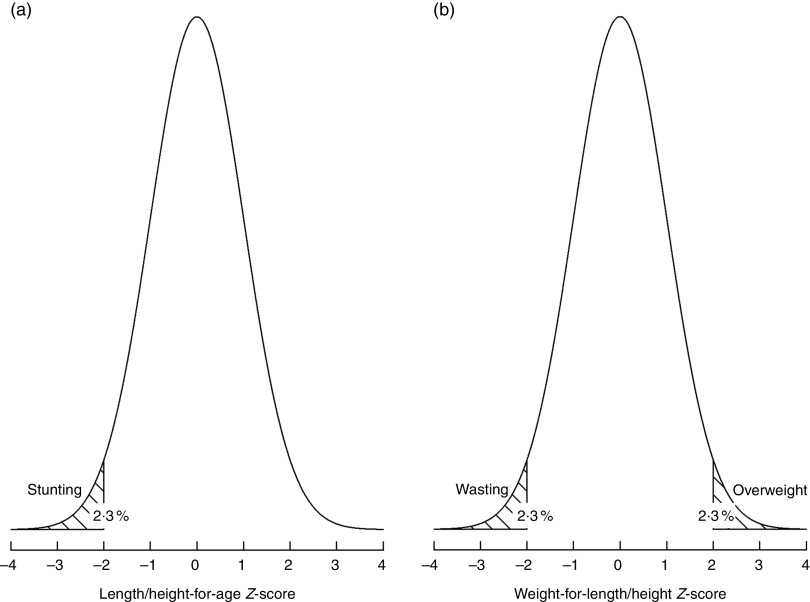
Design: Thresholds were developed in relation to sd of the normative WHO Child Growth Standards. The international definition of 'normal' (2 sd below/above the WHO standards median) defines the first threshold, which includes 2·3 % of the area under the normalized distribution. Multipliers of this 'very low' level (rounded to 2·5 %) set the basis to establish subsequent thresholds. Country groupings using the thresholds were produced using the most recent set of national surveys.
Setting: One hundred and thirty-four countries.
Subjects: Children under 5 years.
Results: For wasting and overweight, thresholds are: 'very low' (≈6 times 2·5 %). For stunting, thresholds are: 'very low' (≈12 times 2·5 %).
Conclusions: The proposed thresholds minimize changes and keep coherence across anthropometric indicators. They can be used for descriptive purposes to map countries according to severity levels; by donors and global actors to identify priority countries for action; and by governments to trigger action and target programmes aimed at achieving 'low' or 'very low' levels. Harmonized terminology will help avoid confusion and promote appropriate interventions.
Keywords: Children; Malnutrition; Overweight; Stunting; Wasting.
Figures
References
-
- Dibley MJ, Goldsby JB, Staehling NW et al. (1987) Development of normalized curves for the international growth reference: historical and technical considerations. Am J Clin Nutr 46, 736–748. - PubMed
-
- Nieburg P, Person-Karell B & Toole MJ (1992) Malnutrition–mortality relationships among refugees. J Refug Stud 5, 247–256.
-
- World Health Organization (1995) Physical Status: The Use and Interpretation of Anthropometry. Report of a WHO Expert Committee . WHO Technical Report Series no. 854. Geneva: WHO. - PubMed
-
- UNICEF, World Health Organization & World Bank (2017) UNICEF–WHO–World Bank Joint Child Malnutrition Estimates. Key findings of the 2017 edition. http://www.who.int/nutgrowthdb/jme_brochoure2017.pdf?ua=1 (accessed December 2017)
Publication types
MeSH terms
Grants and funding
LinkOut - more resources
Full Text Sources
Medical
