. 2018 Nov 6;115(9):1826-1835.
doi: 10.1016/j.bpj.2018.09.010. Epub 2018 Sep 20.

Dynamic Migration Modes of Collective Cells

Affiliations

Dynamic Migration Modes of Collective Cells

Shao-Zhen Lin et al. Biophys J. .

Abstract

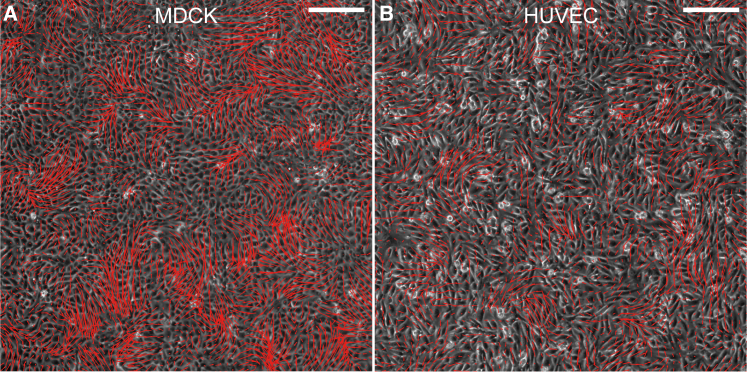
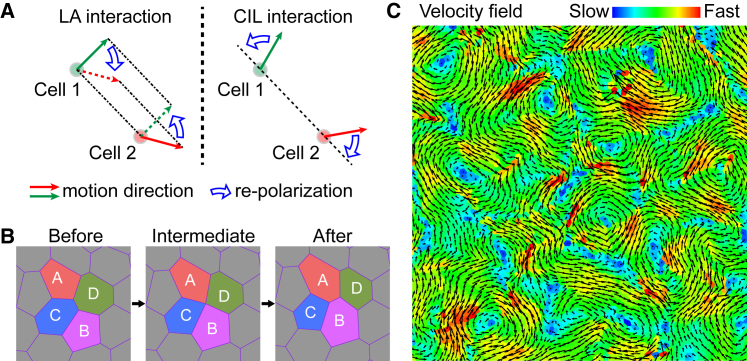
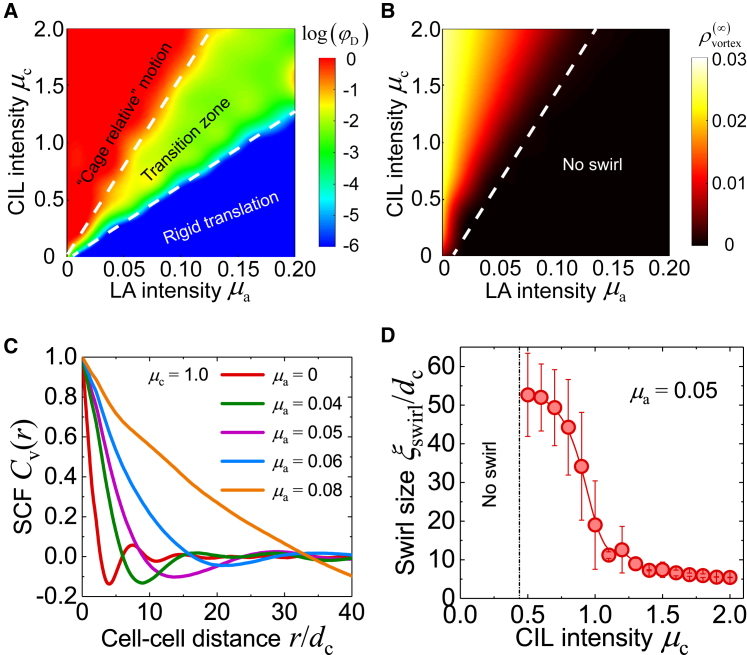
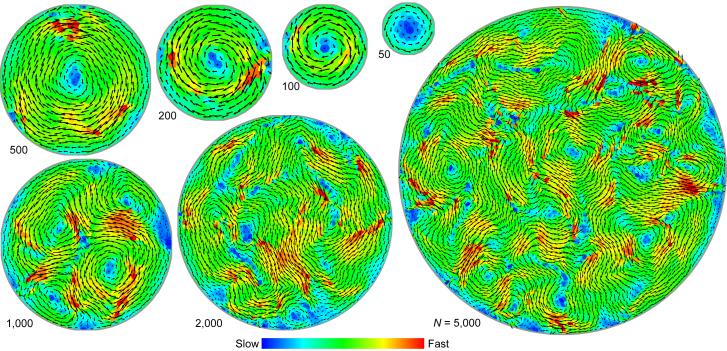
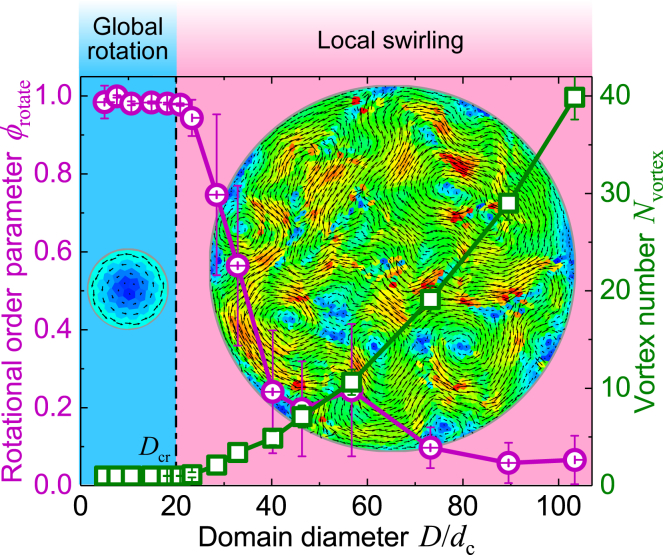
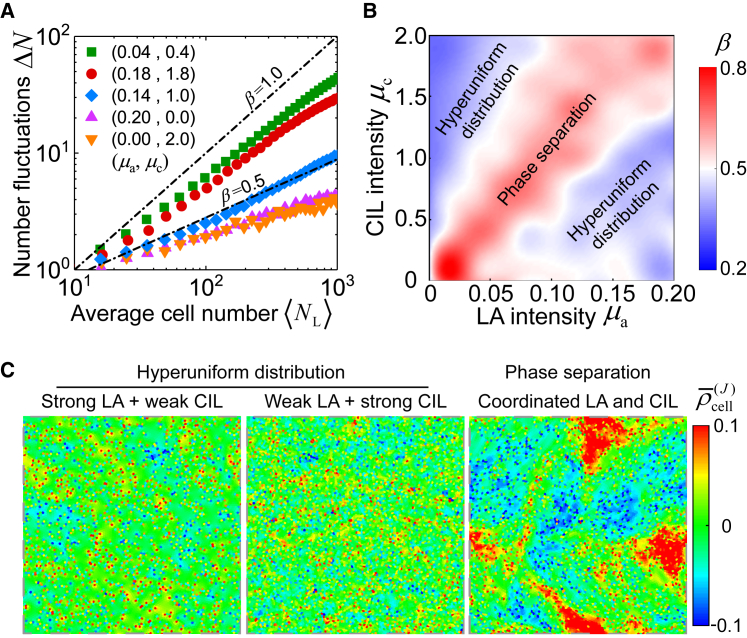
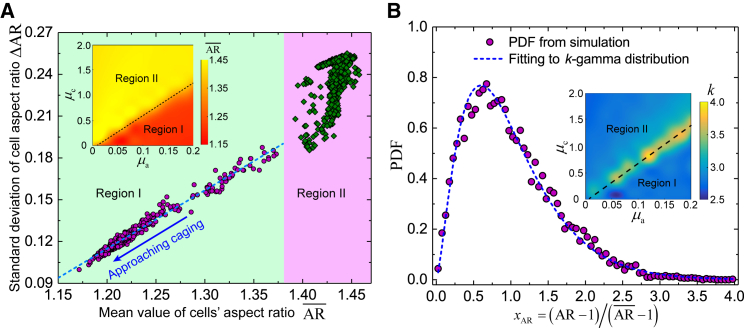
Collective cell migration occurs in a diversity of physiological processes such as wound healing, cancer metastasis, and embryonic morphogenesis. In the collective context, cohesive cells may move as a translational solid, swirl as a fluid, or even rotate like a disk, with scales ranging from several to dozens of cells. In this work, an active vertex model is presented to explore the regulatory roles of social interactions of neighboring cells and environmental confinements in collective cell migration in a confluent monolayer. It is found that the competition between two kinds of intercellular social interactions-local alignment and contact inhibition of locomotion-drives the cells to self-organize into various dynamic coherent structures with a spatial correlation scale. The interplay between this intrinsic length scale and the external confinement dictates the migration modes of collective cells confined in a finite space. We also show that the local alignment-contact inhibition of locomotion coordination can induce giant density fluctuations in a confluent cell monolayer without gaps, which triggers the spontaneous breaking of orientational symmetry and leads to phase separation.


Figures

Figure 1
Figure 1
Experimentally measured velocity fields of collective cell migration in confluent monolayers. A swirling pattern was observed in (A) an MDCK cell monolayer and (B) an HUVEC monolayer. Red arrows show the velocity vectors obtained via PIV analysis. Scale bars, 200 μm. To see this figure in color, go online.
Figure 2
Figure 2
Active vertex model accounting for intercellular social interactions. (A) A schematic of the LA and CIL interactions among cells. (B) A schematic of T1 topological transition in the active vertex model. (C) The swirling pattern obtained from our active vertex model. The black arrows denote the velocity vectors, and the color code corresponds to its magnitude. Shown here is a local window of the velocity field for a system containing N ∼ 10,000 cells (see Fig. S1 A for the global view). Parameter values: μa = 0.05 and μc = 1.0. To see this figure in color, go online.
Figure 3
Figure 3
Intrinsic modes and spatial correlation of collective cell migration. Phase diagrams of (A) the fraction of “cage relative” motions φD and (B) the intrinsic vortex density ρvortex() modulated by the intensities of LA (μa) and CIL (μc). In (A), the “cage relative” motion and rigid translation modes are defined for log(φD) > −1 and log(φD) < −5, respectively. In (B), the intrinsic vortex density ρvortex() is calculated in a system containing ∼10,000 cells. (C) The spatial correlation function (SCF) Cv(r) of cell velocity under different intensities of LA μa, where dc is the mean distance between neighboring cells, is shown. (D) The swirl size ξswirl versus the CIL intensity μc is shown. Data are mean ± SD. To see this figure in color, go online.
Figure 4
Figure 4
Patterns of collective cell migration confined in circular domain with different diameters. In different domains, cell population N is varied but cell density ρcell = 1 is kept constant. The arrows denote velocity vectors of cells, and the color code indicates magnitude of cell velocity. Parameter values: μa = 0.05 and μc = 1.0. To see this figure in color, go online.
Figure 5
Figure 5
Motion modes of collective cells confined in a circular domain. The rotational order parameter ϕrotate and the vortex number Nvortex vary with the diameter D. Data are mean ± SD. The inset images show the velocity field of two typical modes: global rotation and local swirling. Parameter values: μa = 0.05 and μc = 1.0. To see this figure in color, go online.
Figure 6
Figure 6
Density fluctuations in a confluent cell monolayer tailored by intercellular social interactions. (A) Number fluctuations ΔN versus average number NL of cells in a subregion of size L under different intensities of LA and CIL. (B) A phase diagram of the scaling exponent β of number fluctuations is shown. (C) The local cell density field for hyperuniform distribution of cells (left and middle) and phase separation pattern (right). The color denotes the local cell density field ρ¯cell(J). From left to right, parameter values are taken as (μa, μc) = (0.2, 0.1), (0.01, 2.0), and (0.12, 1.4). To see this figure in color, go online.
Figure 7
Figure 7
Features of cell shape regulated by intercellular social interactions. (A) A scatter diagram of the mean value AR¯ and the standard deviation ΔAR of cell aspect ratio upon changing the intensities of LA and CIL. Here, the aspect ratio of a polygonal cell is defined as AR=I1/I2, with I1 and I2 (I1 > I2) being the principal centroidal moments of inertia of the polygonal cell. The purple circular dots in region I are obtained from simulations in the case of relatively strong LA, and the green rhombic dots in region II are obtained from simulations in the case of relatively strong CIL (see the inset). The blue dashed line corresponds to a linear fitting of the data set (AR¯, ΔAR) in region I (the purple circular dots), with the fitting equation ΔAR=0.419AR¯0.388 and the corresponding correlation coefficient R2 = 0.9765. The inset shows a phase diagram of the mean cell aspect ratio AR¯ regulated by LA and CIL. (B) The probability density functions (PDFs) of cell shape collapse into a family of PDFs upon varying the intensities of LA and CIL. Typical PDF of the rescaled cell aspect ratio xAR=(AR1)/(AR¯1). The dashed curve corresponds to the fitting to k-γ distribution via maximal likelihood estimation. The inset shows a phase diagram of the shape parameter k tailored by LA and CIL. The definition of regions I and II are consistent with (A). To see this figure in color, go online.

References

    1. Friedl P., Locker J., Segall J.E. Classifying collective cancer cell invasion. Nat. Cell Biol. 2012;14:777–783. - PubMed
    1. Anon E., Serra-Picamal X., Ladoux B. Cell crawling mediates collective cell migration to close undamaged epithelial gaps. Proc. Natl. Acad. Sci. USA. 2012;109:10891–10896. - PMC - PubMed
    1. Behrndt M., Salbreux G., Heisenberg C.P. Forces driving epithelial spreading in zebrafish gastrulation. Science. 2012;338:257–260. - PubMed
    1. Bertet C., Sulak L., Lecuit T. Myosin-dependent junction remodelling controls planar cell intercalation and axis elongation. Nature. 2004;429:667–671. - PubMed
    1. Solon J., Kaya-Copur A., Brunner D. Pulsed forces timed by a ratchet-like mechanism drive directed tissue movement during dorsal closure. Cell. 2009;137:1331–1342. - PubMed

Publication types

LinkOut - more resources