Bottom trawl fishing footprints on the world's continental shelves
- PMID: 30297399
- PMCID: PMC6205437
- DOI: 10.1073/pnas.1802379115
Bottom trawl fishing footprints on the world's continental shelves
Abstract
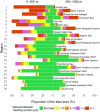
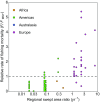
Bottom trawlers land around 19 million tons of fish and invertebrates annually, almost one-quarter of wild marine landings. The extent of bottom trawling footprint (seabed area trawled at least once in a specified region and time period) is often contested but poorly described. We quantify footprints using high-resolution satellite vessel monitoring system (VMS) and logbook data on 24 continental shelves and slopes to 1,000-m depth over at least 2 years. Trawling footprint varied markedly among regions: from <10% of seabed area in Australian and New Zealand waters, the Aleutian Islands, East Bering Sea, South Chile, and Gulf of Alaska to >50% in some European seas. Overall, 14% of the 7.8 million-km2 study area was trawled, and 86% was not trawled. Trawling activity was aggregated; the most intensively trawled areas accounting for 90% of activity comprised 77% of footprint on average. Regional swept area ratio (SAR; ratio of total swept area trawled annually to total area of region, a metric of trawling intensity) and footprint area were related, providing an approach to estimate regional trawling footprints when high-resolution spatial data are unavailable. If SAR was ≤0.1, as in 8 of 24 regions, there was >95% probability that >90% of seabed was not trawled. If SAR was 7.9, equal to the highest SAR recorded, there was >95% probability that >70% of seabed was trawled. Footprints were smaller and SAR was ≤0.25 in regions where fishing rates consistently met international sustainability benchmarks for fish stocks, implying collateral environmental benefits from sustainable fishing.
Keywords: effort; fisheries; footprint; habitat; seabed.
Copyright © 2018 the Author(s). Published by PNAS.
Conflict of interest statement
The authors declare no conflict of interest.
Figures


References
-
- Watling W, Norse EA. Disturbance of the seabed by mobile fishing gear: A comparison to forest clear cutting. Conserv Biol. 1998;12:1180–1197.
-
- NRC . Effects of Trawling and Dredging on Seafloor Habitat. National Academy Press; Washington, DC: 2002.
-
- Kaiser MJ, et al. Prioritization of knowledge-needs to achieve best practices for bottom trawling in relation to seabed habitats. Fish Fish. 2016;17:637–663.
-
- Piet GJ, Hintzen NT. Indicators of fishing pressure and seabed integrity. ICES J Mar Sci. 2012;69:1850–1858.
-
- Gerritsen HD, Minto C, Lordan C. How much of the seabed is impacted by mobile fishing gear? Absolute estimates from Vessel Monitoring System (VMS) point data. ICES J Mar Sci. 2013;70:523–531.
Publication types
MeSH terms
LinkOut - more resources
Full Text Sources
Miscellaneous

