. 2018 Oct 23;115(43):10989-10994.
doi: 10.1073/pnas.1805518115. Epub 2018 Oct 8.

Changes in temperature alter the relationship between biodiversity and ecosystem functioning

Affiliations

Changes in temperature alter the relationship between biodiversity and ecosystem functioning

Francisca C García et al. Proc Natl Acad Sci U S A. .

Abstract

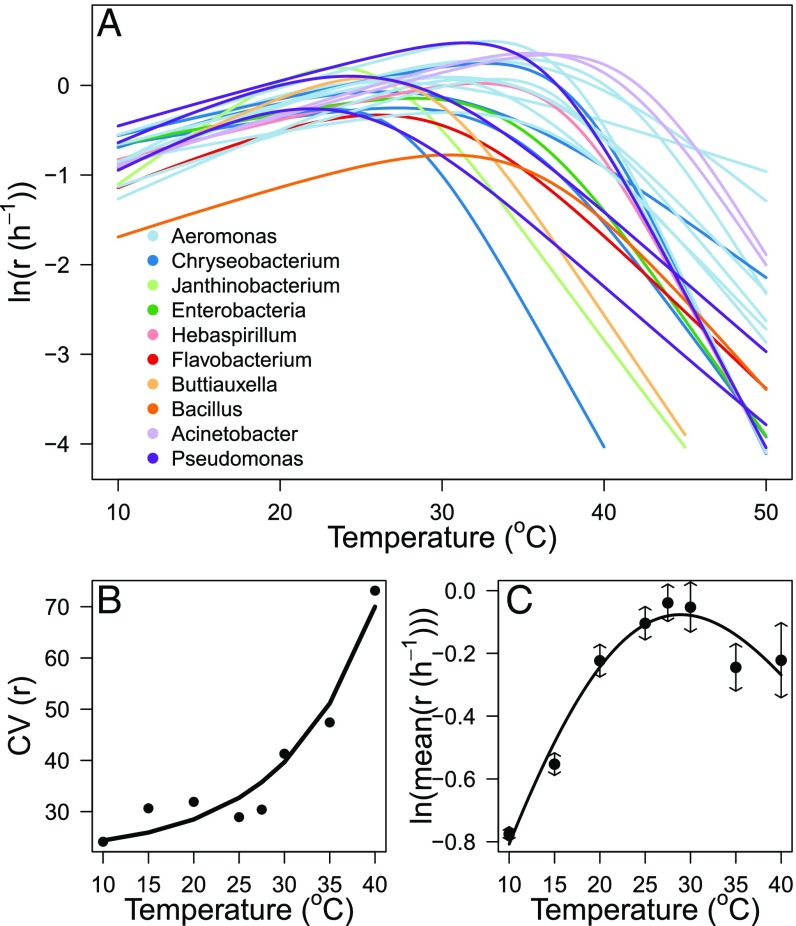
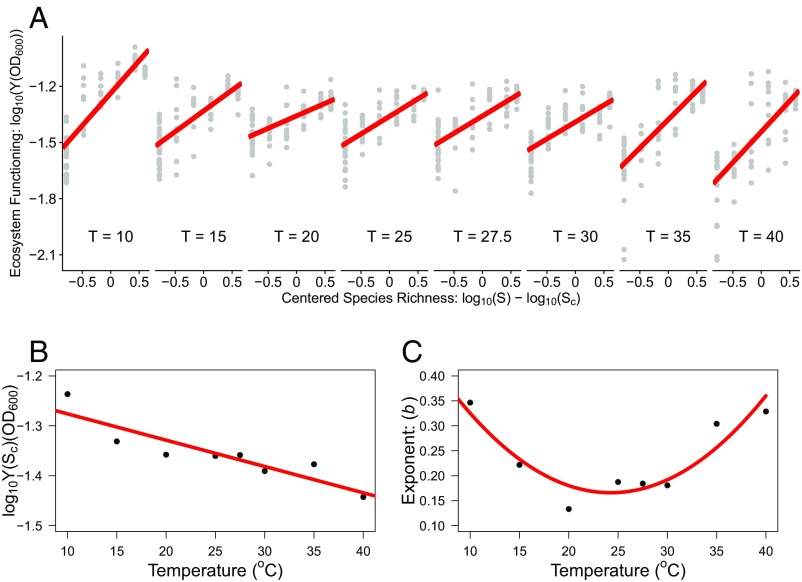
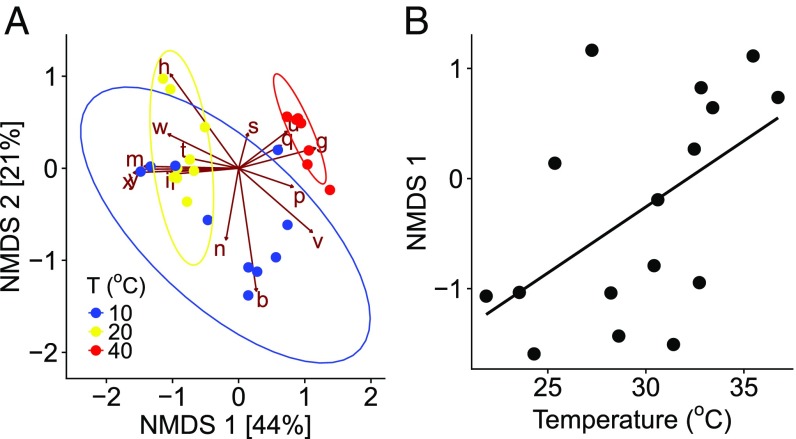
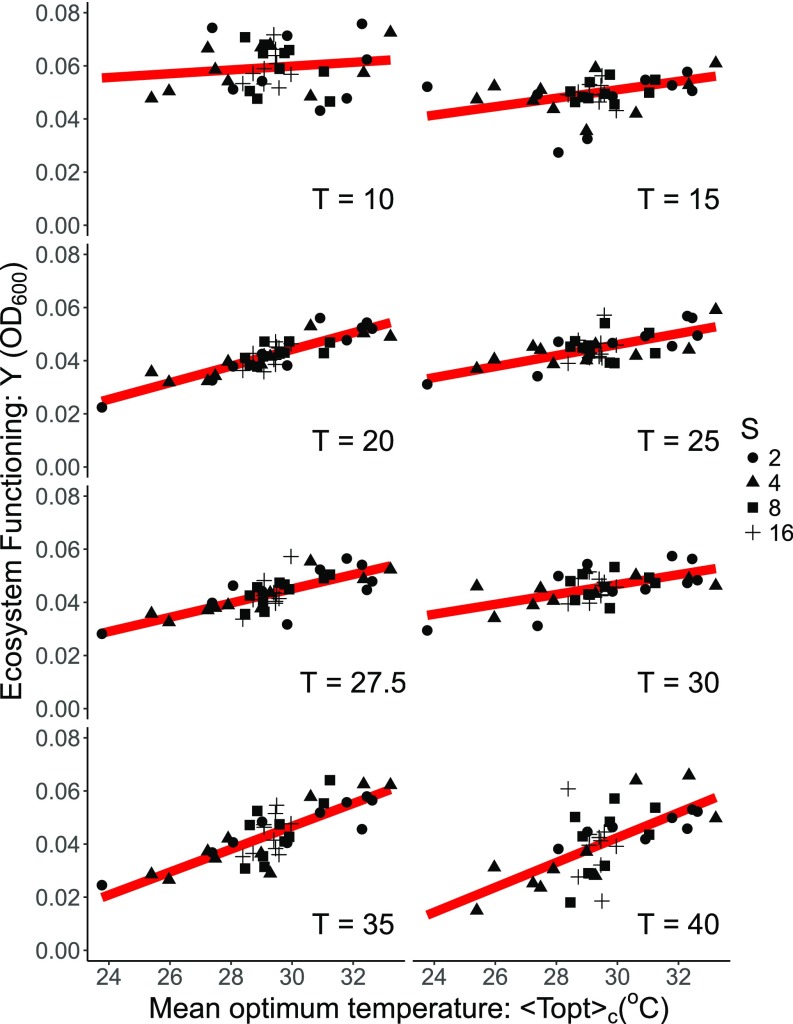
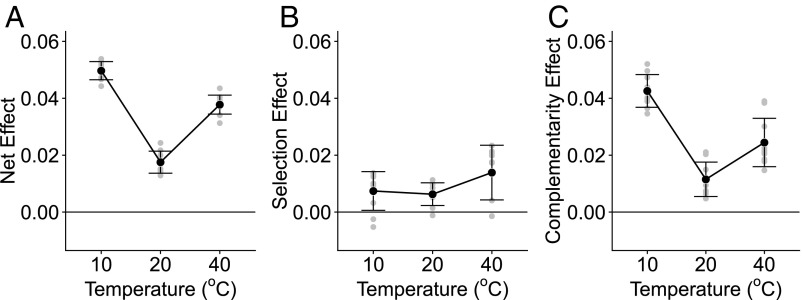
Global warming and the loss of biodiversity through human activities (e.g., land-use change, pollution, invasive species) are two of the most profound threats to the functional integrity of the Earth's ecosystems. These factors are, however, most frequently investigated separately, ignoring the potential for synergistic effects of biodiversity loss and environmental warming on ecosystem functioning. Here we use high-throughput experiments with microbial communities to investigate how changes in temperature affect the relationship between biodiversity and ecosystem functioning. We found that changes in temperature systematically altered the relationship between biodiversity and ecosystem functioning. As temperatures departed from ambient conditions the exponent of the diversity-functioning relationship increased, meaning that more species were required to maintain ecosystem functioning under thermal stress. This key result was driven by two processes linked to variability in the thermal tolerance curves of taxa. First, more diverse communities had a greater chance of including species with thermal traits that enabled them to maintain productivity as temperatures shifted from ambient conditions. Second, we found a pronounced increase in the contribution of complementarity to the net biodiversity effect at high and low temperatures, indicating that changes in species interactions played a critical role in mediating the impacts of temperature change on the relationship between biodiversity and ecosystem functioning. Our results highlight that if biodiversity loss occurs independently of species' thermal tolerance traits, then the additional impacts of environmental warming will result in sharp declines in ecosystem function.

Keywords: biodiversity; ecosystem function; microbial ecology; traits; warming.


Conflict of interest statement

The authors declare no conflict of interest.

Figures

Fig. 1.
Fig. 1.
Thermal tolerance curves of the 24 bacterial taxa. (A) Comparison of the fitted thermal tolerance curves of population growth rate, r, for the 24 taxa quantified using the Sharpe–Schoofield equation (Materials and Methods). (B) The coefficient of variance (CV) in r among the 24 taxa at each assay temperature demonstrates an exponential increase in CV with rising temperature (y = 21.98 e0.04x, r2= 0.94, F1,6= 96.22, P < 0.001). (C) Pooled thermal tolerance curve fitted using the Sharpe–Schoofield equation (SI Appendix, Table S1) to the mean growth rate across all 24 taxa at each assay temperature demonstrates a marked decline in average performance above 27.5 °C, which coincides with the temperature at which the CV of population growth rate rapidly increases (quasi-r2= 0.92 of the fitted model).
Fig. 2.
Fig. 2.
Effects of temperature on the relationship between species richness and ecosystem functioning. (A) Effects of temperature on the relationship between species richness and ecosystem functioning. A power function was used to analyze the coupling between ecosystem functioning and species richness: log10Y(S) = b (log10Slog10Sc) + log10Y(Sc). Ecosystem functioning was quantified as the community yield (Y) in the stationary phase of community growth, species richness (S) was centered around the mean, Sc, so that the intercept of the linear relationship between log10Y and log10S gives the log10Y at the average level of S, and b is the exponent that captures the shape of the diversity–functioning relationship (SI Appendix, section 1.3). Analyses demonstrate major shifts in the relationship between log10Y and log10S with temperature. (B) The intercept of the diversity–functioning relationship, log10Y(Sc), declined with rising temperature. The red line denotes the fit of a linear model to the relationship between log10Y(Sc) and temperature (log10Y(Sc)= −0.01 × −1.22, r2 = 0.81, P < 0.01). (C) Changes in the exponent reveal a U-shaped relationship with temperature, with the highest values at low and high temperatures. The red solid line represents the fit of a second-order polynomial model (y = 0.0008x2 − 0.04x + 0.63, r2= 0.85, P < 0.01).
Fig. 3.
Fig. 3.
Compositional turnover linked to variance in thermal tolerance traits. (A) Nonmetric multidimensional scaling ordination of the microbial communities in the high-diversity treatments (S = 24) at high (red), low (blue), and ambient (yellow) temperatures (k = 4, stress = 0.01). The brown arrows and letters correspond to “species scores” and indicate the correspondence of each species with the primary axes of variation. The colored points and ellipses denote “site scores,” where each point is a replicate community and its correspondence with the axes of variation. Ellipses give the 95% CI around the centroid of each treatment—nonoverlapping ellipses suggest significant divergence in community composition between treatments (see SI Appendix, Tables S3 and S4 for results of PERMANOVA). (B) Relationship between the species scores extracted from NMDS1 and the Topt of each species. The black line represents the fit of a linear model (r2= 0.28, P = 0.03).
Fig. 4.
Fig. 4.
Linking thermal traits to the impacts of warming and species loss on ecosystem functioning. Coupling between ecosystem functioning (community yield) and the community-mean optimum temperature <Topt>c, derived from the species used to seed each replicate community. Analyses reveal that <Topt>c becomes an increasingly important predictor of ecosystem function as temperature rises, demonstrating that temperature-driven changes in the diversity–functioning relationship were mediated by variability in thermal traits. The red lines represent the fitted curves derived from the linear mixed-effect model. The different point shapes represent the level of species richness (S).
Fig. 5.
Fig. 5.
Partitioning the impacts of warming on ecosystem functioning into selection and complementarity effects. (A) Net effect (NE) of biodiversity on functioning at each treatment temperature. (B) Selection effect (SE) of biodiversity at each treatment temperature. (C) Complementarity effect (CE) of biodiversity at each treatment temperature. Gray circles represent the value of each replicate and the black circles and the error bars indicate the mean and the SD for each treatment. Values over the zero line indicate a positive NE, SE, or CE on ecosystem function.

References

    1. Cardinale BJ, et al. Biodiversity loss and its impact on humanity. Nature. 2012;486:59–67. - PubMed
    1. Hooper DU, et al. A global synthesis reveals biodiversity loss as a major driver of ecosystem change. Nature. 2012;486:105–129. - PubMed
    1. Loreau M, Mouquet N, Gonzalez A. Biodiversity as spatial insurance in heterogeneous landscapes. Proc Natl Acad Sci USA. 2003;100:12765–12770. - PMC - PubMed
    1. Awasthi A, Singh M, Soni SK, Singh R, Kalra A. Biodiversity acts as insurance of productivity of bacterial communities under abiotic perturbations. ISME J. 2014;8:2445–2452. - PMC - PubMed
    1. Tilman D, Downing J, Wedin D. Does diversity beget stability-reply. Nature. 1994;371:114.

Publication types

LinkOut - more resources