Distinct roles of VE-cadherin for development and maintenance of specific lymph vessel beds
- PMID: 30297530
- PMCID: PMC6236332
- DOI: 10.15252/embj.201798271
Distinct roles of VE-cadherin for development and maintenance of specific lymph vessel beds
Abstract
Endothelial cells line blood and lymphatic vessels and form intercellular junctions, which preserve vessel structure and integrity. The vascular endothelial cadherin, VE-cadherin, mediates endothelial adhesion and is indispensible for blood vessel development and permeability regulation. However, its requirement for lymphatic vessels has not been addressed. During development, VE-cadherin deletion in lymphatic endothelial cells resulted in abortive lymphangiogenesis, edema, and prenatal death. Unexpectedly, inducible postnatal or adult deletion elicited vessel bed-specific responses. Mature dermal lymph vessels resisted VE-cadherin loss and maintained button junctions, which was associated with an upregulation of junctional molecules. Very different, mesenteric lymphatic collectors deteriorated and formed a strongly hyperplastic layer of lymphatic endothelial cells on the mesothelium. This massive hyperproliferation may have been favored by high mesenteric VEGF-C expression and was associated with VEGFR-3 phosphorylation and upregulation of the transcriptional activator TAZ Finally, intestinal lacteals fragmented into cysts or became highly distended possibly as a consequence of the mesenteric defects. Taken together, we demonstrate here the importance of VE-cadherin for lymphatic vessel development and maintenance, which is however remarkably vessel bed-specific.
Keywords: VE‐cadherin; YAP/TAZ; lymph vessels; lymphatic valves; vascular heterogeneity.
© 2018 The Authors.
Figures

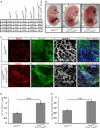
Developmental loss of VE‐cadherin leads to severe edema. Fetuses of the genotypes listed in the top row were analyzed at the developmental stages in the first column. Numbers in brackets denote embryos with signs of edema. Last column lists the percentage of viable fetuses in the VE‐cadherin‐deleted cohort.
Fetuses were explanted at day E14.5. Arrowheads indicate prominent edema along the back. The images are representative for 42 (Cdh5 lox/lox) and 25 (Cdh5 lox/lox ; Prox1‐CreER T2) analyzed animals.
Skin wholemount preparations stained for PROX1, PECAM1, and VEGFR‐3. Maximum intensity projections (MIPs) of tiled confocal stacks (Cdh5 lox/lox 2,075 × 2,075 μm, z = 50 μm; Cdh5 lox/lox; Prox1‐CreER T2 3,765 × 3,765 μm, z = 61 μm). Scale bars = 100 μm. The data are representative for six (Cdh5 lox/lox) and six (Cdh5 lox/lox; Prox1‐CreER T2) analyzed animals from three litters.
Enumeration of the PROX1‐expressing (PROX1+) nuclei in three different VE‐cadherin‐deleted wholemount preparations analogous to Fig 1B. Nuclei were counted in a MIP corresponding to an area of 1.5 mm2 and normalized to the number of nuclei in Cdh5 lox/lox control preparations.
The area covered by lymphatic vessels was determined in the samples evaluated in (D) and is depicted as relative area compared to Cdh5 lox/lox controls. The calculations and measurements were obtained from three animals and three confocal stacks per biological group. PROX1‐positive nuclei were counted using the particle analysis tool of Fiji.

- A–H
(A, B, E, F) Overview MIPs of ear skin wholemount preparations immunostained for the indicated antigens. VEC, VE‐cadherin; PRX, PROX1. (C, D, G, H) Magnified views of the areas in the red boxes in (A, E). Areas delimited by the stippled yellow boxes in (C) and (G) are enlarged in the insets (yellow solid boxes). Yellow arrows indicate widened lumen and yellow arrowheads denote oak leaf‐shaped LECs with discontinuous junctions. Scale bars in (A and E) correspond to 100 μm and in (C and G) to 50 μm. The data are representative for six (Cdh5 lox/lox) and five (Cdh5 lox/lox; Prox1‐CreER T2) analyzed animals from two litters.

- A–L
VE‐cadherin deletion was initiated either in newborn pups (A, B, E, F) by two applications of 4‐OHT at days P2 and P4 or in mice at 11 weeks (C, G) and 42 weeks (D, H) of age (three applications of Tamoxifen at 2‐day intervals via oral gavage). Ear skins were prepared 6 weeks (A, B, E, F) or 5 weeks (C, D, G, H) after induction and immunostained for the indicated proteins. Shown are MIPs of confocal tile scans (approximately 750 × 750 μm) covering 40 μm in depth. White arrows in (F) highlight distorted and partially fragmented lymphatic vessels and white arrowheads denote aberrantly pointed vessels (F). (I–L) Lymphatic valves in the dermis of the ear were maintained for 5 weeks despite deletion of VE‐cadherin at 11 weeks of age (yellow arrows in K, L). PEC1, PECAM1; PRX1, PROX1; VR3, VEGFR‐3. Scale bars correspond to 100 μm. The data represent wholemount stainings from six (A, E), five (B, F), six (C, G, K, L), three (D, H), and six (I, J) analyzed animals.

- A–F
Deletion of VE‐cadherin was induced in mice at various age [4 weeks (A), neonate (B), 6 month (C, D, E), or 1 year (F)] by either two applications of 4‐OHT at days P2 and P4 (neonates) or three applications of Tamoxifen at 2‐day intervals via oral gavage (all other ages). The mesentery was prepared as indicated 4, 6, 8, or 11 weeks later and the wholemount preparations were immunostained for the proteins specified in color (left). (B) Inset in top panel shows a magnification of the area outlined by the white dashed line (for further magnification see Fig EV1A and B). Arrows indicate the previous position of lymphatic valves; white arrowheads indicate PECAM1+ capillaries supplying the intestinal fat tissue lining the vessels (magnified in Fig EV1C); yellow arrowheads denote island of LECs that display intracellular VEGFR‐3 staining. (C) Arrows denote LECs that have converted from growth as tubes to sheets; white arrowheads, thinning of lymphatic vessels; yellow arrowheads, aberrant sprouting of LECs. The area outlined by a white box is depicted magnified in (D) and provides details on LECs growing as a sheet of cells. (E) Formation of ectopic sprouts from the valve area of degenerating lymphatic vessels. (F) Fully deteriorated lymphatic vessel with emanating sprouts that initiate sheet‐like growth. PEC1, PECAM1; PRX1, PROX1; VR3, VEGFR‐3. Scale bars = 100 μm. The data represent n = 5 (A), n = 5 (B), n = 3 (C–E), and n = 6 (F) animals.

Magnification of the area outlined by the white dashed line in Fig 4B, showing an island of LECS growing as a flat cell sheet.
Higher magnification of the indicated area from (A) highlighting the loss of VEGFR‐3 cell surface expression and concentration of VEGFR‐3 close to the cell nucleus.
High magnification images of blood capillaries within the adipose tissue lining large vessels adjacent to mesenteric lymphatic vessels; white arrowheads, larger caliber blood vessels; yellow arrowheads, blood vascular capillaries.

- A–D
Overview demonstrating lymphatic hyperplasia, the original position of the lymphatic vessel giving rise to the massive LEC growth is marked by a string of asterisks (A). White dashed boxes in (A) delineate the area that is depicted at higher magnification in (B). White arrowheads in (B) denote PROX1‐negative, isolated cells that stained strongly positive for intracellularly localized PECAM1. (C) Example of sheet‐like outgrowth of LECs. Yellow arrowheads in (B) and (C) identify islands at the border of LEC sheets that display reduced VEGFR‐3 expression. Dashed boxes in (C) delineate the area shown magnified in (D). Arrows in (D) indicate open cell–cell contacts between LECs. Scale bars = 100 μm (A–C) or 50 μm (D).

- A–E
Deletion of VE‐cadherin was induced in mice at various ages [neonatal (C), 16 weeks (D) or 1 year (E)] by either two applications of 4‐OHT at days P2 and P4 (neonates) or three applications of Tamoxifen at 2‐day intervals via oral gavage (all other ages). Control mice of the same age were subjected to an identical regimen (A, B). Intestinal wholemount preparations of the jejunum and ileum were generated 5–8 weeks after Tamoxifen induction and immunostained for the indicated proteins, scale bars = 100 μm. The data represent wholemount stainings from three (D), five (B, E), and six (A, C) animals analyzed for each genotype.

- A–E
Deletion of VE‐cadherin was induced in neonatal mice at postnatal day 2 by two applications of 4‐OHT at days P2 and P4. The intestinum was prepared 5 days (B; n = 3), 2 weeks (C; n = 3), 4 weeks (D; n = 3), or 6 weeks (A, n = 6; E, n = 5) later, and wholemount preparations were immunostained for the specified proteins indicated in color (left). In contrast to control tissue (A), deletion of VE‐cadherin (B–E) in LECs caused progressive degeneration of intestinal lacteals with formation of disconnected cystic clusters of LECs (C–E, arrows). Arrowheads in (D) and (E) point toward strongly dilated lacteals at later progression. Shown are maximum intensity projections of confocal stacks. Scale bars = 100 μm. The data are representative for the indicated numbers of analyzed animals from five litters.

- A–E
Deletion of VE‐cadherin was induced in neonatal mice at postnatal day 2 by two applications of 4‐OHT at days P2 and P4. The mesentery was prepared 5 days (B; n = 3), 2 weeks (C; n = 3), 4 weeks (D; n = 3), or 6 weeks (A, n = 6; E, n = 5) later, and wholemount preparations were immunostained for the specified proteins indicated in color (left). In contrast to control tissue (A), deletion of VE‐cadherin (B–E) in LECs resulted in progressive loss of vessel integrity, characterized by vessel fragmentation (B–E, white arrows) and distension (B–E, white arrowheads) with concomitant hyperproliferation and formation of sheet‐like clusters of LECs at later stages (E, yellow asterisks). Shown are maximum intensity projections of confocal stacks. PEC, PECAM1; PRX, PROX1; VR3, VEGFR‐3. Scale bars = 100 μm. The data are representative for the indicated numbers of analyzed animals from five litters.

- A–C
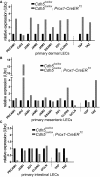
Dermal, mesenteric and intestinal LECs of control (Cdh5 lox/lox) and VE‐cadherin‐deleted (Cdh5 lox/lox; Prox1‐CreER T2) mice were isolated using FACS sorting as described in Appendix Fig S6 and total RNA was extracted immediately after sorting. Because of the limited number of mesenteric LECs, total RNA preparations from 12 control and three VE‐cadherin‐deleted animals were pooled to provide sufficient yield for the reverse transcription of equal amounts of total RNA. The difference in animal numbers resulted from the strong hyperplasia of mesenteric LECs in Cdh5 lox/lox ; Prox1‐CreER T2. For reverse transcription, 0.6 μg of total RNA from dermal LECs (A), 0.55 μg of total RNA from mesenteric LECs (B), and 1.0 μg of total RNA from intestinal LECs (C) were used. Expression of junctional molecules as well as YAP and TAZ was determined by quantitative real‐time (qRT)–PCR using specific TaqMan probes. Pooled samples were measured in triplicate and diagrams are representative of pooled RNA from 12 control and three VE‐cad‐deficient animals. Relative expression (ΔΔC t) of target genes was normalized to the control transcript UBC.

- A–D
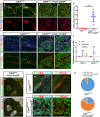
Deletion of VE‐cadherin was induced in adult mice (13 weeks) and EdU incorporation into PROX1‐positive cell nuclei was determined 6 weeks after Tamoxifen administration. Shown are mesenteric wholemount stainings prepared from control (A, B; n = 3) or VE‐cadherin‐deleted mice (C, D; n = 3). (B) and (D) show a magnification of the area outlined by the white dashed line in (A) and (C). Antigens shown in addition to the EdU incorporation are depicted in color on the left side of the first panel. PEC, PECAM1; PRX1, PROX1. Scale bars = 100 μm.
- E
Enumeration of EdU‐positive LECs. The measurements were obtained from three animals and nine confocal stacks per biological group. PROX1‐positive nuclei were counted using the particle analysis tool of Fiji. Co‐localization of PROX1 and EdU was determined manually in each confocal plane, using the cell counting tool of Fiji. The data represent mean ± SD. ****P ≤ 0.0001. Two‐tailed unpaired Student's t‐test.
- F–I
Aberrantly enhanced VEGFR‐3 phosphorylation in VE‐cadherin‐deficient mesenteric LECs of 6 weeks old mice that had received 4‐OHT injections at P2 and P4. Shown are wholemount immunostainings for the antigens shown on the left in color. pVR3, pVEGFR‐3, PRX1, PROX1; PEC1, PECAM1. (G) and (I) show a magnification of the area outlined by the white dashed box in (F) and (H). Scale bars = 50 μm. The data are representative for 6 (Cdh5 lox/lox) and 5 (Cdh5 lox/lox; Prox1‐CreER T2) analyzed animals from two litters.
- J
Dermal, mesenteric and intestinal tissue pieces of 15‐week‐old control (Cdh5 lox/lox) mice were dissociated and total RNA was extracted immediately. For reverse transcription, 2.0 μg of total RNA was used for each tissue type. Expression of lymphangiogenic factors VEGF‐C and VEGF‐D was determined by quantitative real‐time (qRT)–PCR using specific TaqMan probes. Samples were measured in triplicate and diagrams are representative for three independent experiments. Relative expression (ΔΔC t) of target genes was normalized to the control transcript UBC.
- K, L
Loss of VEGFR‐3 surface expression on mesenteric LECs growing in cell sheets was associated with concomitant upregulation of VEGFR‐2, scale bars = 50 μm. The data are representative for four analyzed animals from two litters.VR2, VEGFR‐2; VR3, VEGFR‐3, PRX1, PROX1.
- M, N
Expression of the transcriptional co‐activators YAP and TAZ was analyzed in mesenteric wholemount preparations 8 weeks after induction of VE‐cadherin deletion at 1 year of age by three doses of Tamoxifen. Respective antigens depicted are indicated on the top of the panels in color. The highly related molecules YAP and TAZ were both recognized by the antibody used and are therefore collectively abbreviated Y/T. Scale bars = 100 μm.
- O
PROX1+ nuclei (red in panels M and N) were classified into YAP/TAZ low‐, intermediate‐, and high‐expressing cells, according to their relative YAP/TAZ immunoreactivity in wild‐type and VE‐cadherin‐deleted mice. The data were obtained from three animals per biological group. PROX1‐positive and YAP/TAZ‐positive nuclei were counted manually. The pie charts represent mean values.

- A, B
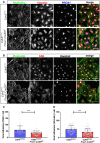
Primary dermal LECs were isolated as described in Appendix Fig S8A. PdLECs were used for up to four passages and control and VE‐cadherin‐deleted pdLECs had been cultured for the same number of passages. Cells were seeded at a density of 2.5 × 10⁴ cells on gelatine‐coated 15 mm glass coverslips and co‐stained after 3 days of culture for the actin cytoskeleton (Phalloidin) and either vinculin (A) or FAK (B) for the visualization of focal adhesions. PROX1 staining in (A) identifies LECs, and nuclei in (B) were counterstained with Hoechst. Scale bars correspond to 50 μm.
- C, D
Bar diagrams show the number of focal adhesions/cell, which were enumerated using Image J from the vinculin and FAK stainings shown in (A and B). Data are mean values + SEM derived from three cell lines and nine viewfields of 256 × 256 μm per biological group. ***P ≤ 0.001. Two‐tailed unpaired Student's t‐test.

Collective cell migration of VE‐cadherin‐deficient and control LECs was assessed in wound scratch assays. LECs were grown up to four passages and seeded at a density of 5 × 10⁴ cells on fibronectin‐coated 8‐well μ‐chamber slides (growth area 0.22 cm2); scale bars = 500 μm.
The area of the zone denuded from cells is depicted in the curve diagram showing mean values ± SD of three individual experiments conducted in quadruplets. *P ≤ 0.01. Two‐tailed unpaired Student's t‐test.
References
-
- Broermann A, Winderlich M, Block H, Frye M, Rossaint J, Zarbock A, Cagna G, Linnepe R, Schulte D, Nottebaum AF, Vestweber D (2011) Dissociation of VE‐PTP from VE‐cadherin is required for leukocyte extravasation and for VEGF‐induced vascular permeability in vivo . J Exp Med 208: 2393–2401 - PMC - PubMed
Publication types
MeSH terms
Substances
LinkOut - more resources
Full Text Sources
Molecular Biology Databases
Miscellaneous

