. 2018 Oct 8;9(1):4116.
doi: 10.1038/s41467-018-06656-6.

SWI/SNF catalytic subunits' switch drives resistance to EZH2 inhibitors in ARID1A-mutated cells

Affiliations

SWI/SNF catalytic subunits' switch drives resistance to EZH2 inhibitors in ARID1A-mutated cells

Shuai Wu et al. Nat Commun. .

Abstract

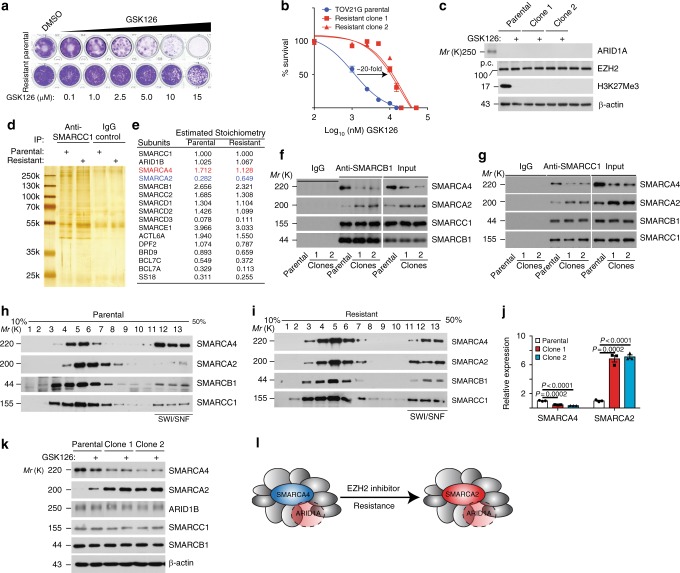
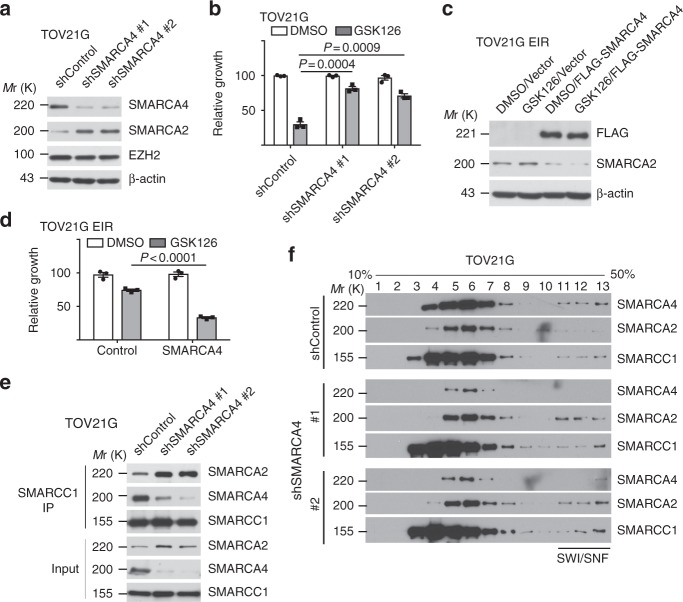
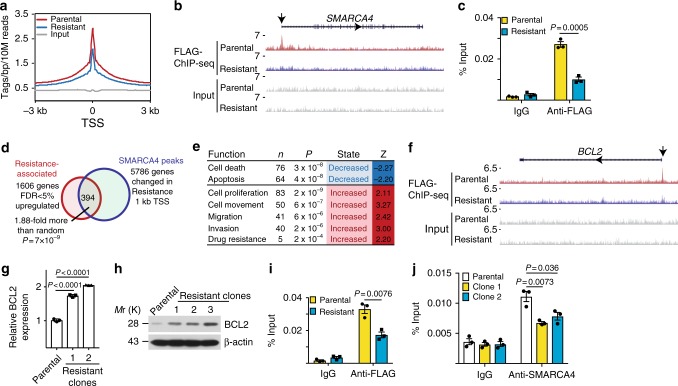
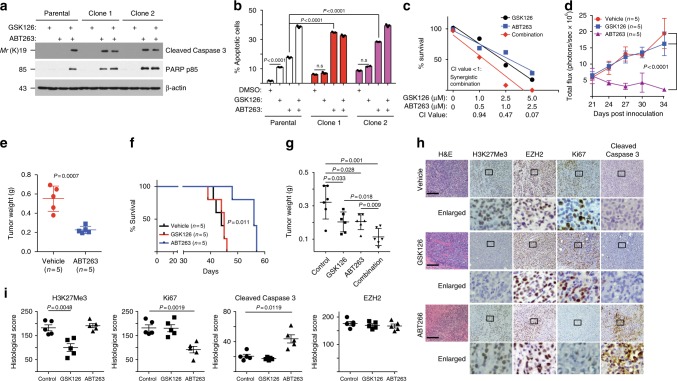
Inactivation of the subunits of SWI/SNF complex such as ARID1A is synthetically lethal with inhibition of EZH2 activity. However, mechanisms of de novo resistance to EZH2 inhibitors in cancers with inactivating SWI/SNF mutations are unknown. Here we show that the switch of the SWI/SNF catalytic subunits from SMARCA4 to SMARCA2 drives resistance to EZH2 inhibitors in ARID1A-mutated cells. SMARCA4 loss upregulates anti-apoptotic genes in the EZH2 inhibitor-resistant cells. EZH2 inhibitor-resistant ARID1A-mutated cells are hypersensitive to BCL2 inhibitors such as ABT263. ABT263 is sufficient to overcome resistance to an EZH2 inhibitor. In addition, ABT263 synergizes with an EZH2 inhibitor in vivo in ARID1A-inactivated ovarian tumor mouse models. Together, these data establish that the switch of the SWI/SNF catalytic subunits from SMARCA4 to SMARCA2 underlies the acquired resistance to EZH2 inhibitors. They suggest BCL2 inhibition alone or in combination with EZH2 inhibition represents urgently needed therapeutic strategy for ARID1A-mutated cancers.


Conflict of interest statement

The authors declare no competing interests.

Figures

Fig. 1
Fig. 1
The SWI/SNF catalytic subunits’ switch from SMARCA4 to SMARCA2 accompanies the de novo resistance to EZH2 inhibitors. a, b Parental and GSK126-resistant TOV21G cells were subjected to colony formation (a) to generate dose response curves to GSK126 (b). Arrow points to an ~20-fold increase in GSK126 IC50 in the resistant clones. c Expression of ARID1A, EZH2, H3K27Me3, and a load control β-actin in the indicated cells passaged with or without 5 μM GSK126 for 3 days determined by immunoblot. p.c. positive control ARID1A wild-type RMG1 cells. d, e Immunoprecipition of core SWI/SNF subunit SMARCC1 was separated on a silver stained gel (d), or subjected to LC-MS/MS analysis e. Stoichiometry of the SWI/SNF subunits identified was normalized to SMARCC1. f, g Co-immunoprecipitation analysis using antibodies to core subunit SMARCC1 (f) or SMARCB1 (g) show the switch from SMARCA4 to SMARCA2 in resistant cells. An isotype-matched IgG was used as a control. h, i Sucrose sedimentation (10–50%) assay of SWI/SNF complex from parental (h) or resistant cells (i). j, k Expression of SMARCA4 and SMARCA2 in the indicated cells determined by qRT-PCR (j) or immunoblot (k). l A schematic model: the catalytic subunits from SMARCA4 to SMARCA2 accompanies the de novo resistance to EZH2 inhibitors. Data represent mean ± S.E.M. of three independent experiments (ac, fk). P-value was calculated via two-tailed t-test
Fig. 2
Fig. 2
Downregulation of SMARCA4 drives the observed switch to SMARC2 in the SWI/SNF complex. a, b SMARC4 knockdown in parental ARID1A-mutated TOV21G cells increases SMARCA2 levels (a) and desensitizes parental cells to GSK126 treatment (5 μM) (b). c, d Ectopic SMARCA4 expression in resistant cells decreases SMARCA2 levels (c) and resensitizes resistant cells to GSK126 (10 μM) (d). e Co-immunoprecipitation analysis using an antibody to core subunit SMARCC1 shows the switch of the catalytic subunit from SMARCA4 to SMARCA2 in TOV21G cells with or without SMARCA4 knockdown. f Sucrose sedimentation (10–50%) assay of SWI/SNF complex from TOV21G cells with or without SMARCA4 knockdown. Data represent mean ± S.E.M. of three independent experiments (ae). P-value was calculated via two-tailed t-test
Fig. 3
Fig. 3
SMARCA4 loss promotes resistance to EZH2 inhibitors by upregulating an anti-apoptosis gene signature. a ChIP-seq profiles of SMARCA4 in parental and resistant cells. TSS: transcription starting sites. b ChIP-seq tracks of SMARCA4 on its own promoter region in endogenously FLAG-tagged parental and resistant cells. Arrow points to the loss of SMARCA4 binding in its own promoter region. c ChIP-qPCR validation of a decrease of SMARCA4 binding to its own promoter. d Venn diagram showing the genome-wide overlap analysis between SMARCA4 ChIP-seq and genes upregulated in RNA-seq in parental and resistant cells. e Top pathways enriched among the genes identified in d. f ChIP-seq tracks of SMARCA4 on the BCL2 promoter region in endogenously FLAG-tagged parental and resistant cells. g, h qRT-PCR (g) and immunoblot (h) of BCL2 levels in parental and resistant cells. i, j ChIP-qPCR validation of a decrease in SMARCA4 binding on the BCL2 promoter in resistant cells using antibodies against endogenously tagged FLAG (i) or endogenous SMARCA4 (j). Data represent mean ± S.E.M. of three independent experiments (c, gj). P-value was calculated via two-tailed t-test
Fig. 4
Fig. 4
ABT263 overcomes de novo resistance to the EZH2 inhibitor. a, b Parental and resistant TOV21G cells were treated with 0.5 μM ABT263, 5 μM GSK126, or in combination. Expression of markers of apoptosis were analyzed by immunoblot (a) or quantified by Annexin V staining (b). c Synergy analysis between GSK126 and ABT263 in TOV21G cells. df ABT263 regresses the established EZH2 inhibitor-resistant TOV21G orthotopically transplanted tumors (d, e) and improves the survival of the tumor-bearing mice (f) in vivo. g GSK126 and ABT263 are synergistic in suppressing the growth of the xenograft ovarian tumors formed by primary OCCC cultures. h, i Immunohistochemical staining for EZH2, H3K27me3, Ki67, and cleaved caspase 3 using consecutive sections of the dissected tumors from the indicated treatment groups (h). Bar = 100 μM. Histological score (H score) calculated for the indicated staining (i). Data represent mean ± S.E.M. of three independent experiments (ac). P-value was calculated via two-tailed t-test

Similar articles

Cited by

References

    1. Kadoch C, et al. Proteomic and bioinformatic analysis of mammalian SWI/SNF complexes identifies extensive roles in human malignancy. Nat. Genet. 2013;45:592–601. doi: 10.1038/ng.2628. - DOI - PMC - PubMed
    1. Wiegand KC, et al. ARID1A mutations in endometriosis-associated ovarian carcinomas. N. Engl. J. Med. 2010;363:1532–1543. doi: 10.1056/NEJMoa1008433. - DOI - PMC - PubMed
    1. Jones S, et al. Frequent mutations of chromatin remodeling gene ARID1A in ovarian clear cell carcinoma. Science. 2010;330:228–231. doi: 10.1126/science.1196333. - DOI - PMC - PubMed
    1. Murakami R, et al. Exome sequencing landscape analysis in ovarian clear cell carcinoma shed light on key chromosomal regions and mutation gene networks. Am. J. Pathol. 2017;187:2246–2258. doi: 10.1016/j.ajpath.2017.06.012. - DOI - PubMed
    1. Wilson BG, Roberts CW. SWI/SNF nucleosome remodellers and cancer. Nat. Rev. Cancer. 2011;11:481–492. doi: 10.1038/nrc3068. - DOI - PubMed

Publication types

MeSH terms