. 2018 Oct 8;9(1):4144.
doi: 10.1038/s41467-018-06641-z.

Matrix mechanical plasticity regulates cancer cell migration through confining microenvironments

Affiliations

Matrix mechanical plasticity regulates cancer cell migration through confining microenvironments

Katrina M Wisdom et al. Nat Commun. .

Abstract

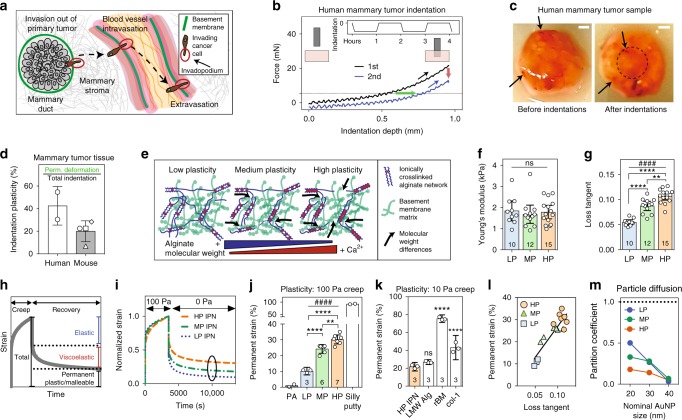
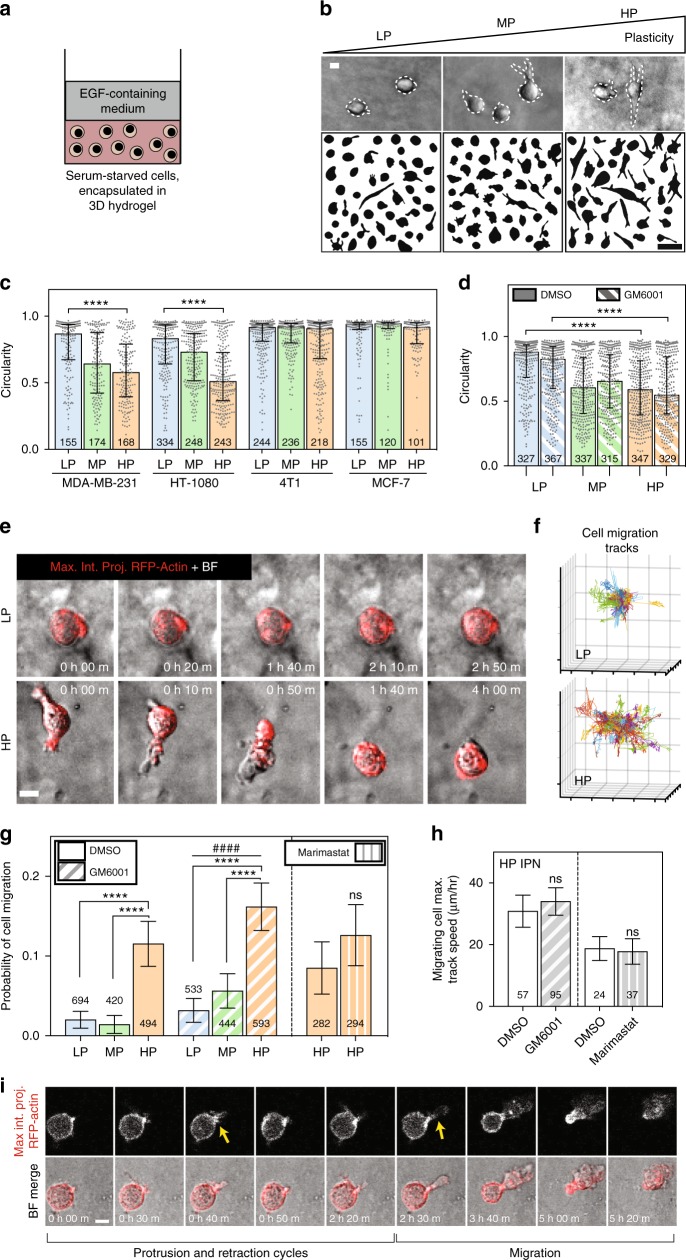
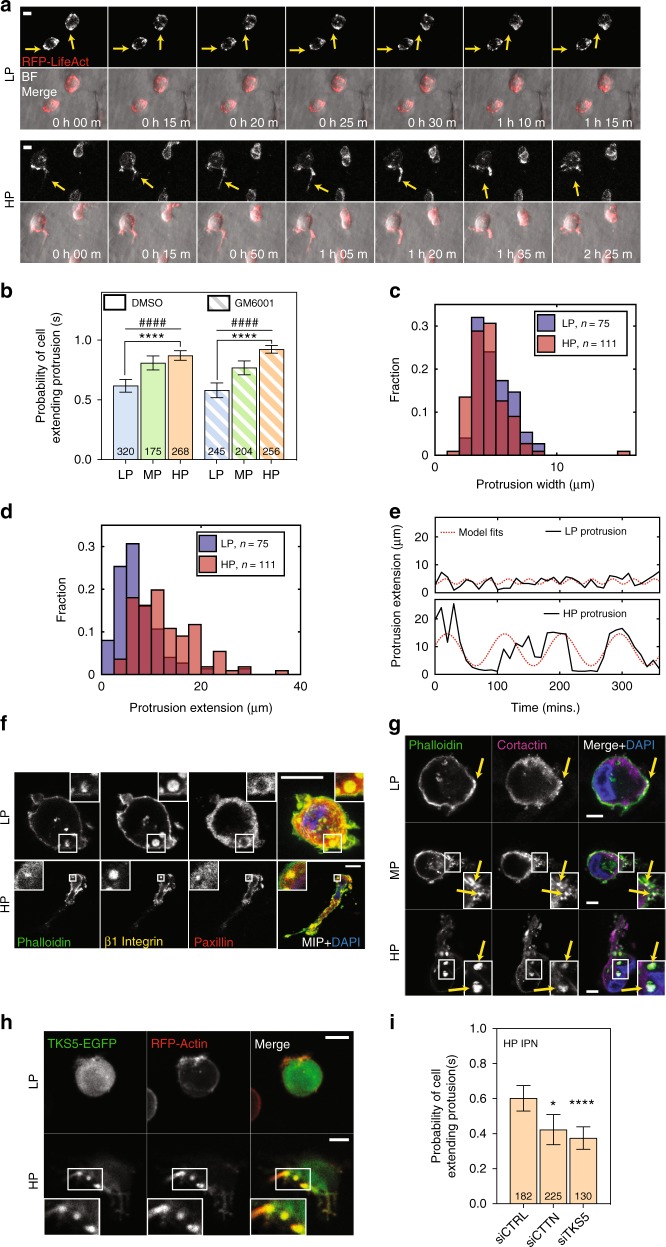
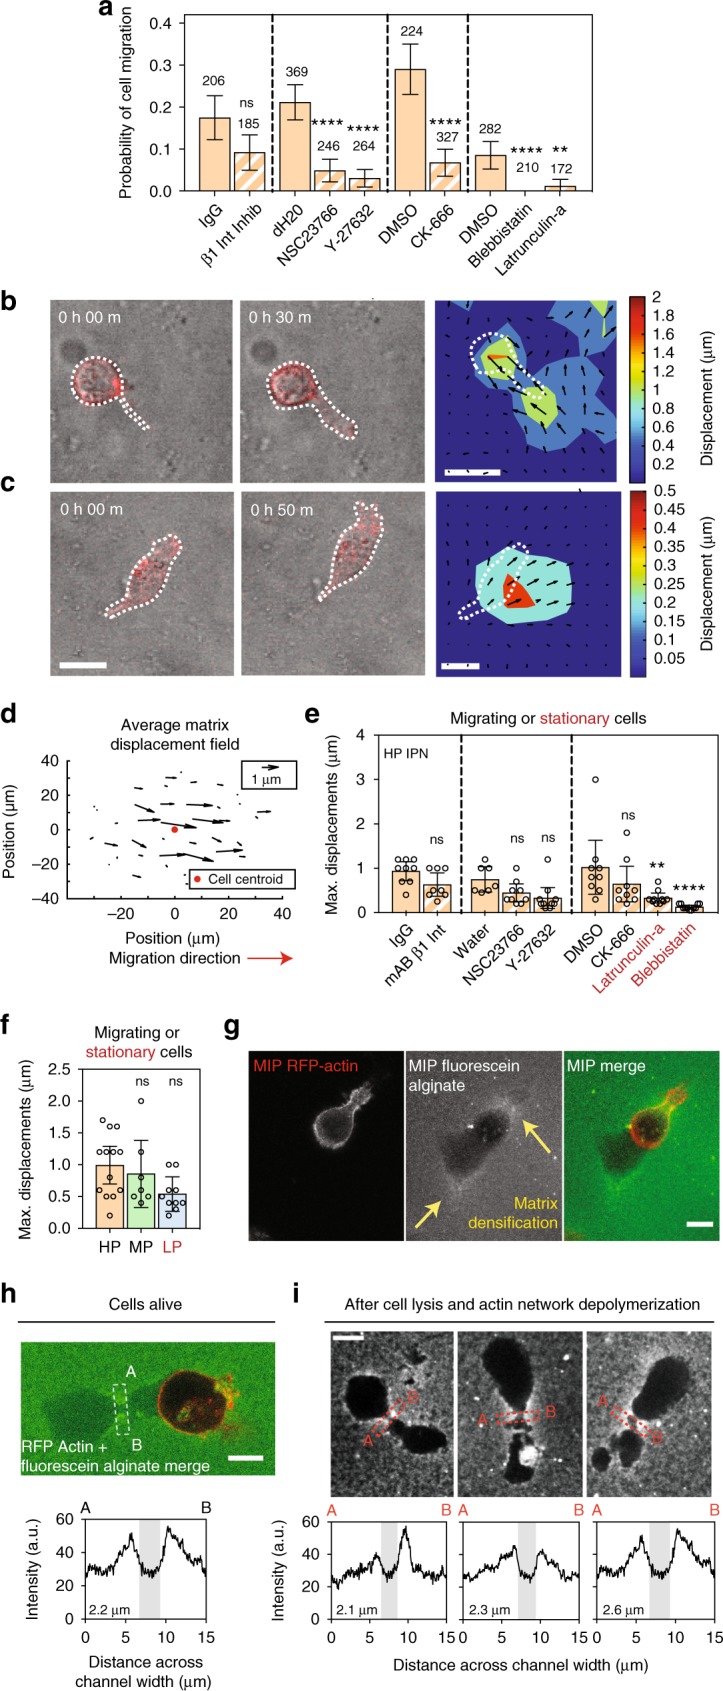
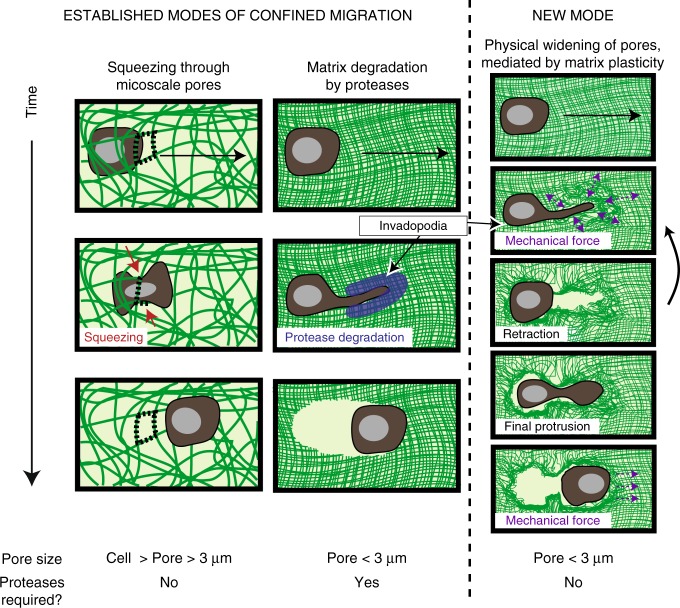
Studies of cancer cell migration have found two modes: one that is protease-independent, requiring micron-sized pores or channels for cells to squeeze through, and one that is protease-dependent, relevant for confining nanoporous matrices such as basement membranes (BMs). However, many extracellular matrices exhibit viscoelasticity and mechanical plasticity, irreversibly deforming in response to force, so that pore size may be malleable. Here we report the impact of matrix plasticity on migration. We develop nanoporous and BM ligand-presenting interpenetrating network (IPN) hydrogels in which plasticity could be modulated independent of stiffness. Strikingly, cells in high plasticity IPNs carry out protease-independent migration through the IPNs. Mechanistically, cells in high plasticity IPNs extend invadopodia protrusions to mechanically and plastically open up micron-sized channels and then migrate through them. These findings uncover a new mode of protease-independent migration, in which cells can migrate through confining matrix if it exhibits sufficient mechanical plasticity.


Conflict of interest statement

The authors declare no competing interests.

Figures

Fig. 1
Fig. 1
Mechanical plasticity of interpenetrating networks of alginate and reconstituted basement membrane matrix (IPNs) can be independently tuned. a Schematic depicting invasion of basement membranes (green) during invasion and metastasis. b Schematic depicting the indentation tests performed on human mammary tumor tissue, and the corresponding force vs. indentation depth curves (green arrow—permanently retained indentation; red arrow—drop in peak force during second indentation; dotted line—25% of initial peak force). Subplot shows indentation test profile. c Before and after images of an indented mammary tumor sample. Indentation region outlined by dotted circle, and discolored tissue regions indicated by black arrows. Scale bar is 1 mm. d Indentation plasticity measurements of human tumor (two specimens from a tumor sample) and mouse tumor specimens (one sample each from four separate mice). e Schematic of approach to tuning matrix plasticity in IPNs of alginate (blue) and reconstituted basement membrane (rBM) matrix (green). f, g Young’s moduli (f) and loss tangent (g) of the different IPN formulations. The differences in loss tangent indicated are significantly different (**P < 0.01, ****P < 0.0001, ANOVA; ns not significant), as is the increasing loss tangent across this series of IPNs (####P < 0.0001, Spearman’s rank correlation). h Schematic depicting the elastic, viscoelastic, and plastic (permanent) portions of a material response in a creep and recovery test. i Representative creep and recovery tests of IPNs. j Permanent strain of IPNs, polyacrylamide gels (PA), and silly putty from creep and recovery tests. Statistically significant differences are indicated (**P < 0.01, ****P < 0.0001, ANOVA), plasticity across the IPNs (####P < 0.0001, Spearman’s rank correlation). k Permanent strain of HP IPN, alginate hydrogel, rBM matrix, and col-1 gels from creep–recovery tests. Statistically significant differences compared to HP IPN are indicated (****P < 0.0001, ANOVA). In fk, bars indicate means and error bars indicate 95% confidence interval of the indicated biological replicates. l Permanent strain and loss tangent are correlated in the IPNs (R2 = 0.7953). m Partition coefficients for PEGylated gold nanoparticles of the indicated size encapsulated in IPNs for 4 days
Fig. 2
Fig. 2
Enhanced matrix plasticity promotes spreading and motility of cancer cells independent of proteases. a Schematic of experimental setup. b After 1 day in 3D culture, cells were imaged using bright field microscopy and cell outlines were traced. Example MDA-MB-231 cells and cell outlines shown. Top scale bar is 10 μm, and bottom scale bar is 50 μm. c Circularity was calculated for traces of cells from four different cell lines. Data shown are from one representative biological replicate experiment. d Cell circularity was also quantified for MDA-MB-231 cells in the presence of broad-spectrum protease inhibitor (10 μM GM6001) or vehicle-alone control. Data shown are from two pooled experiments each. The validity of comparing medians of pooled data sets was verified (Supplementary Tables 2 and 3). For c and d, bars indicate median circularity of number of cells indicated, error bars indicate interquartile range, and statistical tests compared medians (****P < 0.0001, Mann–Whitney). e Time-lapse microscopy was used to image RFP-LifeAct-transfected MDA-MB-231 cells stimulated with 50 ng mL−1 EGF. Maximum intensity projections of RFP-actin signal are shown merged with bright field images. Scale bar is 10 μm. f Representative 3D cell track reconstructions for cells in LP (n = 143) and HP (n = 114) IPNs. Grid size is 10 μm. g Probability of cell motility shown for LP, MP, and HP IPNs, with vehicle alone (DMSO) or protease inhibitor (10 μM GM6001 or 100 μM marimastat) added to the medium. Differences in mean probability of motility indicated are statistically significant (****P < 0.0001, Fisher’s exact). Probability of motility trends with plasticity for protease inhibitor studies (####P < 0.0001, χ2 test for trend). h Maximum speeds for motile cells in HP IPNs, with vehicle-alone and protease inhibitor conditions (t tests; ns not significant). For both g and h, graph displays the number of cells analyzed per condition, taken from R = 3–5 biological replicate experiments, bars indicate mean probabilities, and error bars indicate 95% confidence intervals. i A representative cell in HP IPN exhibiting protrusion and retraction cycles prior to migrating. Scale bar is 10 μm
Fig. 3
Fig. 3
MDA-MB-231 cells in high plasticity matrices extend invadopodia protrusions. a RFP-LifeAct MDA-MB-231 cells were imaged for 12 h using time-lapse confocal fluorescence microscopy. Transient actin-rich spots were observed in all IPNs (yellow arrows, top), but in HP IPNs, these spots often elongated into oscillatory, actin-rich protrusions (yellow arrows, bottom). Scale bar is 10 μm. b Probability of a cell extending one or more protrusions in LP, MP, and HP IPNs, with either vehicle alone or protease inhibitor (10 μM GM6001) added to the medium. Graph displays the number of cells per condition, taken from R = 3–5 biological replicate experiments. Bars indicate mean probabilities and error bars indicate 95% confidence intervals. Differences in protrusivity as indicated are statistically significant (****P < 0.0001, Fisher’s exact). Probability of extending a protrusion also trends with plasticity (####P < 0.0001, χ2 tests for trend). c and d Histograms of extensions and widths of cell protrusions in LP and HP IPNs. Includes number of cells indicated per condition, pooled from R = 3 biological replicate experiments each. e Tracings of protrusion lengths, for one cell each in LP and HP IPNs, over time during a 6 h timeframe, plotted alongside a sinusoidal fit. fh Confocal immunofluorescence imaging was used to investigate localization of indicated proteins. Main panel scale bar is 10 μm. f and g Imaging of indicated staining on cryosections of MDA-MB-231 cells encapsulated in IPNs for 1 day. In f, main image shows merged maximum intensity projection (MIP) and inset (1.5× zoom for LP and 4× zoom for HP) shows merged image on one z-plane.  In g, inset is 2× zoom. h Live imaging of actin (RFP-LifeAct) and TKS5 (TKS5-EGFP). Inset is 1.5× zoom. i Probability of a cell extending one or more protrusions, for cells transfected with control siRNA, siRNA targeting cortactin (siCTTN), or siRNA targeting TKS5 (siTKS5)
Fig. 4
Fig. 4
In highly plastic ECM, cell-generated forces displace the matrix plastically to facilitate invasion and migration. a Probability of cell migration, with the indicated vehicle alone or inhibitor, added to the media. Drug/antibody concentrations used to inhibit/block respective pathways were: 1 μg mL−1 monoclonal β1 integrin-blocking antibody (β1 integrin), 70 μM NSC23766 (Rac1), 10 μM Y-27632 (ROCK), 100 μM CK-666 (Arp 2/3), 50 μM Blebbistatin (myosin II), and 2.5 μM Latrunculin-a (F-actin). Cells from R = 3 biological replicate experiments, bars indicate mean probabilities, and error bars indicate 95% confidence intervals. b, c Images from confocal time-lapse studies of representative RFP-LifeAct MDA-MB-231 cells, encapsulated with fluorescent beads and stimulated with 50 ng mL−1 EGF, depicting b, a cell extending a protrusion, and c, a cell migrating. Bead displacements obtained from a single z-plane and time points shown were used to inform models of the matrix displacement field, which is superimposed over a heat map illustrating displacement magnitudes and directions as calculated. Scale bar is 20 μm. d Average matrix displacement map, which incorporates information from N = 16 cells from R = 3 biological replicate experiments. All centroids were located at the red indicator, and all maps were rotated such that the cells migrated to the right. e, f Maximum bead displacements observed around migrating cells for conditions in which cell migration was observed, and around stationary cells when cell migration was absent. e Maximum bead displacements around cells in HP IPNs for indicated conditions. Statistically significant differences are indicated (**P < 0.01, ****P < 0.0001, ANOVA; ns not significant). f Maximum bead displacements around cells in HP, MP, and LP IPNs (ANOVA). g, h Cells in HP IPNs made with fluorescein-conjugated alginate. g Matrix is densified around protrusions (top yellow arrow), and densification persists after protrusions retract (bottom yellow arrow). h Migrating cells leave lasting channels. The fluorescence intensity signal across the migrating cell’s path (line marked A  to B) was measured. i Three hours after cells were lysed and actin networks were depolymerized, similar channels remained, with their intensity profiles as shown. For gi, scale bar is 10 μm
Fig. 5
Fig. 5
Known modes and newly discovered mode of confined migration. For pores sizes smaller than a cell but larger than ~3 μm, it is thought that cells can squeeze through pores to migrate, without requiring proteases. It is thought that for pores smaller than ~3 μm, cells are considered confined to such a degree that they require proteases to migrate. We report a migration mode that is plasticity-mediated and protease-independent: if pores are smaller than ~3 μm and the matrix is sufficiently plastic, then cells can use progressively widening and lengthening protrusions to physically open up a channel in the surrounding matrix and enable cell migration

References

    1. Rowe RG, Weiss SJ. Breaching the basement membrane: who, when and how? Trends Cell Biol. 2008;18:560–574. doi: 10.1016/j.tcb.2008.08.007. - DOI - PubMed
    1. Leong HS, et al. Invadopodia are required for cancer cell extravasation and are a therapeutic target for metastasis. Cell Rep. 2014;8:1558–1570. doi: 10.1016/j.celrep.2014.07.050. - DOI - PubMed
    1. Murphy DA, Courtneidge SA. The ‘ins’ and ‘outs’ of podosomes and invadopodia: characteristics, formation and function. Nat. Rev. Mol. Cell. Biol. 2011;12:413–426. doi: 10.1038/nrm3141. - DOI - PMC - PubMed
    1. Eddy RJ, Weidmann MD, Sharma VP, Condeelis JS. Tumor cell invadopodia: invasive protrusions that orchestrate metastasis. Trends Cell Biol. 2017;27:595–607. doi: 10.1016/j.tcb.2017.03.003. - DOI - PMC - PubMed
    1. Wolf K, et al. Physical limits of cell migration: control by ECM space and nuclear deformation and tuning by proteolysis and traction force. J. Cell Biol. 2013;201:1069–1084. doi: 10.1083/jcb.201210152. - DOI - PMC - PubMed

Publication types