. 2018 Oct 8;8(1):14937.
doi: 10.1038/s41598-018-32923-z.

Mammographic Density Distribution of Healthy Taiwanese Women and its Naturally Decreasing Trend with Age

Affiliations

Mammographic Density Distribution of Healthy Taiwanese Women and its Naturally Decreasing Trend with Age

Wei-Chung Shia et al. Sci Rep. .

Abstract

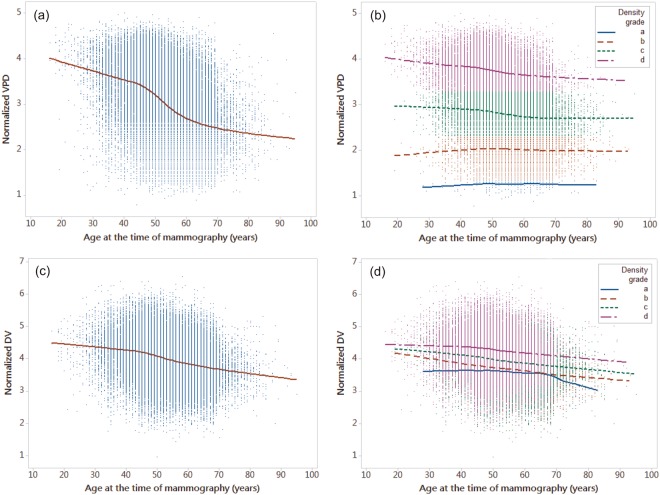
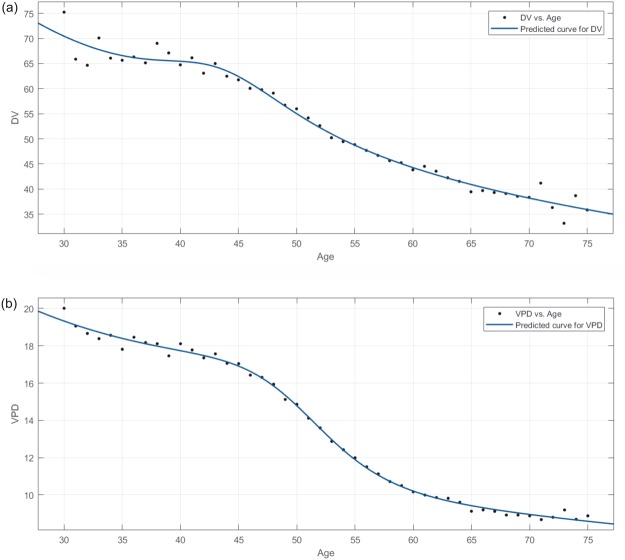
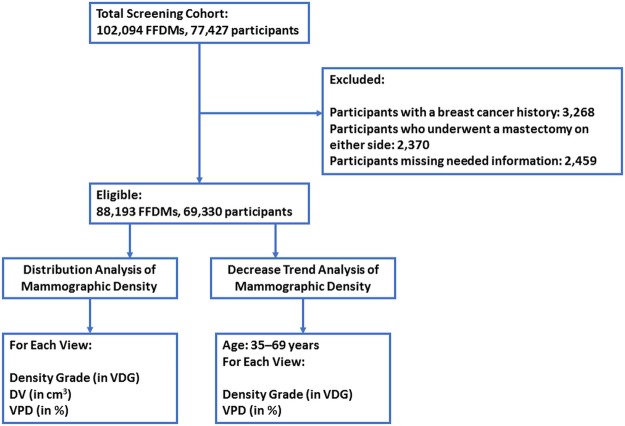
We analysed typical mammographic density (MD) distributions of healthy Taiwanese women to augment existing knowledge, clarify cancer risks, and focus public health efforts. From January 2011 to December 2015, 88,193 digital mammograms were obtained from 69,330 healthy Taiwanese women (average, 1.27 mammograms each). MD measurements included dense volume (DV) and volumetric density percentage (VPD) and were quantified by fully automated volumetric density estimation and Box-Cox normalization. Prediction of the declining MD trend was estimated using curve fitting and a rational model. Normalized DV and VPD Lowess curves demonstrated similar but non-identical distributions. In high-density grade participants, the VPD increased from 12.45% in the 35-39-year group to 13.29% in the 65-69-year group but only from 5.21% to 8.47% in low-density participants. Regarding the decreased cumulative VPD percentage, the mean MD declined from 12.79% to 19.31% in the 45-50-year group versus the 50-55-year group. The large MD decrease in the fifth decade in this present study was similar to previous observations of Western women. Obtaining an MD distribution model with age improves the understanding of breast density trends and age variations and provides a reference for future studies on associations between MD and cancer risk.


Conflict of interest statement

The authors declare no competing interests.

Figures

Figure 1
Figure 1
Normalized dense volume and percent volumetric density measures as functions of age at the time of mammography, showing a smoothed Lowess curve. The normalized dense volume in cm3 and volumetric density in percentage measurements are shown as a Lowess curve both ungrouped and grouped by density grade. (a) The Lowess curve of the mean normalized percent volumetric density measurements and ages of all participants. (b) The Lowess curve of the mean of the normalized percent volumetric density measurement and age grouped by density grade. (c) The Lowess curve of the mean normalized dense volume measurement and age for all participants. (d) The Lowess curve of the mean normalized dense volume measurement and age grouped by density grade. All breast density grades were estimated in VDG by VolparaTM. DV: volumetric density, VPD: percent volumetric density.
Figure 2
Figure 2
Distributions of mammographic volumetric density and percent volumetric density shown as fitted model curves. The mean volumetric density and percent volumetric density for each age were fitted in the rational model; the curve represents associations with age. (a) The fitted curve of mean volumetric density for each age. (b) The fitted curve of mean percent volumetric density for each age. Each data point represents the mean value for each age. DV: volumetric density, VPD: percent volumetric density.
Figure 3
Figure 3
Flow chart showing FFDM data exclusion and enrolment.

References

    1. Krishnan K, et al. Longitudinal study of mammographic density measures that predict breast cancer risk. Cancer Epidemiol. Biomarkers Prev. 2017;26:651–660. doi: 10.1158/1055-9965.EPI-16-0499. - DOI - PMC - PubMed
    1. Martin LJ, Boyd NF. Mammographic density. Potential mechanisms of breast cancer risk associated with mammographic density: hypotheses based on epidemiological evidence. Breast Cancer Res. 2008;10:201. doi: 10.1186/bcr1831. - DOI - PMC - PubMed
    1. Checka CM, Chun JE, Schnabel FR, Lee J, Toth H. The relationship of mammographic density and age: implications for breast cancer screening. AJR Am. J. Roentgenol. 2012;198:W292–W295. doi: 10.2214/AJR.10.6049. - DOI - PubMed
    1. Cuzick J, et al. Tamoxifen-induced reduction in mammographic density and breast cancer risk reduction: a nested case–control study. J. Natl. Cancer Inst. 2011;103:744–752. doi: 10.1093/jnci/djr079. - DOI - PubMed
    1. Mousa NA, Crystal P, Wolfman WL, Bedaiwy MA, Casper RF. Aromatase inhibitors and mammographic breast density in postmenopausal women receiving hormone therapy. Menopause. 2008;15:875–884. doi: 10.1097/gme.0b013e31816956c3. - DOI - PubMed

Publication types