. 2018 Nov;21(11):1628-1643.
doi: 10.1038/s41593-018-0241-y. Epub 2018 Oct 8.

Integration of gene expression and brain-wide connectivity reveals the multiscale organization of mouse hippocampal networks

Affiliations

Integration of gene expression and brain-wide connectivity reveals the multiscale organization of mouse hippocampal networks

Michael S Bienkowski et al. Nat Neurosci. 2018 Nov.

Abstract

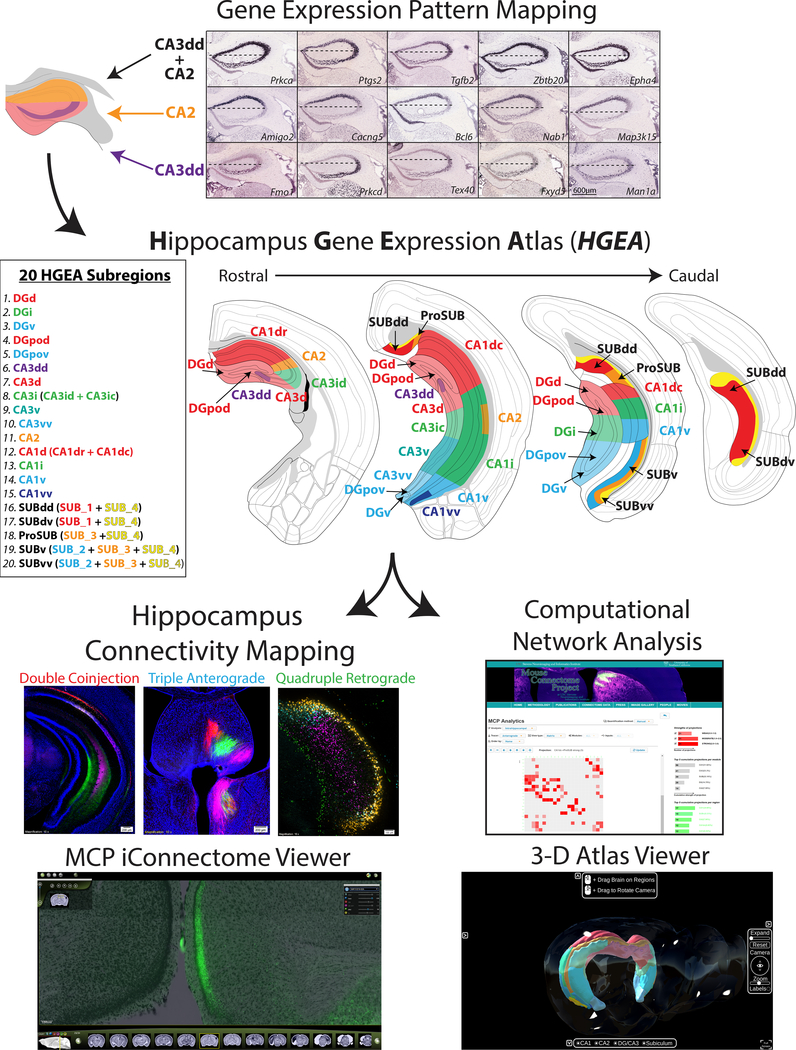
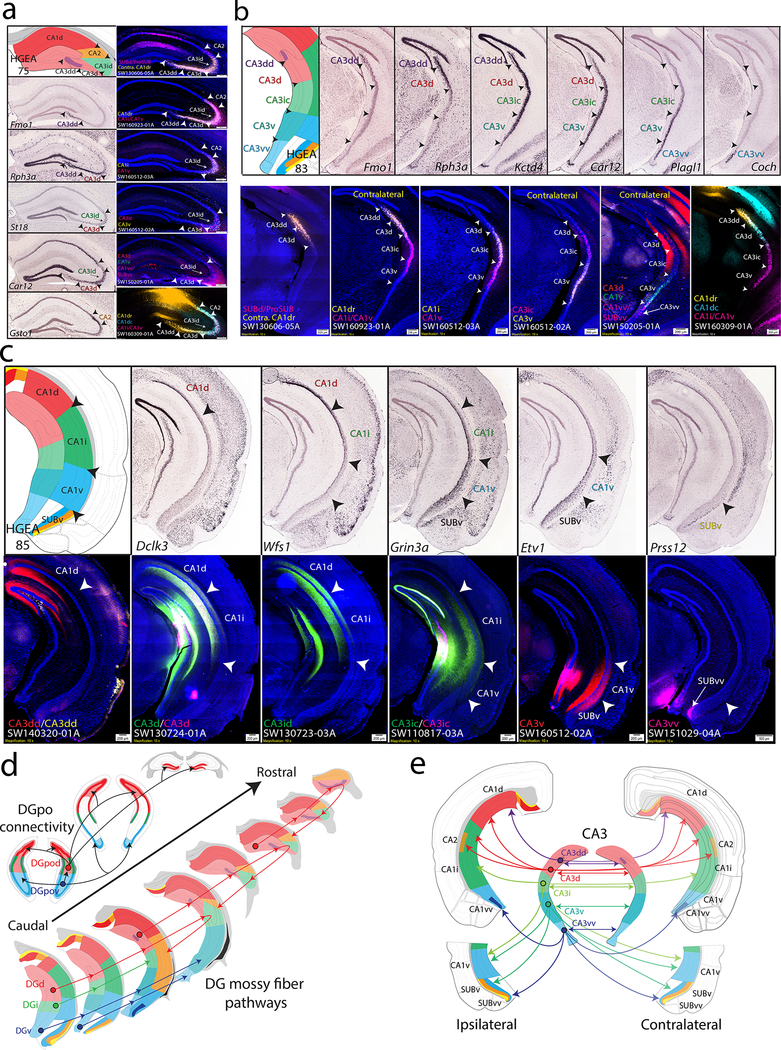
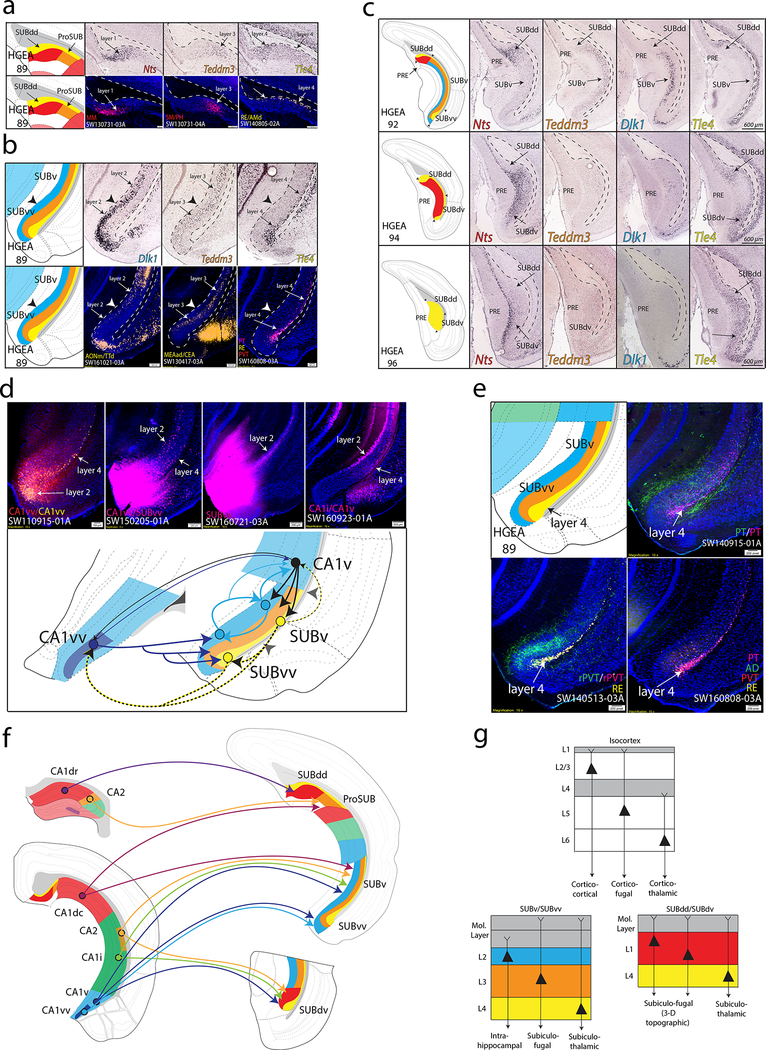
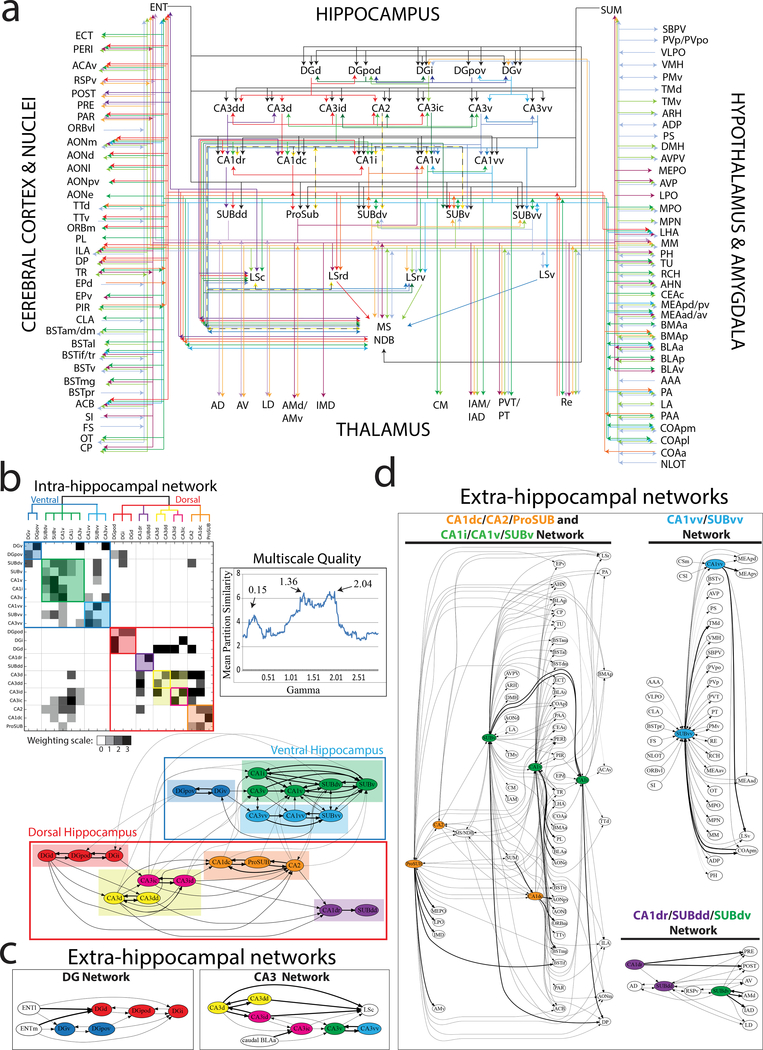
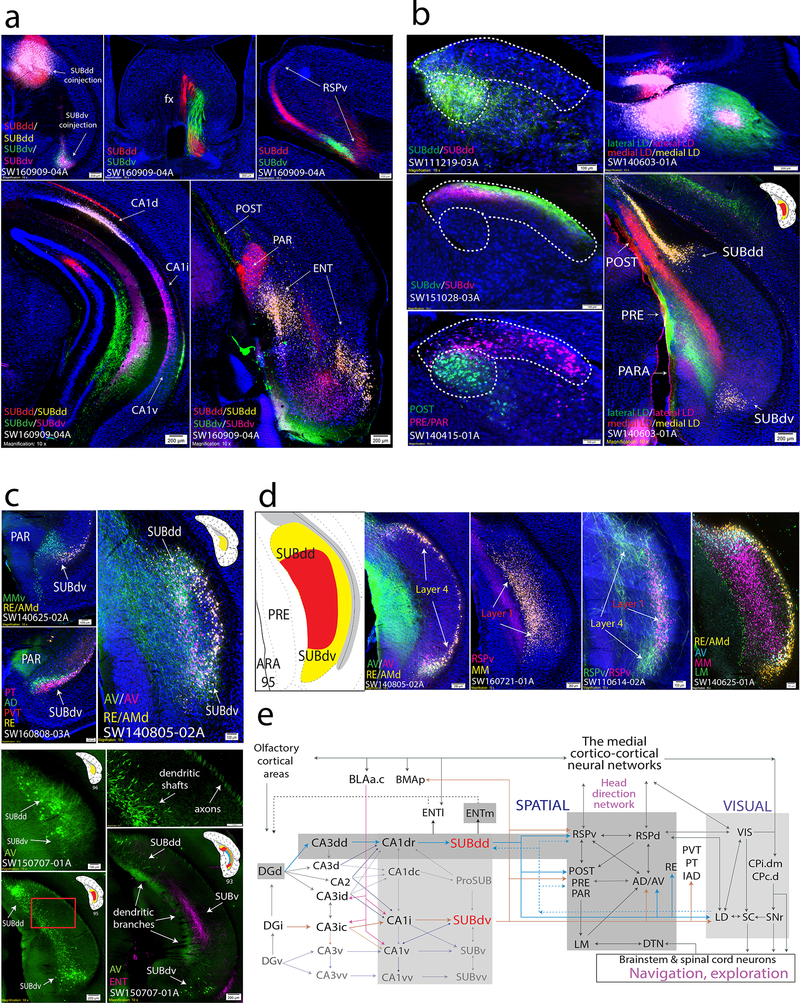
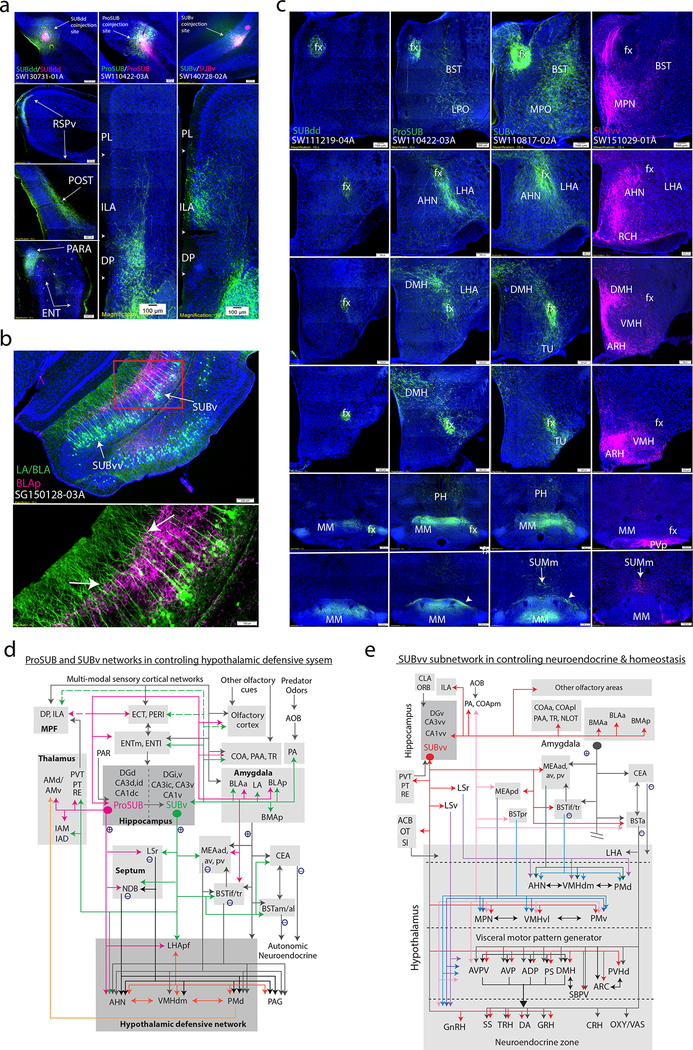
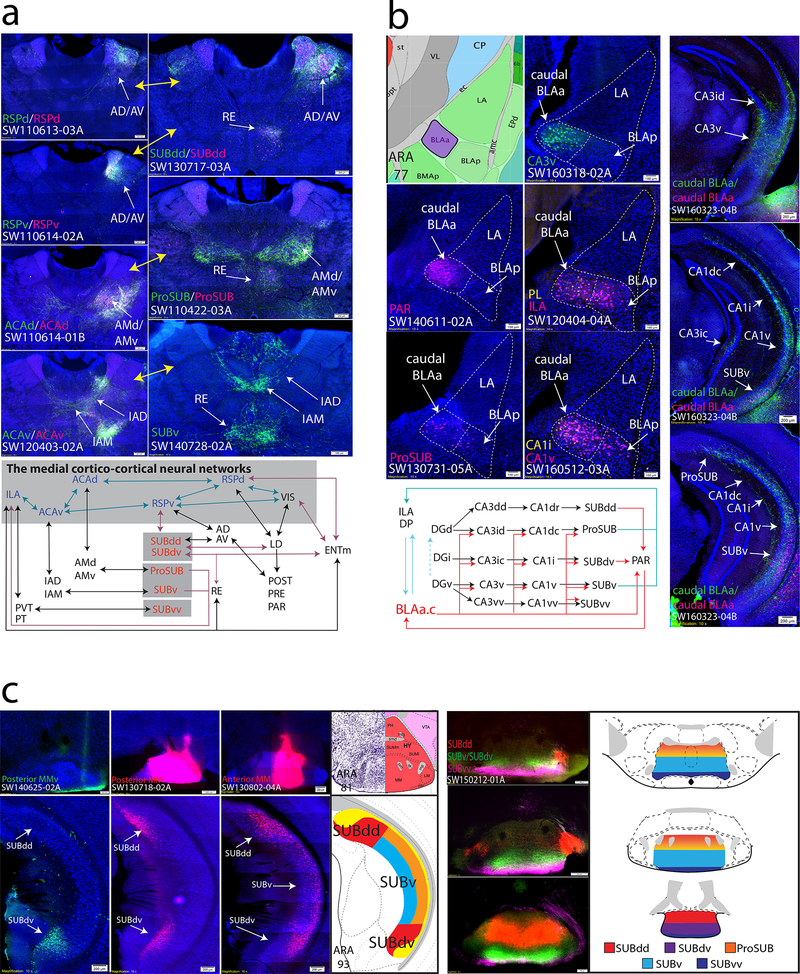
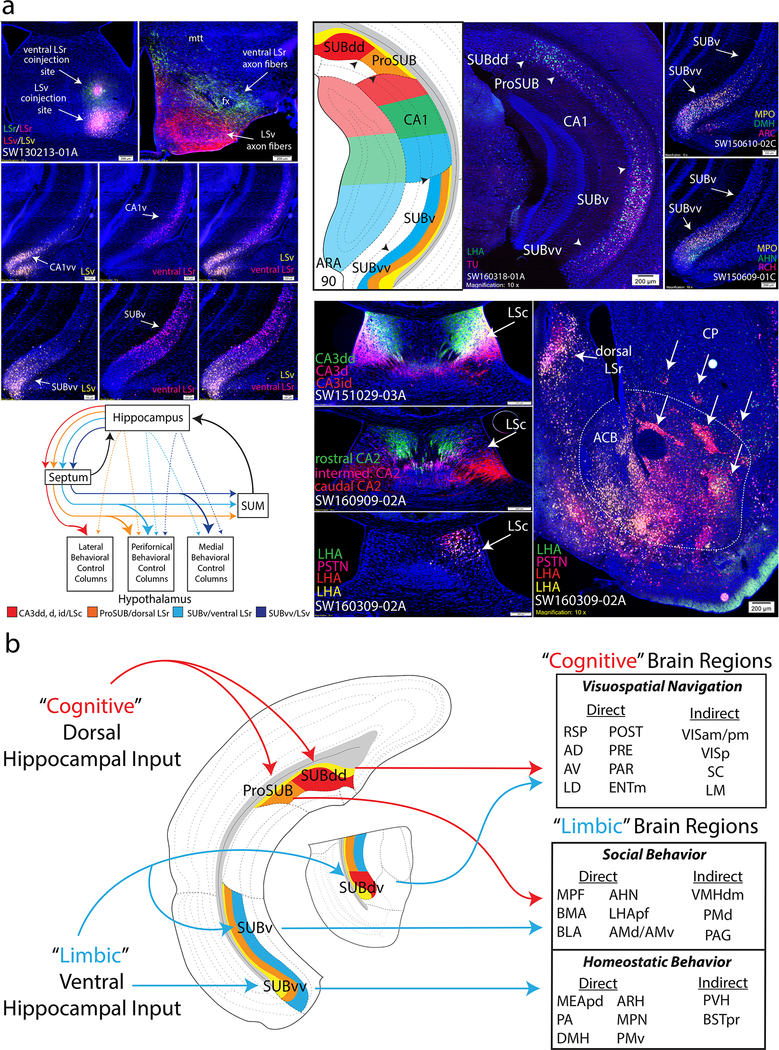
Understanding the organization of the hippocampus is fundamental to understanding brain function related to learning, memory, emotions, and diseases such as Alzheimer's disease. Physiological studies in humans and rodents have suggested that there is both structural and functional heterogeneity along the longitudinal axis of the hippocampus. However, the recent discovery of discrete gene expression domains in the mouse hippocampus has provided the opportunity to re-evaluate hippocampal connectivity. To integrate mouse hippocampal gene expression and connectivity, we mapped the distribution of distinct gene expression patterns in mouse hippocampus and subiculum to create the Hippocampus Gene Expression Atlas (HGEA). Notably, previously unknown subiculum gene expression patterns revealed a hidden laminar organization. Guided by the HGEA, we constructed the most detailed hippocampal connectome available using Mouse Connectome Project ( http://www.mouseconnectome.org ) tract tracing data. Our results define the hippocampus' multiscale network organization and elucidate each subnetwork's unique brain-wide connectivity patterns.


Conflict of interest statement

Competing Financial Interests

The authors declare no competing financial interests.

Figures

Figure 1.
Figure 1.. Experimental workflow.
(top) HGEA subregions were defined and mapped by the consensus of multiple gene expression patterns (scale bar for all images shown in bottom right panel). As an example, 5 gene expression distributions are shown that contrast CA3dd (bottom row) vs. CA2 (middle row) as well as 5 genes that are expressed in both CA3dd and CA2 (top row). Horizontal dashed line in each image corresponds to the division of CA2 genes vs. CA3dd genes which corresponds with the mapped boundary of the CA3dd/CA2 border at HGEA level 67. Consensus subregion boundaries were mapped in a similar fashion for DG, CA3, CA2, CA1, and SUB at all rostrocaudal levels of the hippocampus (four representative levels shown middle). Following the creation of the atlas, we examined the connectivity of each HGEA subregion as part of the Mouse Connectome Project (MCP, www.MouseConnectome.org). We used combinations of multiple retrograde and anterograde tracers in a variety of experimental strategies (double coinjection, triple anterograde, quadruple retrograde). As a resource, we have made all data openly available online at our MCP website (www.MouseConnectome.org; including connectivity image data, HGEA atlas sections, annotation tables, network analyses, and 3-D visualization tools (in situ hybridization image data can also be found at Allen Institute’s website www.brain-map.org).
Figure 2.
Figure 2.. CA3 and CA1 gene expression and anatomical labeling patterns match closely with HGEA delineation.
For each image of tracer labeling, tracer injection sites and corresponding experimental case numbers (i.e., SW130606–05A in a) are indicated on the left-bottom (i.e., ProSUB/SUBdd or contra CA1dr). (a) Rostral hippocampus gene expression patterns and corresponding HGEA atlas section are shown on the left (Fmo1 = CA3dd, Rph3a = CA3dd + CA3d, St18 = CA3id, Car12 = CA3d +CA3id, Gsto1 = CA2) while multiple retrograde labeling patterns from combinations of CA3 and CA1 subregions are shown on the right. Arrowheads demarcate HGEA subregion boundaries across the images. Retrograde injections into different combinations of CA3 and CA1 regions produced bilateral CA3 retrograde labeling patterns that appear consistent with gene expression-defined HGEA subregion boundaries. Retrograde tracer injection into the contralateral CA1dr (SW130606–05A) retrogradely labeled neurons within the CA3dd, CA3d, and CA3id (yellow) adjacent to CTB labeling (magenta) in the rostral CA2 [from ipsilateral ProSUB (some leakage into SUBdd)]. Retrograde injection into the CA1dr (SW160923–01A) shows a distinct set of labeling within the CA3dd/CA3d (yellow) but overlapping labeling with CA1i/CA1v-projecting neurons in the CA2 and CA3id (magenta). Retrograde injections into the CA1i (SW160512–03A) retrogradely labeled neurons within the CA3id (yellow), but no labeling from CA1v injection (magenta). Retrograde injections into the CA3ic (magenta) and CA3v (yellow; SW160512–02A) both produce restricted labeling within the ipsilateral CA3id but in segregated superficial vs. deep neuronal populations (compare to St18 gene expression). Multiple retrograde injection in CA3d (red), CA1v (green), and CA1vv/SUBvv (magenta; SW150205–01A) revealed CA3d-projecting neurons within CA3d and CA3id (compare to Car12 gene expression). Multiple retrograde tracer injections into the CA1dr (yellow), CA1dc (cyan), and CA1i/CA1v (magenta) produce overlapping labeling patterns within the CA3 and CA2, but with different labeling densities distinguishing each CA3 subregion. (b) More caudal CA3 levels with gene expression patterns on top (Fmo1 = CA3dd, Rph3a = CA3dd+CA3d, Kctd4 = CA3dd+CA3d+CA3i+CA3v, Car12 = CA3d+CA3id+CA3v, Plagl1 = CA3v+CA3vv, Coch = CA3vv) and retrograde labeling patterns on bottom (same retrograde tracing experiments as in a). In case SW130606–05A, contralateral CA1dr-projecting neurons (yellow), which were present within CA3dd, CA3d, and CA3id at more rostral levels (a), continue to be located within caudal parts of CA3dd and CA3d, but not within CA3ic (compare to Rph3a gene expression at this level). Caudal levels of case SW160923–01A shows CA1dr-projecting neurons (yellow) in CA3dd and CA3d are adjacent to CA1i/CA1v-projecting neurons (magenta) in CA3ic whereas these populations were overlapped within CA3id (a). In case SW160512–02A, CA1i-projecting neurons (yellow) are located in CA3d and CA3ic whereas CA1v-projecting neurons (magenta) are located within CA3ic and CA3v. Together, cases SW130606–05A, SW160923–01A, and SW160512–02A show that CA3id and CA3ic both project to CA1i but can be distinguished by projections to CA1d and CA1v, respectively (confirmed by anterograde labeling in c). Case SW160512–03A shows associational connectivity of CA3ic (magenta) and CA3v (yellow) neurons within the contralateral CA3. Note the similarity in the CA3ic/CA3v boundary produced by CA3 associational connectivity in case SW160512–02A and Schaffer collateral CA1 connectivity in SW160512–03A. Case SW150205–01A shows multiple retrograde labeling on the contralateral side after injections into CA3d (red), CA1v (green), and CA1v/SUBvv (magenta). CA3d-projecting neurons are located within CA3d and CA3ic, CA1v-projecting neurons are located within CA3ic and CA3v, and CA1vv/SUBvv-projecting neurons are located adjacent within CA3vv. Finally, SW160309–01A shows different densities of CA1dr- (yellow) and CA1dc-projecting neurons (cyan) within CA3dd and CA3d adjacent to CA1i/CA1v-projecting neurons (magenta) within CA3ic and CA3v. (c) Example gene expression patterns correspond to HGEA CA1 subregions and define CA1v/SUBv border (Dclk3 = CA1d, Wfs1 = CA1d + CA1i, Grin3a = CA1i+CA1v+SUBv, Etv1 = CA1v + SUBv, Prss12 = SUBv. Anterograde labeling of CA3 projections to CA1 revealed partially-overlapped topographic CA3 fiber distribution aligns well with gene expression-defined HGEA CA1 subregion boundaries (additional rostrocaudal levels shown in Supplementary Fig. 8). CA3dd projects to CA1d (more dense on medial side), CA3d and CA3id both project to CA1d (more dense lateral side) and CA1i, CA3ic projects to CA1i and CA1v, CA3v projects to CA1v and SUBv, and CA3vv projects to CA1vv and SUBvv. (d) Summary schematic of DGpo and DG mossy fiber connectivity organization (see Supplementary Fig. 5 for data). DGpod neurons (red) project bilaterally to the inner-third of the DG molecular layer across the rostrocaudal extent of the DGd and DGi as well as directly targeting the contralateral DGpod. DGpov neurons (blue) produce a similar pattern, but instead target the DGv and DGi. Below, DGd granule cell mossy fiber pathways are unique compared to the DGi and DGv. DGd mossy fibers (red) innervate DGpo cells locally before extending rostrally through the CA3 up to 1mm before turning caudal to target a topographic part of CA2. The overall shape of this hairpin-like connectivity motif is different between neurons in the caudal vs. rostral parts of DGd. In contrast, DGi (green) and DGv (blue) mossy fibers extend rostrally through DGpo and CA3 in a straight-line pattern. (e) Summary schematic of CA3 subregion bilateral associational and Schaffer collateral projections to CA1. CA3dd (purple) projects to medial parts of CA1d, CA3d (red) projects to lateral parts of CA1d, CA2, and CA1i, CA3ic (green) projects to CA1i and CA1v, CA3v (teal) projects to CA1v and SUBv, and CA3vv (blue) projects to CA1vv and SUBvv. For the number of tracer experiments and cross-validated results, see the Supplementary Methods.
Figure 3.
Figure 3.. SUB gene expression and anatomical labeling patterns produce similar laminar organization
(a) Gene expression patterns of the classic dorsal subiculum define laminar and subregional organization that correspond to anatomical connectivity patterns. Nts and Teddm3 expression demarcate HGEA layers 1 and 3, respectively, whereas Tle4 expression identifies the deeper HGEA layer 4 adjacent to the alveus. Below, example laminar retrograde labeling patterns of MM- (SW130731–03A), SM/PH- (SW130731–04A), and RE/AMd-projecting neurons (SW140805–02A) distinctly relate to layers 1, 3, and 4, respectively. (b) Teddm3 and Tle4 (layer 3 and 4) expression continues into the ‘classic’ ventral SUB, but both are located deeper to another layer identified by Dlk1 expression (layer 2). Note that there is a thickening of layer 4 at the dorsal and ventral ends of subiculum that we refer to as the dorsal and ventral ‘bulbs’, respectively. Below, example laminar retrograde labeling patterns of AONm/TTd- (SW161021–03A), MEAad/CEA- (SW130417–03A), and multiple thalamic-projecting neuronal cell types (PT, RE, PVT; SW160808–03A) distinctly relate to layers 2, 3, and 4, respectively. (c) At caudal levels, the distribution of the gene expression layers changes following the disappearance of the CA1. Immediately caudal to CA1 at ARA level 92, layers 2 and 3 extend dorsally to border layer 1. At ARA level 93, a ventral region containing layer 1 appears adjacent to the PAR (see Supplementary Fig. 1) and layer 1 becomes continuous at ARA level 94 following the emergence of the presubiculum (PRE). Finally, ARA level 96 represents the caudal end of the subiculum where only gene expression layer 4 is present (Nts expression is in PRE layer 3). The combinations and distribution of these layers are used to define the five SUB subregions. Scale bars on the right panels apply to all images. (d) Tracer coinjections within ventral CA1 and SUB regions revealed complex laminar-specific interconnectivity. CA1vv coinjection (SW110915–01A) produced anterograde labeling across all SUBvv layers and retrograde labeling within SUBvv layers 2 and 4. CTB injection into CA1vv/SUBvv (SW150205–01A) produced retrograde labeling within SUBv and SUBvv layer 4 and the deeper part of SUBv and SUBvv layer 2. PHAL anterograde injection into SUBvv (SW160721–03A) produced anterograde labeling that travels along SUBv and SUBvv layer 2. Retrograde injection into CA1v (SW160923–01A) produces retrograde labeling in SUBv layer 4 and superficial SUBv layer 2. Together, this data suggests that CA1v, CA1vv, SUBv, and SUBvv are bidirectionally connected through two different systems of connections mediated through layers 2 and 4 (see summary diagram below). (e) Coinjection into the paratenial thalamus (PT, SW140915–01A) produces anterograde and retrograde labeling within SUBv and SUBvv layers 3 and 4 as well as anterograde labeling in the SUBvv deep molecular layer. Coinjection into the rostral paraventricular thalamus (rPVT, SW140513–03A) and Fluorogold injection into the reuniens thalamus (RE) reveals strong retrograde labeling in SUBv and SUBvv layer 4 and anterograde labeling in SUBvv layer 3 and deep molecular layer. Multiple retrograde tracing from PT, PVT, RE, and anterodorsal thalamus (AD, SW160808–03A) produces retrograde labeling that is highly restricted to layer 4. (f) Summary schematic of CA1 and CA2 projections to the five SUB subregions. (g) General laminar organization of pyramidal neurons in the isocortex (top) compared similarly to the gene expression laminar organization of the SUBv/SUBvv and SUBdd/SUBdv pyramidal neurons. Extension of dendrites into the molecular layer is based on interpretation of rabies-labeled morphology (for example, see Figs. 5c and 6b). All in situ hybridization images in (a-c) are from Allen Institute website (www.brain-map.org). For the number of tracer experiments and cross-validated results, see the Supplementary Methods.
Figure 4.
Figure 4.. Multiscale neural network analysis of intra- and extra-hippocampal connections
(a) Unweighted connectome wiring diagram of all inputs and outputs of HGEA hippocampal subregions. Associational connections (e.g. between CA3 subregions) are layered directly below each HGEA subregion group and extrinsic connections are layered further below. For annotated data, see Supplementary Table 5. Visit www.MouseConnectome.org for an interactive version of the wiring diagram. (b) Reordered connectivity matrix and schematic diagram showing the modular hierarchical organization of intrahippocampal subnetworks as defined by current tracing data in HGEA subregions. Mean partition similarity (MPS) was calculated for multiple gamma values to determine which gamma values had the highest MPS peaks (0.15, 1.36, 2.04) to use for matrix reordering (Multiscale Quality graph). In the matrix, edges are shaded according to connectivity weight (0–3, see Supplementary Table 6) and colored boxes along the diagonal reflect modular communities at different scales. The large blue and red outlined boxes corresponds to the two large ‘dorsal and ventral hippocampus’ communities detected at 0.15 gamma, colored shaded boxes correspond to communities detected at 1.36 gamma, and smaller colored outlined boxes correspond to communities detected at 2.04 gamma. Matrix community color scheme corresponds to the organization of the schematic diagram below. In the schematic diagram, line weights refer to connectivity relationships at different scales. Thicker lines refer to modular connections at all scales (within community) whereas thinner lines show modular relationships only at larger scales. (c and d) Five consensus brain-wide communities determined from multiscale community detection on annotated data in Supplementary Table 5 (c, DG and CA3 extrahippocampal networks; d, CA1/SUB extrahippocampal networks [CA1dc/CA2/ProSUB and CA1i/CA1v/SUBv network, CA1vv/SUBvv network, and CA1dr/SUBdd/SUBdv network)]. Similar to the schematic in (b), line weights refer to connectivity relationships at different scales. Node coloring is maintained from intrahippocampal subnetwork analysis in b. Different colored nodes within the extrahippocampal networks suggests multiple intrahippocampal networks provide output to a larger brain-wide network.
Figure 5.
Figure 5.. The role of the SUBdd and SUBdv in visuospatial integration and navigation
(a) Double coinjection experiments targeted to the SUBdd and SUBdv (SW160909–04A) reveal similar topographically-organized anterogradely labeled projections including but not limited to the fornix (middle top), RSPv (right top), and ENT (bottom right). In the hippocampus, SUBdd retrograde labeling was distributed in the CA1d, whereas SUBdv retrograde labeling was distributed adjacent within the CA1i (bottom left, highly comparable to HGEA CA1d/CA1i boundary). Both SUBdd and SUBdv project to the POST, PRE, and PAR, but have reciprocal, complementary connectivity patterns. SUBdd projects to rostral POST and caudal PAR while SUBdv projects to rostral PAR and caudal POST (caudal section shown in bottom right). Within the ENT cortex, SUBdd and SUBdv receive input from the lateral and intermediate bands, respectively. Anterograde and retrograde coinjection into the RSPv reveals retrograde labeling in SUBdd and SUBdv layer 1 while anterogradely-labeled RSPv fibers primarily target the dorsal and ventral ends of layer 4. (b) Anterograde and retrograde coinjections into the SUBdd (SW111219–03A) and SUBdv (SW151028–03A) produces labeling pattern distributions within the LD thalamus that are highly similar to retrograde labeling patterns from the POST vs. PRE/PAR (SW140415–01A, outlined by dashed white lines). Double coinjections targeted to the medial vs. lateral part of the LD thalamus produced retrograde labeling within SUBdd and SUBdv layer 4 with laminar specific anterogradely labeled projections to the POST/PRE/PAR. (c) Organization of thalamic-projecting neurons. MM-projecting layer 1 neurons are distinct from RE/AMd-projecting layer 4 neurons within SUBdv (SW140625–02A). Within the bulbs of layer 4, AD-projecting neurons (similar to LD- and AV-projecting neurons) are distributed more superficial compared to RE-, PVT-, and PT-projecting neurons (SW160808–03A). At the caudal end of the subiculum, the AV-projecting layer 4 neurons in the dorsal and ventral bulbs join to become continuous along the medial part of the subiculum (SW140805–02A). Injection of G-deleted rabies virus into the AV thalamus (SW150707–01A) retrogradely labels AV-projecting layer 4 neuron cell bodies, axons, and dendrites. AV-projecting neurons at ARA 96 send their axons into the alveus while their thick dendritic shafts extend rostrally through the SUB at ARA 95 to bifurcate into thin dendritic branches in the superficial molecular layer at ARA 93 and avoid PHAL-labeled ENT axon fibers within the deeper molecular layer. Top right panel is magnified from red rectangle area in bottom left panel. (d) Comparison of multiple tracers reveals SUBdd and SUBdv projection cell types. In SW140805–02A, AV- and RE/AMd neurons were found to be relatively distinct projection neuron cell types within layer 4. Note, anterogradely-labeled AV fibers also terminate specifically in the dorsal and ventral bulbs. In contrast, almost all RSPv-projecting neurons were a subset of MM-projecting neurons in layer 1 (SW160721–01A). While RSPv-projecting SUB neurons are located in layer 1, anterogradely-labeled fibers from the RSPv predominantly terminate in the layer 4 dorsal and ventral bulb regions (SW110614–02A). Finally, case SW140625–01A contains four retrograde tracer injections into the RE/AMd, AV, MM, and LM that provides a comprehensive picture of projection cell types in the SUBdd and SUBdv at ARA level 95 that is remarkably similar to the HGEA. LM-projecting neurons are located primarily in PRE layer 3, MM-projecting neurons are located primarily within layer 1, and RE/AMD and AV-projecting neurons are located primarily within layer 4. (e) Wiring schematic diagram of SUBdd and SUBdv network connections with brain regions that contribute to visuospatial behavior (see Discussion). For the number of tracer experiments and cross-validated results, see the Supplementary Methods.
Figure 6.
Figure 6.. Distinct connectivity patterns of the ProSUB, SUBv, and SUBvv
(a) SUBdd, ProSUB, and SUBv coinjections show that while the SUBdd targets the RSPv, POST/PRE/PAR, and ENT lateral band, ProSUB and SUBv neurons target complementary parts of the MPF. Anterogradely labeled ProSUB fibers robustly innervate the DP with lighter input to ILA deep layers (SW110422–03A) while SUBv fibers densely target ILA superficial layers (SW140728–02A). (b) Subiculum projections to the amygdala arise primarily from SUBv and SUBvv layer 3 (also ProSUB) whereas amygdala fibers primarily terminate in different parts of the molecular layer (see Supplementary Figure 8a,b). Injection of G-deleted rabies virus into the BLAp (SG150128–03A) reveals the dendritic branches of BLAp-projecting neurons (green) among PHA-L labeled BLAp fibers (pink). Closer examination of the amygdala-projecting dendrites reveals a thick shaft that bifurcates after passing through the BLAp terminal field (arrow). (c) Subicular projections to the hypothalamus are organized along rostrocaudal bands (all image columns are organized rostral (top) to caudal (bottom)). SUBdd (and SUBdv) fibers bypass most of the hypothalamus via the fornix to innervate the MM (left column). The ProSUB and SUBv (middle columns) differentially innervate multiple hypothalamic nuclei around the fornix (perifornical band) such as the anterior hypothalamic nucleus (AHN). In contrast, SUBvv fibers (right column) target multiple hypothalamic nuclei along the periventricular and medial hypothalamus (medial band). (d and e) Schematic models showing ProSUB and SUBv connectivity with the hypothalamic defensive behavior network (d) and SUBvv connectivity with brain networks controlling metabolism, sexual behavior, and neuroendocrine function (e). For the number of tracer experiments and cross-validated results, see the Supplementary Methods.
Figure 7.
Figure 7.. Brain systems with multiple interactions among hippocampal neural networks
(a) Subiculum regions are topographically, bidirectionally connected with the anterior thalamic nuclei (right) in a way that is highly similar to the projection patterns observed following injections within RSP and ACA cortices (left, yellow arrows refer to similar connectivity patterns). Anterior thalamic regions serve as discrete relays for SUB information to modulate different levels of the medial cortico-cortical network (schematic below). (b) Retrograde tracer injections into the CA3v specifically label a small dense cluster of neurons in the caudal BLAa (SW160318–02A) that is also specifically innervated by the PAR (SW140611–02A). Dashed white lines outline cytoarchitectural boundaries of the LA, caudal BLAa, and BLAp. In addition, the caudal BLAa also contains retrogradely labeled neurons following injections into many brain regions including the ProSUB, CA1i, CA1v, PL, and ILA. Double coinjection experiment targeted to the caudal BLAa (SW160323–04B) reveals a broad distribution of anterogradely-labeled fibers that, in contrast to other amygdala nuclei (see Fig. 6b), directly targets hippocampal neuron cell bodies within the CA3id, CA3ic, CA3v, ProSUB, CA1dc, CA1i, CA1v, SUBv. Together, the caudal BLAa is a unique amygdalar region positioned as a hub between multiple hippocampal networks and MPF. (c) Organization of the subiculum projections to MM. An injection isolated specifically to the ventral part of posterior MM (MMv, SW140625–02A) only labeled neurons within the SUBdv, while a larger injection into the posterior MM (SW130718–02A) specifically labeled neurons in both the medial/superficial part of SUBdd and SUBdv layer 1. Whereas posterior MM injections label superficial neurons in layer 1, injection into the anterior MM (SW130802–04A) retrogradely-labeled neurons deeper within SUBdd/SUBdv layer 1 as well as layer 3 neurons in SUBv. Triple anterograde tracer injections into the SUBdd, SUBdv/SUBv, and SUBvv (SW150212–01A) reveal bilateral fiber terminals across the rostrocaudal MM. Overall, the entire SUB topographically projects in unique termination zones across the rostrocaudal axis of the MM (summarized in the diagram on the right). For the number of tracer experiments and cross-validated results, see the Supplementary Methods.
Figure 8.
Figure 8.. Hippocampal-septo-hypothalamic networks and cognitive-limbic integration through subiculum output pathways
(a) Hippocampal network output contributes to parallel septo-hypothalamic pathways. Double coinjection experiment into the ventral LSr and LSv produced retrograde labeling distinctly within all layers of the CA1v/SUBv and CA1vv/SUBvv, respectively, and anterogradely targeted perifornical and medial bands of the hypothalamus (SW130213–01A; highly similar to SUB hypothalamic projection in Fig. 6c). Multiple retrograde tracers injected along the perifornical and medial bands produces heterogenous mixture of retrograde labeling across all layers of ProSUB/SUBv (SW160318–01A) and SUBvv (SW150610–02C and SW150609–01C). Multiple dorsal CA3 and CA2 subregions topographically innervate the LSc (SW151029–03A and SW160909–02A) which overlaps retrograde labeling from multiple retrograde tracer injections into the lateral hypothalamic band (lateral to perifornical band, SW160309–02A). Lateral hypothalamic band (also SI) receives input from the nucleus accumbens (arrows identify striosome-like multi-labeled structures). Overall, hippocampal networks form four parallel networks that directly and indirectly (via septum) innervated broad regions of the hypothalamus for motivated behavior. (b) From a systems perspective, the ‘cold cognitive’ dorsal hippocampus and ‘hot affective’ ventral hippocampus ultimately provide input to distinct subiculum regions. However, the outputs of the ProSUB and SUBdv suggest pathways for cognitive-limbic crossover function in two ways. The ProSUB receives cognitive visuospatial information from dorsal hippocampus and then provides output to limbic regions that are similar to the output of the SUBv. In reciprocal fashion, the SUBdv receives emotionally-salient limbic information from ventral hippocampus and projects to cognitive spatial navigation brain regions similar to the SUBdd. For the number of tracer experiments and cross-validated results, see the Supplementary Methods.

Similar articles

Cited by

References

    1. Fanselow MS & Dong H-W Are the dorsal and ventral hippocampus functionally distinct structures? Neuron 65, 7–19 (2010). - PMC - PubMed
    1. Maruszak A & Thuret S Why looking at the whole hippocampus is not enough—a critical role for anteroposterior axis, subfield and activation analyses to enhance predictive value of hippocampal changes for Alzheimer’s disease diagnosis. Frontiers in Cellular Neuroscience 8 (2014). - PMC - PubMed
    1. Moser MB & Moser EI Functional differentiation in the hippocampus. Hippocampus 8, 608–619 (1998). - PubMed
    1. Poppenk J, Evensmoen HR, Moscovitch M & Nadel L Long-axis specialization of the human hippocampus. Trends in cognitive sciences 17, 230–240 (2013). - PubMed
    1. Risold P & Swanson L Structural evidence for functional domains in the rat hippocampus. Science 272, 1484 (1996). - PubMed

Publication types