

Ghrelin-O-Acyltransferase (GOAT) Enzyme as a Novel Potential Biomarker in Gastroenteropancreatic Neuroendocrine Tumors
- PMID: 30297816
- PMCID: PMC6175927
- DOI: 10.1038/s41424-018-0058-8
Ghrelin-O-Acyltransferase (GOAT) Enzyme as a Novel Potential Biomarker in Gastroenteropancreatic Neuroendocrine Tumors
Abstract
Objectives: The association between the presence and alterations of the components of the ghrelin system and the development and progression of neuroendocrine tumors (NETs) is still controversial and remains unclear.
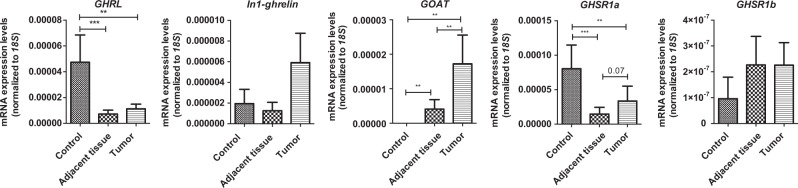
Methods: Here, we systematically evaluated the expression levels (by quantitative-PCR) of key ghrelin system components of in gastroenteropancreatic (GEP)-NETs, as compared to non-tumor adjacent (NTA; n = 42) and normal tissues (NT; n = 14). Then, we analyzed their putative associations with clinical-histological characteristics.
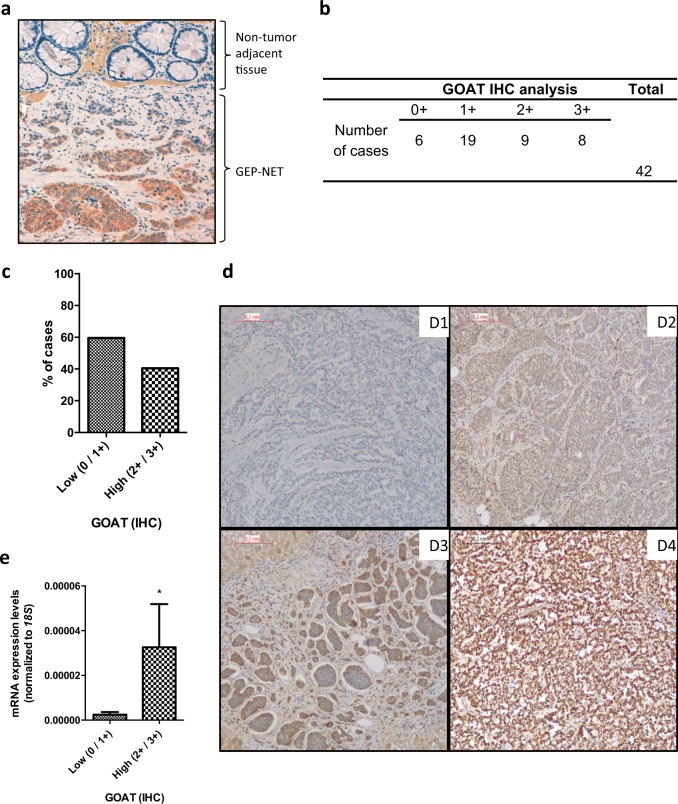
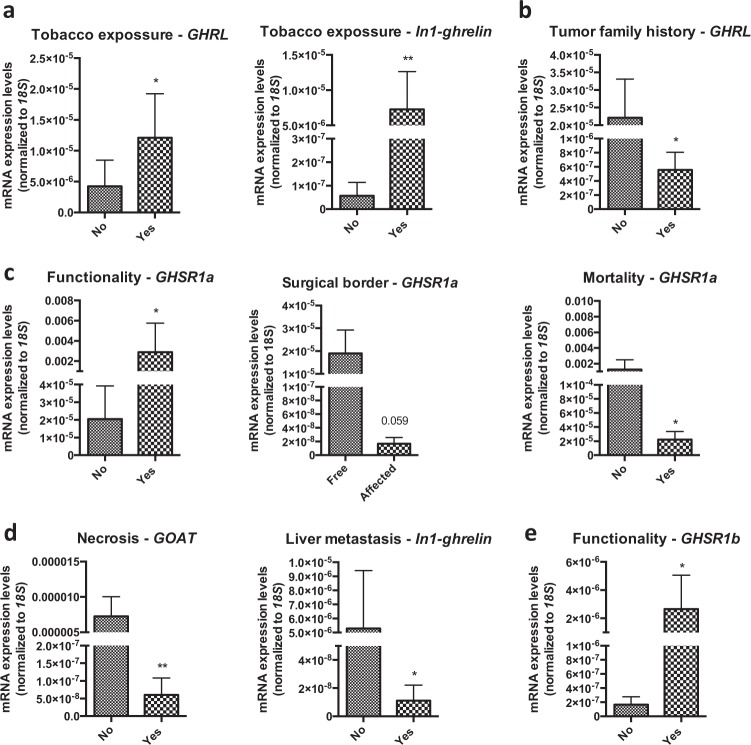
Results: The results indicate that ghrelin and its receptor GHSR1a are present in a high proportion of normal tissues, while the enzyme ghrelin-O-acyltransferase (GOAT) and the splicing variants In1-ghrelin and GHSR1b were present in a lower proportion of normal tissues. In contrast, all ghrelin system components were present in a high proportion of tumor and NTA tissues. GOAT was significantly overexpressed (by quantitative-PCR (qPCR)) in tumor samples compared to NTA, while a trend was found for ghrelin, In1-ghrelin and GHSR1a. In addition, expression of these components displayed significant correlations with key clinical parameters. The marked overexpression of GOAT in tumor samples compared to NTA regions was confirmed by IHC, revealing that this enzyme is particularly overexpressed in gastrointestinal NETs, where it is directly correlated with tumor diameter.
Conclusions: These results provide novel information on the presence and potential pathophysiological implications of the ghrelin system components in GEP-NETs, wherein GOAT might represent a novel diagnostic biomarker.
Conflict of interest statement
Specific authors contributions
All authors contributed in the conception and design of the manuscript, they critically revised the article and gave the final approval to its submission.
Raúl M. Luque
Potential competing interests
None.
Figures
Similar articles
-
In1-ghrelin, a splice variant of ghrelin gene, is associated with the evolution and aggressiveness of human neuroendocrine tumors: Evidence from clinical, cellular and molecular parameters.Oncotarget. 2015 Aug 14;6(23):19619-33. doi: 10.18632/oncotarget.4316. Oncotarget. 2015. PMID: 26124083 Free PMC article.
-
Clinical and functional implication of the components of somatostatin system in gastroenteropancreatic neuroendocrine tumors.Endocrine. 2018 Feb;59(2):426-437. doi: 10.1007/s12020-017-1482-3. Epub 2017 Dec 1. Endocrine. 2018. PMID: 29196939
-
Glutaminases in slowly proliferating gastroenteropancreatic neuroendocrine neoplasms/tumors (GEP-NETs): Selective overexpression of mRNA coding for the KGA isoform.Exp Mol Pathol. 2016 Feb;100(1):74-8. doi: 10.1016/j.yexmp.2015.11.017. Epub 2015 Nov 12. Exp Mol Pathol. 2016. PMID: 26581715
-
mTOR Pathway in Gastroenteropancreatic Neuroendocrine Tumor (GEP-NETs).Front Endocrinol (Lausanne). 2020 Nov 16;11:562505. doi: 10.3389/fendo.2020.562505. eCollection 2020. Front Endocrinol (Lausanne). 2020. PMID: 33304317 Free PMC article. Review.
-
Ghrelin gene products, receptors, and GOAT enzyme: biological and pathophysiological insight.J Endocrinol. 2013 Dec 2;220(1):R1-24. doi: 10.1530/JOE-13-0391. Print 2014 Jan. J Endocrinol. 2013. PMID: 24194510 Review.
Cited by
-
Correct Identification of Cell of Origin May Explain Many Aspects of Cancer: The Role of Neuroendocrine Cells as Exemplified from the Stomach.Int J Mol Sci. 2020 Aug 11;21(16):5751. doi: 10.3390/ijms21165751. Int J Mol Sci. 2020. PMID: 32796591 Free PMC article. Review.
-
Ghrelin and Cancer: Examining the Roles of the Ghrelin Axis in Tumor Growth and Progression.Biomolecules. 2022 Mar 22;12(4):483. doi: 10.3390/biom12040483. Biomolecules. 2022. PMID: 35454071 Free PMC article. Review.
-
Role of the Ghrelin System in Colorectal Cancer.Int J Mol Sci. 2022 May 11;23(10):5380. doi: 10.3390/ijms23105380. Int J Mol Sci. 2022. PMID: 35628187 Free PMC article. Review.
-
GHSR methylation-dependent expression of a variant ligand and receptor of the ghrelin system induces thymoma tumorigenesis.Oncol Lett. 2021 Nov;22(5):793. doi: 10.3892/ol.2021.13054. Epub 2021 Sep 17. Oncol Lett. 2021. PMID: 34630704 Free PMC article.
-
Ghrelin and its role in gastrointestinal tract tumors (Review).Mol Med Rep. 2021 Sep;24(3):663. doi: 10.3892/mmr.2021.12302. Epub 2021 Jul 23. Mol Med Rep. 2021. PMID: 34296307 Free PMC article. Review.
References
-
- Dasari Arvind, Shen Chan, Halperin Daniel, Zhao Bo, Zhou Shouhao, Xu Ying, Shih Tina, Yao James C. Trends in the Incidence, Prevalence, and Survival Outcomes in Patients With Neuroendocrine Tumors in the United States. JAMA Oncology. 2017;3(10):1335. doi: 10.1001/jamaoncol.2017.0589. - DOI - PMC - PubMed
-
- Garcia-Carbonero R, et al. Incidence, patterns of care and prognostic factors for outcome of gastroenteropancreatic neuroendocrine tumors (GEP-NETs): results from the National Cancer Registry of Spain (RGETNE) Ann. Oncol.: Off. J. Eur. Soc. Med. Oncol./Esmo. 2010;21:1794–1803. doi: 10.1093/annonc/mdq022. - DOI - PubMed
Publication types
MeSH terms
Substances
Supplementary concepts
LinkOut - more resources
Full Text Sources
Medical
Molecular Biology Databases
Research Materials
