. 2018 Oct 8;9(1):4125.
doi: 10.1038/s41467-018-06511-8.

High-efficiency optogenetic silencing with soma-targeted anion-conducting channelrhodopsins

Affiliations

High-efficiency optogenetic silencing with soma-targeted anion-conducting channelrhodopsins

Mathias Mahn et al. Nat Commun. .

Abstract

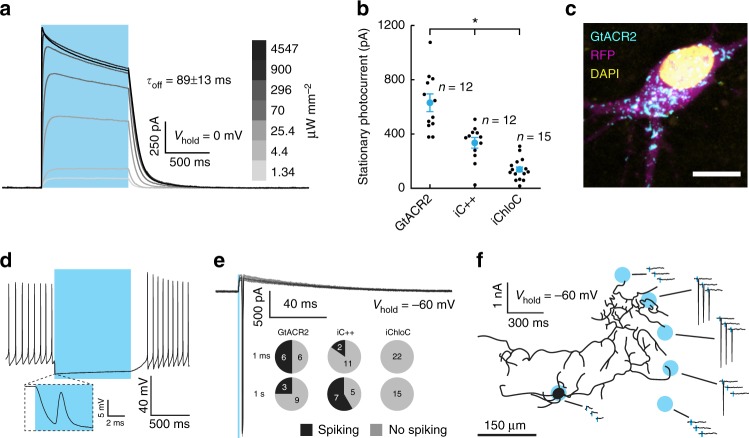
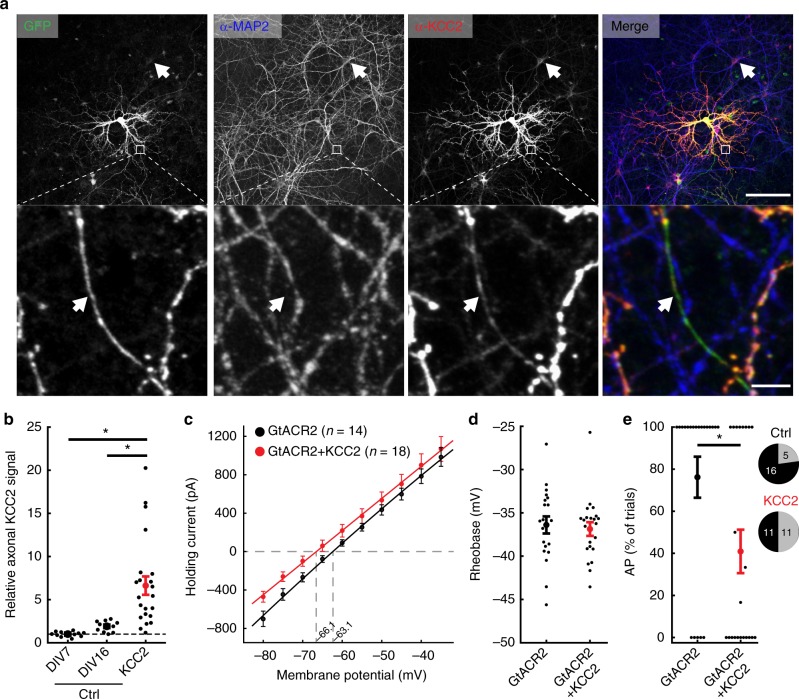
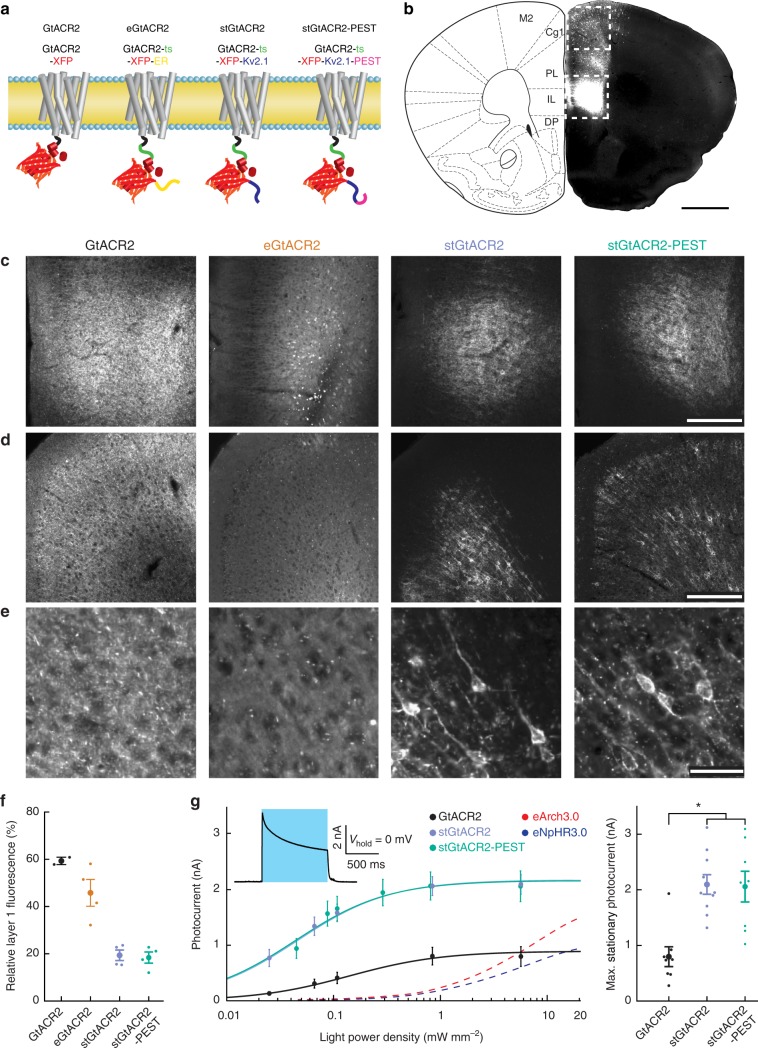
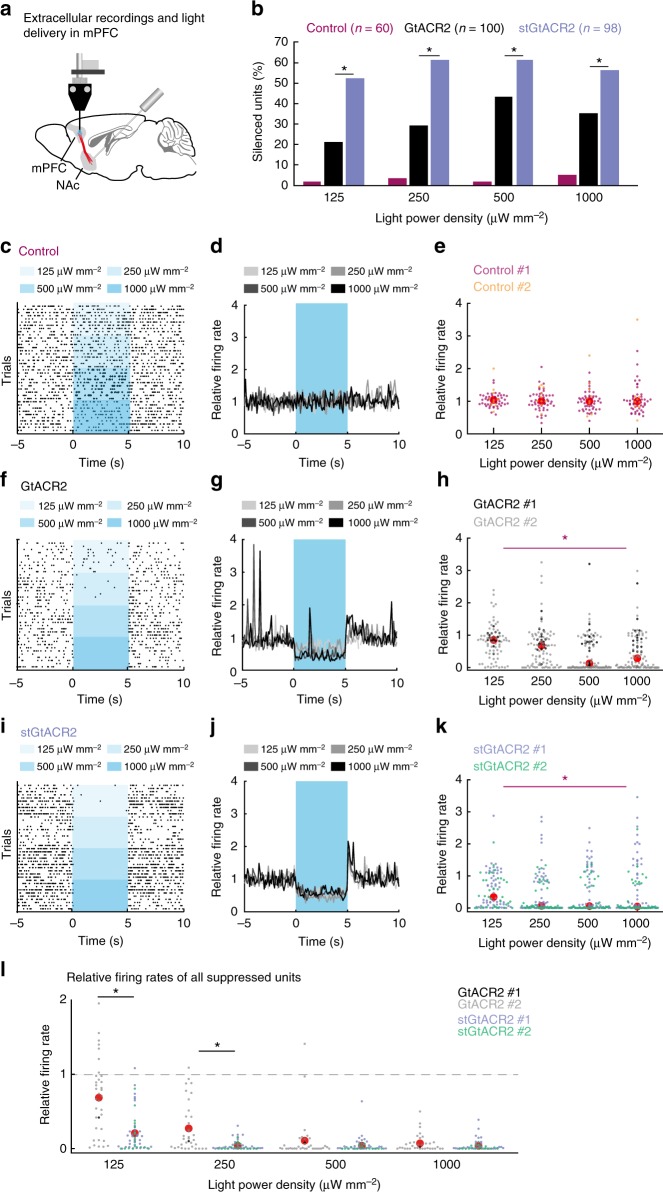
Optogenetic silencing allows time-resolved functional interrogation of defined neuronal populations. However, the limitations of inhibitory optogenetic tools impose stringent constraints on experimental paradigms. The high light power requirement of light-driven ion pumps and their effects on intracellular ion homeostasis pose unique challenges, particularly in experiments that demand inhibition of a widespread neuronal population in vivo. Guillardia theta anion-conducting channelrhodopsins (GtACRs) are promising in this regard, due to their high single-channel conductance and favorable photon-ion stoichiometry. However, GtACRs show poor membrane targeting in mammalian cells, and the activity of such channels can cause transient excitation in the axon due to an excitatory chloride reversal potential in this compartment. Here, we address these problems by enhancing membrane targeting and subcellular compartmentalization of GtACRs. The resulting soma-targeted GtACRs show improved photocurrents, reduced axonal excitation and high light sensitivity, allowing highly efficient inhibition of neuronal activity in the mammalian brain.


Conflict of interest statement

The authors declare no competing interests.

Figures

Fig. 1
Fig. 1
GtACR2 shows greater photocurrents than eACRs, but triggers antidromic spiking in axons. a Sample whole-cell voltage-clamp photocurrent recording of a GtACR2-expressing cell illuminated (470 nm) with increasing light power density. Channel closing kinetics (τoff) was determined by a single exponential fit (I(t) = I0*e^(-t*τoff-1) + C, I0: Current measured at light offset, C: holding current at Vhold; mean ± SEM; n = 10). b Comparison of stationary photocurrents of blue light-sensitive ACRs (Vhold = −35 mV, current after 1 s of continuous illumination). Neurons expressing GtACR2 (n = 12) showed the highest photocurrents compared with neurons expressing iC + + (n = 12) and iChloC (n = 15). ANOVA, F(2,36) = 36.92, p = 1.9*10−9. Data are presented as mean ± SEM. c Representative image of GtACR2 localization. Cyan: GtACR2, magenta: cytoplasmic RFP, yellow: DAPI. Scale bar, 10 µm. d Representative whole-cell current-clamp recording of a GtACR2-expressing cell silenced by light application. Inset: strongly attenuated spike occurring shortly after light onset. e Representative whole-cell voltage-clamp recording of escaped action potentials in response to 1 ms light pulses. Pie charts depict the number of neurons with induced spikes for the three tested light-gated chloride channels: GtACR2, iC + + and iChloC. f Illumination of distal neurites induces spiking in cultured neurons. Schematic depicting the outline of a GtACR2-expressing neuron overlaid with the locations of laser illumination spots. Shown are whole-cell voltage-clamp responses to spatially restricted illumination at the indicated locations
Fig. 2
Fig. 2
Overexpression of KCC2 reduces antidromic spiking in cultured hippocampal neurons. a Images from a KCC2 overexpression experiment. Endogenous KCC2 is expressed in the somatic compartment, while overexpression of KCC2 led to increased expression in axonal projections. Cultured hippocampal neurons were sparsely transfected either with GFP alone (ctrl) or GFP and KCC2. Neurons were then fixed and stained for MAP2 and KCC2. Top images show a representative region of interest with one overexpressing cell in the center. The arrow indicates a neuronal cell body expressing endogenous KCC2 levels at 16 days in vitro (DIV). Bottom images depict MAP2-expressing dendrites and a single MAP2-negative axon (arrow), which is positive for overexpressed KCC2 based on its anti-KCC2 fluorescence. Scale bars, top: 150 µm, bottom: 5 µm. b Quantification of axonal KCC2 immunofluorescence for immature (DIV7) and mature control neurons (DIV16) and neurons overexpressing KCC2, normalized to the average axonal KCC2 signal in immature neurons (DIV7). Axonal KCC2 fluorescence is significantly higher in KCC2-overexpressing cultures. (Kruskal–Wallis H-test, H(2,44) = 29.26,p< 10−4; ctrl: nDIV7 = 11, nDIV16 = 10, KCC2: n = 23) ce Physiological properties and light-evoked spiking in cultured hippocampal neurons expressing either only GtACR2, or co-expressing KCC2. c Effect of KCC2 overexpression on the IV-curve. The reversal potential did not differ significantly (Student’s t-test, t = 1.5, GtACR2: n = 14, GtACR2 + KCC2: n = 18, p = 0.15). d Comparison of the minimal current injection to induce an action potential (rheobase). KCC2-overexpressing neurons did not differ from GtACR2 only-expressing neurons (Student’s t-test, t = 0.5, GtACR2: n = 21, GtACR2 + KCC2: n = 22, p = 0.7). e KCC2 overexpression significantly reduced the likelihood of GtACR2-mediated action potential generation. (Mann–Whitney, U = 146.5, GtACR2: n = 21, GtACR2 + KCC2: n = 22, p = 4*10−2). Seventy-six percent of GtACR2-expressing and 50% of GtACR2 + KCC2-expressing neurons showed an AP in at least one trial (pie charts). All results are presented as mean ± SEM
Fig. 3
Fig. 3
Targeting GtACR2 to the neuronal soma leads to enhanced photocurrent amplitude. a Schematic of different targeting approaches. GtACR2 transmembrane helix configuration based on C1C2 crystal structure. b Image showing the fluorescence resulting from AAV-mediated cytosolic fluorophore expression in the mPFC. Transduction is most dense at the injection site (indicated by the lower dashed box) and sparse along the injection needle track (upper dashed box). Schematic adapted with permission from. Scale bar, 1 mm. ce Higher magnification images of the areas indicated in b. c Magnified images of the injection site. Scale bar, 250 µm. d Magnified images of the more dorsal region of sparse expression. Scale bar, 250 µm. e Higher magnification of d. stGtACR2 and stGtACR2-PEST show enrichment at the soma. Scale bar, 50 µm. f Quantification of soma restriction by normalizing mPFC layer 1 fluorescence by the mean fluorescence measured at the injection center. Targeting reduces relative layer 1 fluorescence (GtACR2: n = 2; all other groups: n = 4). g Light power density dependence of stationary photocurrents in whole-cell patch-clamp recordings of neurons in acute brain slices. Inset: Representative whole-cell voltage-clamp recording. The stationary photocurrent was defined as the photocurrent at the end of a 1 s light pulse. The photocurrent fit (I(LPD) = Imax*LPD* (EPD50 + LPD))−1 was performed per cell with the effective light power density (LPD) for 50% photocurrent (EPD50) as free parameter. stGtACR2 and stGtACR2-PEST had a significantly higher maximal stationary photocurrent than GtACR2 (ANOVA, F(2,23) = 11.84, p = 2.9*10−4; GtACR2: n = 8, stGtACR2: n = 10, stGtACR2-PEST: n = 8). Fits to previously-published peak photocurrents for eArch3.0 and eNpHR3.0 are shown for reference (with permission from). Results are presented as mean ± SEM
Fig. 4
Fig. 4
Targeting GtACR2 to the somatodendritic compartment attenuates axonal excitation. a Comparison of the incidence of antidromic spikes triggered by 1 ms light pulses in virally transduced cultured hippocampal neurons. eGtACR2 has a significantly increased AP incidence, while stGtACR2 decreases the occurrence of APs (Kruskal–Wallis H-test, H(3,97) = 47, p < 10−4; GtACR2: n = 20, eGtACR2: n = 22, stGtACR2: n = 22, stGtACR2-PEST: n = 33). b Peak photocurrents did not differ significantly between the constructs, showing that reduced AP incidence in stGtACR2 transduced neurons does not stem from smaller photocurrents (ANOVA, F(3,82) = 0.83, p = 0.48). c Schematic of the experimental set-up to characterize GtACR2 triggered axonal neurotransmitter release in acute brain slices. Virus encoding a cytosolic fluorophore was co-injected with the GtACR2 variants to allow for visualization of the axon terminals of transduced cortico-cortical projection neurons. Contralateral neurons in areas with high fluorescence intensity were recorded. Scale bar, 1 mm. d Representative traces of excitatory post-synaptic currents in response to 1 ms light pulses (470 nm, at 4.5 mW mm−2). e Quantification of the light-evoked post-synaptic current amplitude. Soma-targeting led to significant reduction in light-evoked EPSCs amplitudes (ANOVA, F(2,22) = 5.54, p = 1.13*10−2). All results are presented as mean ± SEM
Fig. 5
Fig. 5
Targeting GtACR2 to the somatodendritic compartment increases its efficacy of silencing in vivo. a Schematic of experimental paradigm (adapted with permission from ). Extracellular recordings from the mPFC were performed with a movable multi-wire optrode following AAV-mediated expression of GtACR2 or stGtACR2 in the mPFC. Inhibition was characterized in response to 5 s of mPFC illumination (460 nm). Four light power densities were tested, ten repetitions each. b Percentage of units with significantly reduced firing rates compared to a 5 s pre-light period. c A representative raster plot of a unit recorded in a non-transduced control mouse. d Peri-stimulus time histograms depicting the average relative firing rate (FR during light/pre-light-FR, 100 ms bins) of all recorded units. e Relative firing rate (FR during light/pre-light-FR) of all units recorded from non-expressing mice (n= 60 units from n = 2 mice in n= 10 recording sites). Each data point corresponds to a single unit, and its color corresponds to the mouse from which it was recorded. Red circles denote median values across all recorded units. fk As ce for GtACR2-injected mice (fh; n= 100 units from n = 2 mice in n= 13 recording sites) and for stGtACR2-injected mice (ik; n= 98 units from n = 2 mice in n= 13 recording sites). The response to light delivery was significantly different from control mice (repeated measures ANOVA; *p < 0.01, statistical tests and exact p-values are stated in the Results). Data points with values larger than 4 (GtACR2: n = 1; stGtACR2: n = 3 such points) are not shown in order to improve data visibility. Statistical tests and descriptive statistics were computed using all data. l Reduction in firing rate (FR during light/pre-light-FR) of units that showed significant FR suppression. stGtACR2 enables higher-efficiency neuronal suppression than GtACR2 at the two lowest light powers tested (repeated measures ANOVA; *p < 0.02, statistical tests and exact p-values are stated in the Results; each data point corresponds to a single unit, and its color corresponds to the mouse from which it was recorded. Red circles denote mean values across all displayed units. See Supplementary Table 1 for individual mouse data)
Fig. 6
Fig. 6
Targeting GtACR2 to the somatodendritic compartment attenuates antidromic spiking in distal axons. a Schematic of experimental paradigm (adapted with permission from ), performed in the same mice depicted in Fig. 5. Extracellular recordings from the mPFC were performed with a movable optrode following AAV-mediated GtACR2 or stGtACR2 expression in the mPFC. Antidromic spiking was characterized in response to mPFC or NAc illumination (460 nm; mPFC − 5 ms and 5 s pulses; NAc − 5 ms pulses). Four light power densities were tested. bd Raster plots of light onset-associated responses in units recorded from GtACR2-expressing mice. b, c All mPFC units that showed rapid light-evoked responses during a 20 ms time-window starting with the onset of either a 5 ms (b) or 5 s (c) light pulse (1 mW mm−2, corresponding to 28.8 mW at the fiber tip; 24 out of 100 units). Units are arranged from top to bottom according to their mean first spike latency in response to the 5 ms pulse. d All mPFC units that showed rapid light-evoked responses to a short (5 ms; 20 trials, 14 of 73 units) light pulse delivered to the NAc (1 mW mm−2). Units are arranged from top to bottom according to their mean first spike latency. e Summary of light-evoked responses in units recorded from GtACR2-expressing mice. Depicted are the percentages of mPFC units that showed light-evoked responses to pulses in the mPFC (5 ms, blue; 5 s, gray) and NAc (5 ms, magenta). fi As in be for stGtACR2 (fg: 26 of 98 units; h: 2 of 70 units). At the highest light power used, units recorded from stGtACR2-expressing mice showed a significant reduction in antidromic spiking when light was delivered to the NAc, compared with units recorded from GtACR2-expressing mice in these conditions. *p < 0.02, statistical tests and exact p-values are stated in the Results
Fig. 7
Fig. 7
Soma-targeted GtACRs allow widespread cortical silencing. a Representative images of c-Fos expression in a mouse expressing stGtACR1, which was illuminated with yellow light (593 nm, 6 mW) during enriched environment exposure. c-Fos expression in the area surrounding the optic fiber implant (white arrow) was reduced. Scale bar, 500 µm. b Schematic of the quantification of change in the number of detected c-Fos-positive nuclei. The ipsilateral region was divided to AAV-expressing regions and regions showing no expression. The number of detected c-Fos-positive nuclei was then normalized to the sum of c-Fos-positive nuclei in a given region (i.e., either the expressing or non-expressing regions in the AAV-injected hemisphere) and its homologous contralateral non-expressing region, resulting in a ratio ranging from 0 (all detected c-Fos-positive nuclei are on the contralateral side) to 1 (all detected c-Fos-positive nuclei are on the ipsilateral side). This normalization was meant to correct for variability in the density of c-Fos-positive nuclei across different mPFC regions. If c-Fos expression is equal across hemispheres, a ratio of 0.5 is expected. c Measured effects under the following conditions from left to right: Light delivery (593 nm, n = 3 or 460 nm, n = 2; light at 6 mW) in fluorophore-expressing control mice (t = − 0.05, n = 5, p = 0.96); No light delivery in stGtACR1- (n = 3) and stGtACR2-expressing (n = 4) mice (t = −1.9, n = 7, p = 0.32); Illumination with 593 nm light at 6 mW in eNpHR3.0-expressing mice (t = − 0.88, n = 6, p = 0.84); Illumination with 593 nm light at 6 mW in stGtACR1-expressing mice (t = 5.2, n = 5, p = 1.78*10−2); Illumination with 460 nm light at 6 mW in stGtACR2-expressing mice (t = 4.6, n = 6, p = 2.28 × 10−2). Reported p-values are based on paired t-tests with Holm–Bonferroni correction. d Ratio of DAPI nuclei counts in non-expressing ipsilateral regions (CR) and expressing ipsilateral regions (ER) calculated as explained in b for c-Fos counts (stGtACR1, n = 3; stGtACR, n = 4; paired-sample t-test, t = −0.1, n = 7, p = 0.92). All results are presented as mean ± SEM
Fig. 8
Fig. 8
Silencing of cue-associated BLA activity using stGtACR2 suppresses extinction of cued freezing. a Schematic diagram depicting the location of AAV injections and fiber implants in the BLA of stGtACR2 mice (n = 8) and eYFP controls (n = 8; Schematic based on ). Scale bar, 2 mm. b stGtACR2-expressing and control (eYFP) mice were subjected to auditory fear conditioning (day 1, conditioning), extinction training (day 3, early and late extinction) and extinction recall (day 4, early and late recall). During auditory fear conditioning mice were subjected to five tone (CS)-shock (US) presentations in context A. On day 3 twenty 30 s tone (CS) presentations were paired with light (30 s constant 447 nm light at 5 mW at the fiber tip) in context B. On day 4 extinction recall was tested by twenty 30 s tone presentations in context B. c Percentage of freezing during presentation of the CS (top row) and the 30 s prior to CS (bottom row). The bar graphs depict the mean percentage of freezing during the early and late phases of the trials for the two groups (early phase: first 10 CS presentations, late phase: last 10 CS presentations). Mean freezing levels for control and stGtACR2 mice, during the early recall phase, were 28 ± 4% and 54 ± 6%, respectively; the distributions of the two groups differed significantly (Scheirer Ray Hare test H = 4.30, p = 3.8*10−2). d Freezing in response to context A exposure on day 10 (Mann–Whitney U = 25, p = 0.25). e Characterization of the behavior of control and stGtACR2-expressing mice in an open field arena with no light delivery. No differences were found between the two groups in velocity (Mann–Whitney U = 29, p = 0.40), time spent in the center (Mann–Whitney U = 19, p = 0.09) and number of entries to the center (Mann–Whitney U = 31, p = 0.48). All results are presented as mean ± SEM

References

    1. Wurtz RH. Using perturbations to identify the brain circuits underlying active vision. Philos. Trans. R. Soc. B. 2015;370:20140205. doi: 10.1098/rstb.2014.0205. - DOI - PMC - PubMed
    1. Deisseroth K. Optogenetics. Nat. Methods. 2011;8:26–29. doi: 10.1038/nmeth.f.324. - DOI - PMC - PubMed
    1. Han X, Boyden ES. Multiple-color optical activation, silencing, and desynchronization of neural activity, with single-spike temporal resolution. PLoS ONE. 2007;2:e299. doi: 10.1371/journal.pone.0000299. - DOI - PMC - PubMed
    1. Zhang F, et al. Multimodal fast optical interrogation of neural circuitry. Nature. 2007;446:633–639. doi: 10.1038/nature05744. - DOI - PubMed
    1. Chow BY, et al. High-performance genetically targetable optical neural silencing by light-driven proton pumps. Nature. 2010;463:98–102. doi: 10.1038/nature08652. - DOI - PMC - PubMed

Publication types

MeSH terms