. 2018 Oct 8;9(1):4151.
doi: 10.1038/s41467-018-06704-1.

Direct protein-lipid interactions shape the conformational landscape of secondary transporters

Affiliations

Direct protein-lipid interactions shape the conformational landscape of secondary transporters

Chloe Martens et al. Nat Commun. .

Abstract

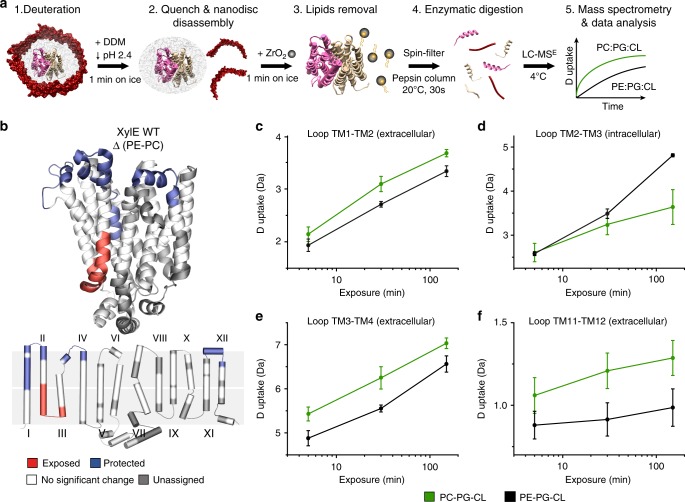
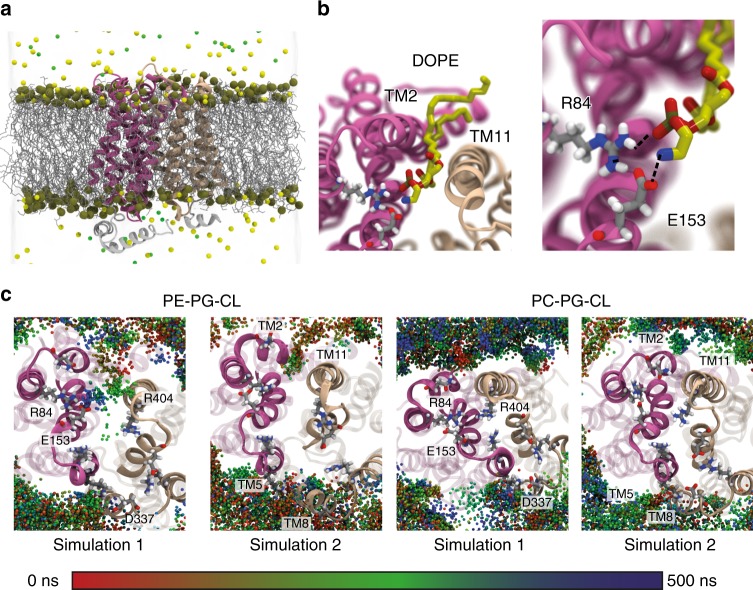
Secondary transporters undergo structural rearrangements to catalyze substrate translocation across the cell membrane - yet how such conformational changes happen within a lipid environment remains poorly understood. Here, we combine hydrogen-deuterium exchange mass spectrometry (HDX-MS) with molecular dynamics (MD) simulations to understand how lipids regulate the conformational dynamics of secondary transporters at the molecular level. Using the homologous transporters XylE, LacY and GlpT from Escherichia coli as model systems, we discover that conserved networks of charged residues act as molecular switches that drive the conformational transition between different states. We reveal that these molecular switches are regulated by interactions with surrounding phospholipids and show that phosphatidylethanolamine interferes with the formation of the conserved networks and favors an inward-facing state. Overall, this work provides insights into the importance of lipids in shaping the conformational landscape of an important class of transporters.


Conflict of interest statement

The authors declare no competing interests.

Figures

Fig. 1
Fig. 1
HDX-MS reports on changes in the conformational equilibrium between IF and OF states. G to W mutants were used to highlight shifts in the conformational equilibrium. a Introduction of a tryptophan at the extracellular end of helix 2 sterically prevents closing. After deuteration, enzymatic digestion, and identification of the peptides by MS the mass uptake of the WT and mutants is compared. Peptides located on the intracellular side will be on average more deuterated than the peptides located on the extracellular side for the mutant (top graph) while the opposite pattern will be observed for the WT (bottom graph). b Differential deuterium uptake pattern (ΔHDX) mapped onto the 3D and topological structure of LacY (PDB: 2V8N), GlpT (PDB: 1PW4), and XylE (PDB: 4GBY). Red and blue colored regions indicate segments containing peptides with a positive ΔHDX (red—more deuteration) or negative ΔHDX (blue—less deuteration), respectively; white regions indicate that no significant ΔHDX is observed (P ≤ 0.01), and gray indicates regions where peptides were not obtained for both the mutant and the WT conditions. The yellow star indicates the location of the point mutation. All measurements were performed in triplicates. The ΔHDX datasets are presented as Woods plots in supplementary Figs.12 and 13
Fig. 2
Fig. 2
Conserved charge-relay networks control intracellular opening. Disruption of the networks by conservative mutations (D to N and E to Q) shifts the conformational equilibrium toward the IF state. a Two charge-relay networks of conserved residues stabilize the OF state of XylE. The N- and C-lobes are colored pink and tan, respectively. Close-up of networks 1 and 2—highlighted in green and orange, respectively—show the connection between the two lobes and highlight in red the mutated acidic residues. b ΔHDX between the mutants E153Q, E397Q, and D337N vs. WT mapped onto the 3D and topological structure of XylE. c ΔHDX of the mutants D68N, and E139Q vs. WT mapped onto the 3D and topological structure of LacY. d ΔHDX of the mutants E374Q and D314N mapped onto the 3D and topological structure of GlpT. All measurements were performed in triplicates on two biological replicates. The ΔHDX datasets are presented as Woods plots in supplementary Figs. 12 and 13
Fig. 3
Fig. 3
Lipid–protein interactions regulate the conformational equilibrium. ΔHDX of XylE WT in PE vs. PC nanodiscs shows that PE promotes the IF conformation. a Optimized experimental procedure for HDX-MS of a transporter in nanodiscs of different lipid compositions. Following deuteration at specific time points, the exchange reaction is quenched and the nanodiscs disassembled with detergent DDM. Lipids are removed by adsorption, before enzymatic digestion and peptides identification by MS. The mass uptake of the protein in both lipid environments is then compared. b ΔHDX of WT XylE in DOPE-PG-CL nanodiscs (native-like) minus DOPC-PG-CL (control) nanodiscs mapped on the PDB structure and the topological representation. c Representative deuterium uptake plots for peptide 28–38, (d) 70–88, (e) 108–122, (f) 430–434 in DOPC-PG-CL nanodiscs (green) and DOPE-PG-CL nanodiscs (black). Standard deviations for each time point are plotted as error bars (n  =  3). All measurements were performed in triplicates
Fig. 4
Fig. 4
MD simulations reveal that PE–protein interactions perturb the charge-relay networks. MD simulations predict specific interactions between the PE headgroup and charged residues of networks 1 and 2 in XylE. a Simulation box. Representative snapshot of XylE (PDB: 4JA4) embedded in an explicit lipid bilayer and water box with 100  mM NaCl. Lipid molecules are shown in line representation colored in silver, phosphorus atom of the headgroup represented by orange spheres. Yellow and green spheres represent Na + and Cl- ions, respectively. b Representative snapshot of the close-up of network 1 interacting with the PE headgroup of the phospholipid. Polar interactions with R84 and E153 prevent network formation and steric hindrance prevents contacts of the TM2 and TM11. c Location of the phosphorus atoms of the PE/PC lipid molecule in two 500  ns trajectories in PE:PG:CL bilayers (left) and PC:PG:CL bilayers (right). The spheres are color coded: red at t  =  0  ns and blue at t  =  500  ns. In both simulations 1 and 2, PE lipids wedge between the helices (more so in simulation 1), but no lipid–protein interaction is observed in PC bilayers. In simulation 1, direct interactions with residues R84, E153 and R404 of network 1 are observed
Fig. 5
Fig. 5
Closing of the intracellular side of XylE in PC:PG:CL bilayers. MD simulations predict different conformational changes of XylE in PC vs. PE bilayers. a Representative snapshots at the beginning (t  =  0  ns) and end of the simulation (t  =  500  ns) show a closing of the intracellular side in PC nanodisc (left) compared to PE nanodisc (right). b Time trace showing the intracellular gate distance over simulation time. PC simulation sets are coloured orange and red, while the PE simulation sets are coloured green and blue. The inset on the right depicts the normalized distribution of the intracellular gate distance for the last 200  ns of the trajectory. c Snapshot describing the definition of the intracellular gates in XylE. The intracellular gating distance is defined as the center of mass (COM) distance between the two groups of Ca-Ca residues: group1 residues (75–80, 149–154, 160–16) and group2 residues (332–337, 391–397, 404–410)
Fig. 6
Fig. 6
Disruption of conserved charge networks abolishes or decreases lipid-induced conformational shift. ΔHDX of XylE in PE:PG:CL nanodiscs (native-like) minus PC:PG:CL (control) nanodiscs mapped on the PDB structure and the topological representation of XylE for (a) XylE E153Q and (b) XylE E397Q. All measurements were performed in triplicates
Fig. 7
Fig. 7
A lipid-mediated mechanism of transport. Model of secondary transport based on the interaction between charge-relay networks of XylE and PE phospholipid (i) Substrate (orange) binds from the extracellular side and stabilizes the OF conformation. (ii) Proton binding triggers closure of the extracellular side. (iii) The fully loaded transporter transitions towards an occluded conformational intermediate. Proton translocates through the transporter to the conserved charge-relay networks (pink) on the intracellular side (iv) Disruption of the charge networks opens the intracellular side. Spontaneous deprotonation upon exposure to the slightly basic cytosol leads to intracellular proton release. (v) Direct interactions between PE and the transporter stabilize the inward-facing conformation, thus facilitating substrate release and completing the transport cycle. Reformation of the cytoplasmic charge-relay networks leads to the subsequent conformational switch. (vi) is equivalent to (i)

References

    1. Marger MD, Saier MH., Jr. A major superfamily of transmembrane facilitators that catalyse uniport, symport and antiport. Trends Biochem. Sci. 1993;18:13–20. - PubMed
    1. Colas C, Ung PM, Schlessinger A. SLC transporters: structure, function, and drug Discovery. Medchemcomm. 2016;7:1069–1081. doi: 10.1039/C6MD00005C. - DOI - PMC - PubMed
    1. Adekola K, Rosen ST, Shanmugam M. Glucose transporters in cancer metabolism. Curr. Opin. Oncol. 2012;24:650–654. doi: 10.1097/CCO.0b013e328356da72. - DOI - PMC - PubMed
    1. Galli L, et al. Mutations in the glucose-6-phosphate transporter (G6PT) gene in patients with glycogen storage diseases type 1b and 1c. FEBS Lett. 1999;459:255–258. doi: 10.1016/S0014-5793(99)01248-X. - DOI - PubMed
    1. Radestock S, Forrest LR. The alternating-access mechanism of MFS transporters arises from inverted-topology repeats. J. Mol. Biol. 2011;407:698–715. doi: 10.1016/j.jmb.2011.02.008. - DOI - PubMed

Publication types

MeSH terms