. 2018 Nov;14(11):1032-1042.
doi: 10.1038/s41589-018-0136-y. Epub 2018 Oct 8.

MCT2 mediates concentration-dependent inhibition of glutamine metabolism by MOG

Affiliations

MCT2 mediates concentration-dependent inhibition of glutamine metabolism by MOG

Louise Fets et al. Nat Chem Biol. 2018 Nov.

Erratum in

Abstract

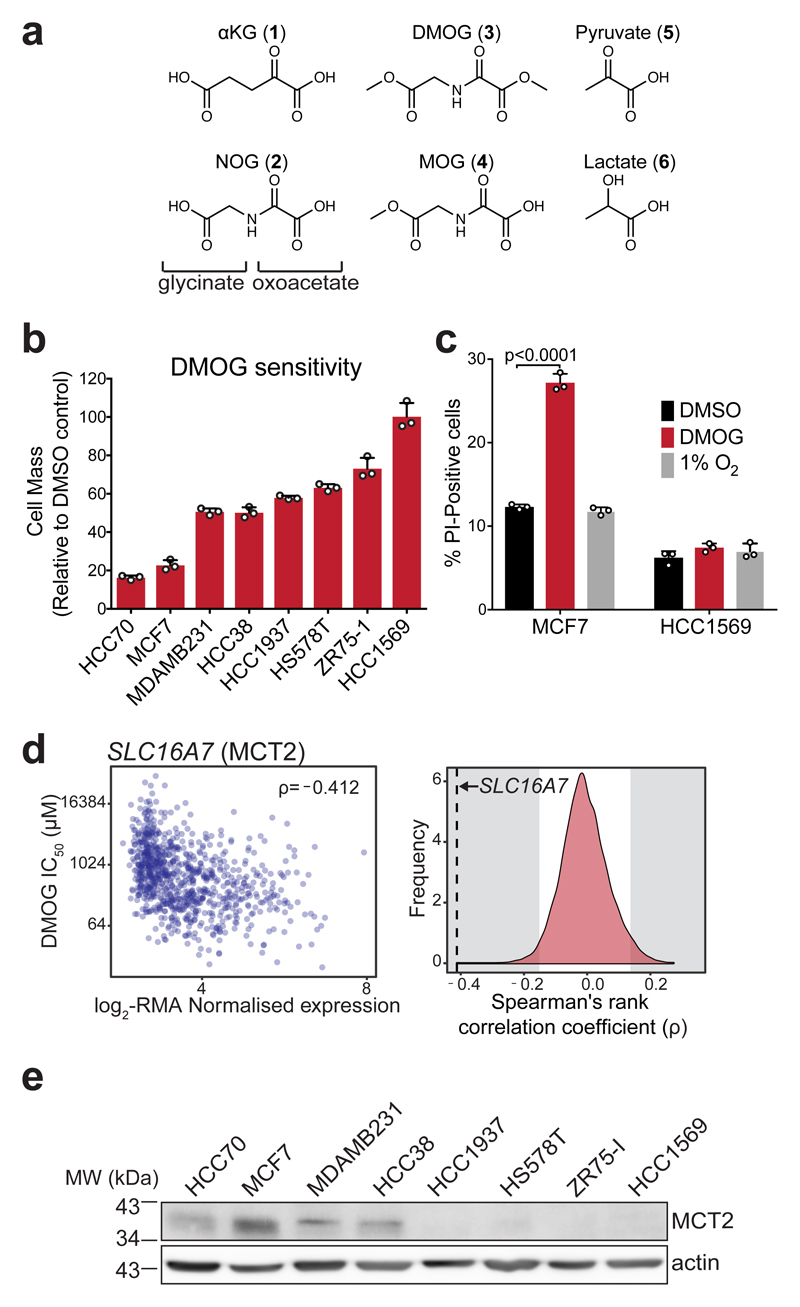
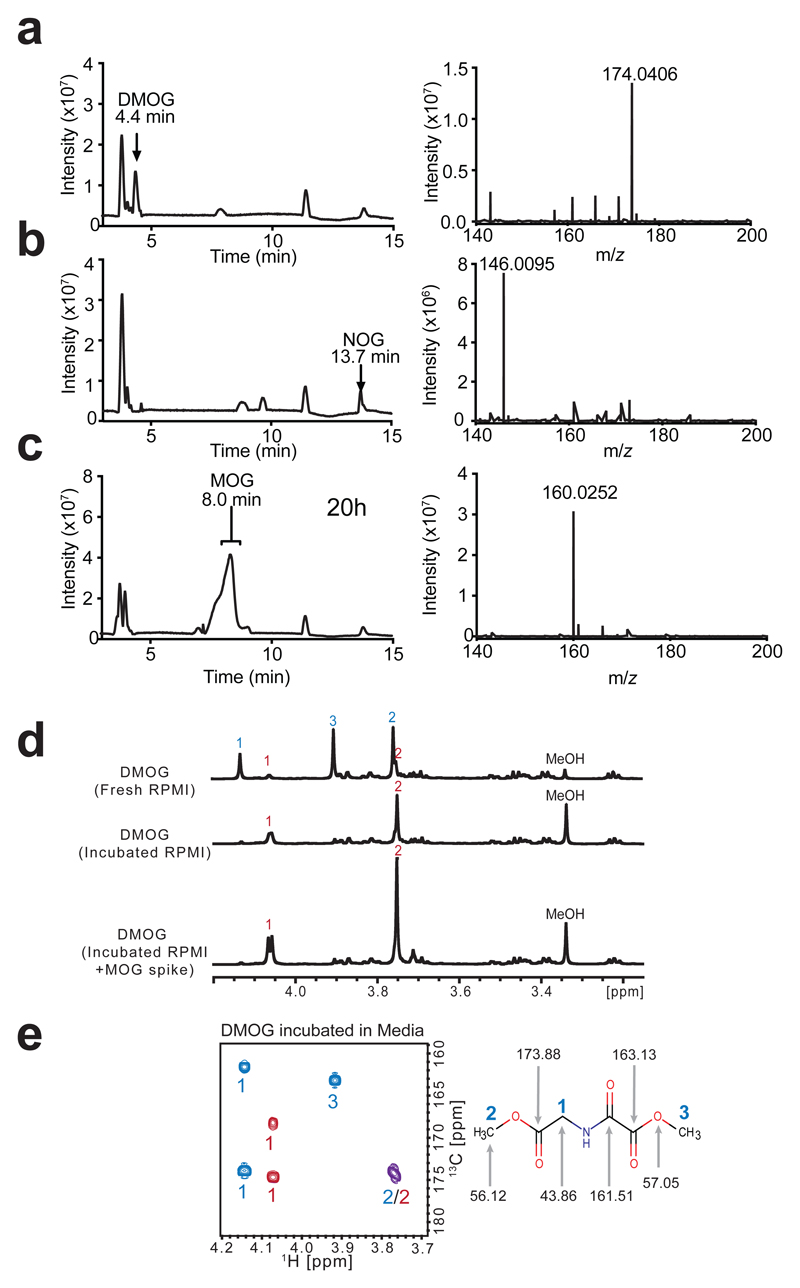
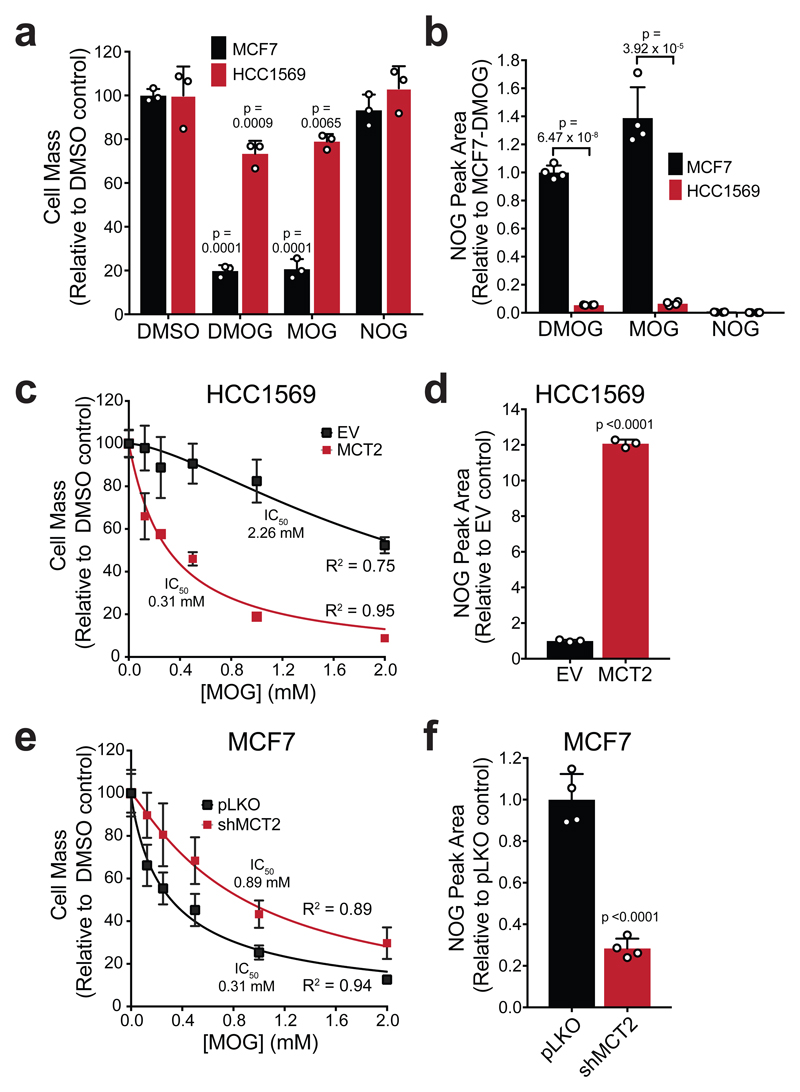
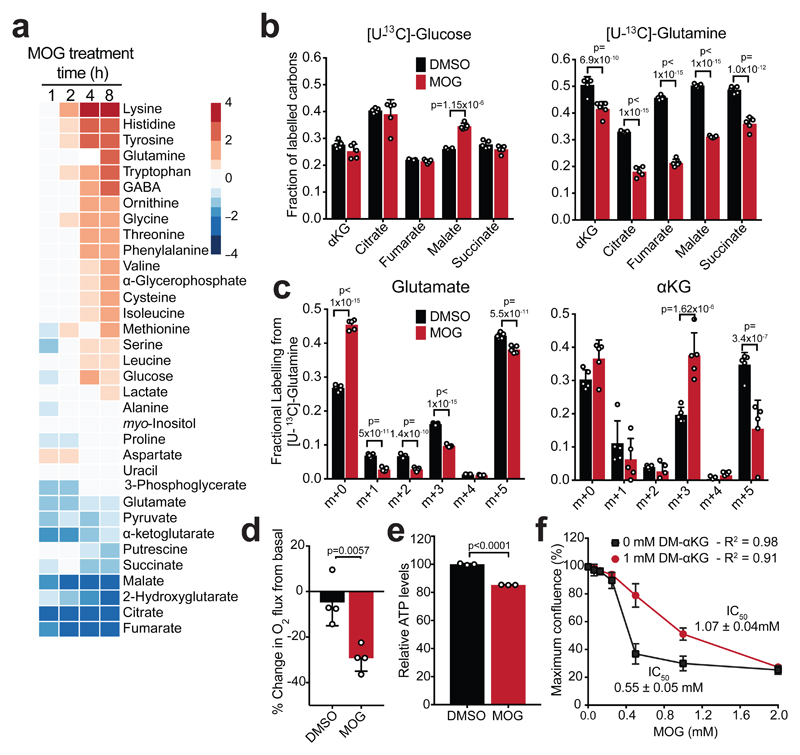
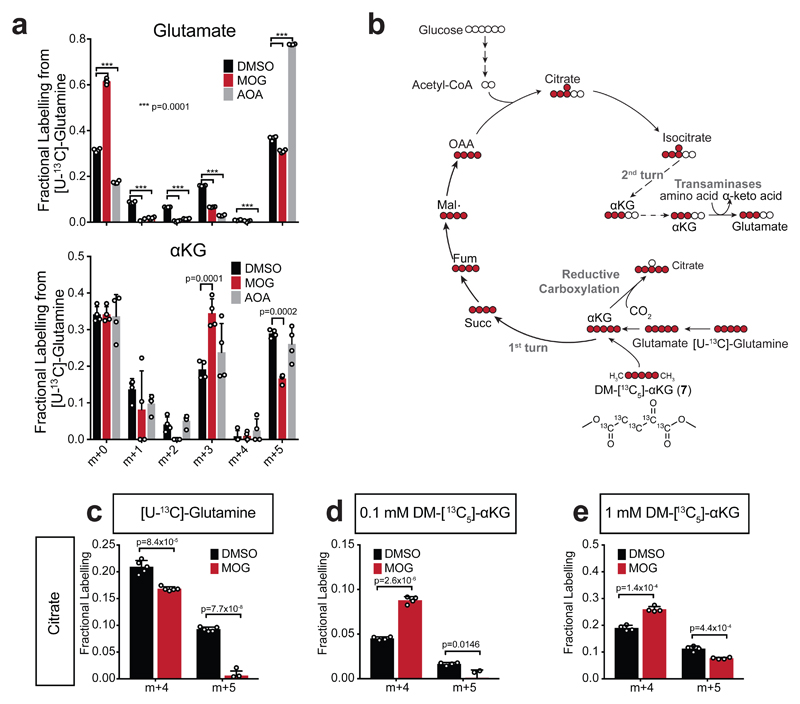
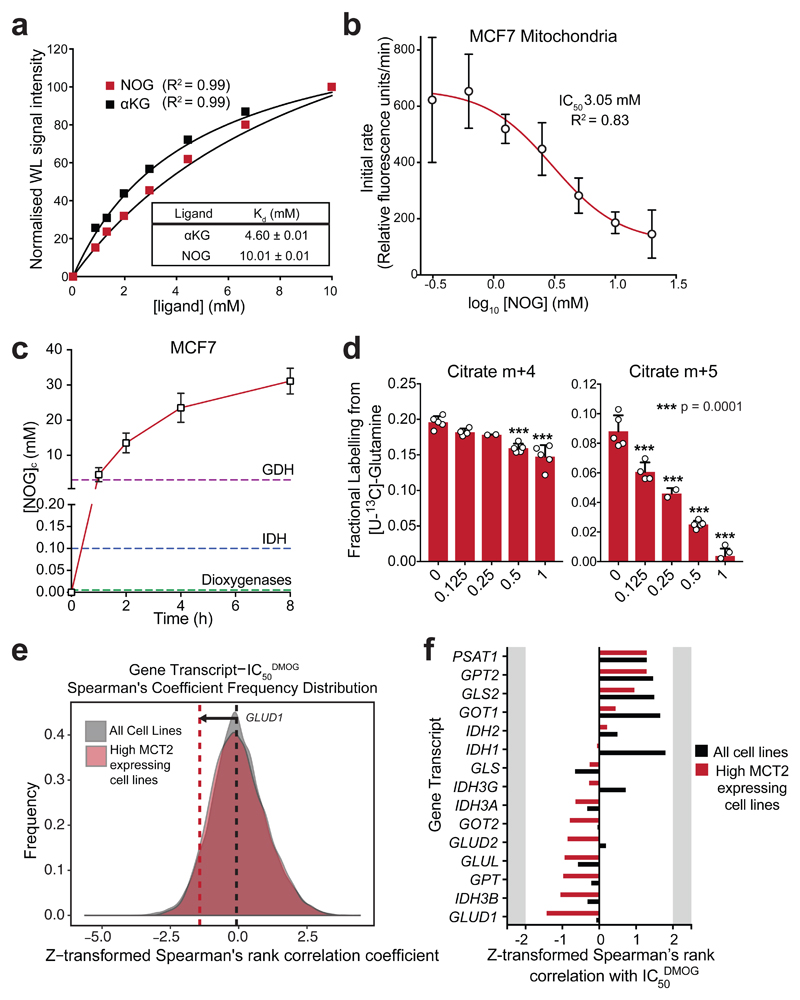
α-Ketoglutarate (αKG) is a key node in many important metabolic pathways. The αKG analog N-oxalylglycine (NOG) and its cell-permeable prodrug dimethyloxalylglycine (DMOG) are extensively used to inhibit αKG-dependent dioxygenases. However, whether NOG interference with other αKG-dependent processes contributes to its mode of action remains poorly understood. Here we show that, in aqueous solutions, DMOG is rapidly hydrolyzed, yielding methyloxalylglycine (MOG). MOG elicits cytotoxicity in a manner that depends on its transport by monocarboxylate transporter 2 (MCT2) and is associated with decreased glutamine-derived tricarboxylic acid-cycle flux, suppressed mitochondrial respiration and decreased ATP production. MCT2-facilitated entry of MOG into cells leads to sufficiently high concentrations of NOG to inhibit multiple enzymes in glutamine metabolism, including glutamate dehydrogenase. These findings reveal that MCT2 dictates the mode of action of NOG by determining its intracellular concentration and have important implications for the use of (D)MOG in studying αKG-dependent signaling and metabolism.


Conflict of interest statement

Competing Financial Interests Statement

The authors declare no competing interests.

Figures

Figure 1
Figure 1. DMOG induces cytotoxicity that correlates with MCT2 expression and is not explained by differential inhibition of oxygen-sensitive dioxygenases
a) Structures of αKG (1), NOG (2), DMOG (3) and MOG (4) (formed by de-esterification of DMOG in cells) shown alongside and the monocarboxylates pyruvate (5) and lactate (6) to illustrate structural similarities. b) Cell mass accumulation of human breast cancer cell lines after 48 h treatment with 1 mM DMOG, relative to their respective vehicle (0.1% DMSO)-treated controls. Data shown as mean ± SD (n = 3 experimental replicates). c) Measurement of propidium iodide (PI) uptake by flow cytometry to quantify cell death in MCF7 and HCC1569 cells treated for 48 h with vehicle (0.1% DMSO), 1 mM DMOG, or cultured at 1% O2 for 48 h (to inhibit dioxygenases). DMOG- and DMSO-treated cells were cultured at 21% O2. Data shown as mean ± SD (n = 3 experimental replicates), significance tested by 2-way ANOVA with Tukey’s multiple comparison correction. d) Left: Correlation of robust multi-array average (RMA)-normalised SLC16A7 (encoding MCT2) mRNA expression and IC50DMOG across 850 different cancer cell lines. Data obtained from the Genomics of Drug Sensitivity in Cancer project (http://www.cancerrxgene.org). Spearman’s rank correlation coefficient is shown in the top right corner. Right: Spearman’s rank correlation coefficient of SLC16A7 (black dashed line) with respect to those of all other transcripts. Grey shaded region on either side indicates ±2-standard deviations cut-off used to define sensitivity-associated genes. e) Western blot to assess MCT2 protein expression in lysates from breast cancer cell lines used in (b). Experiment performed once. Uncropped blot available in Supplementary Fig. 13a.
Figure 2
Figure 2. The methyl oxoacetate ester of DMOG is rapidly hydrolysed in cell culture media to yield MOG
a) LC-MS base-peak chromatogram and corresponding mass spectrum of 10 µM DMOG in water, with peak and ion annotated. b) LC-MS base-peak chromatogram and corresponding mass spectrum of 10 µM NOG in water, with peak and ion annotated. c) LC-MS base-peak chromatogram demonstrating the MOG peak formed after incubation in water for 20 h at room temperature. Right: mass spectrum of MOG peak, with ion corresponding to MOG annotated. d) 1D-1H-NMR spectra of DMOG freshly resuspended in RPMI medium, or after incubation in RPMI medium overnight, with and without the addition of a synthesised MOG standard. Signals annotated according to the labelled structure of DMOG in (e), DMOG peaks with blue numbers and MOG peaks with red numbers. e) 2D-1H,13C-HMBC-NMR spectrum of DMOG incubated in RPMI media, DMOG peaks with blue numbers and MOG peaks with red numbers, overlapping cross-peak shown in purple. Right: DMOG structure annotated with the relevant 13C signal shifts. Data are representative of more than 3 independent experiments each with similar results.
Figure 3
Figure 3. MOG is sufficient to cause cytotoxicity in an MCT2-dependent manner
a) Cell mass accumulation of MCF7 and HCC1569 cells after treatment with 1 mM DMOG, MOG or NOG for 48 h relative to the respective 0.1% DMSO controls. Data shown as mean ± SD (n = 3 experimental replicates), significance was tested by 1-way ANOVA and corrected for multiple comparisons to the DMSO control using Dunnet’s post-hoc test. b) Intracellular NOG concentrations ([NOG]ic) in MCF7 and HCC1569 cells after 4 h incubation with 1 mM of either DMOG, MOG or NOG. Reported concentrations are normalized to cell number. Data shown as mean ± SD (n = 4 experimental replicates), and significance was tested using 2-sided multiple t-tests with Holm-Sidak multiple comparison correction. c) IC50 curve of cell mass accumulation for HCC1569 cells expressing either empty vector (EV) or MCT2, after incubation with increasing concentrations of MOG for 48 h, relative to vehicle-only control (0.2% DMSO). Data shown as the mean ± SD of n = 3 experimental replicates and are representative of three independent experiments. Curve was fitted using the [inhibitor] vs normalised response (variable slope) algorithm in GraphPad Prism. d) Relative [NOG]ic in HCC1569 cells described in (c), after 4 h of incubation with 1 mM MOG. Data shown as mean ± SD (n = 3 experimental replicates) and significance was tested using a 2-sided, unpaired t-test. e) IC50 curve of cell mass accumulation for MCF7 cells expressing either empty vector (pLKO) or shMCT2, after incubation with increasing concentrations of MOG for 48 h, relative to vehicle-only control (0.2% DMSO). Data shown as the mean ± SD of n = 3 experimental replicates and are representative of three independent experiments. Curve was fitted as in (c). f) Relative [NOG]ic in MCF7 cells described in (e), after 4 hours of incubation with 1 mM MOG. Data shown as mean ± SD (n = 4 experimental replicates), and significance was tested using a 2-sided unpaired t-test.
Figure 4
Figure 4. MOG inhibits glutamine catabolism in an MCT2-dependent manner
a) Heatmap showing log2 fold-changes in the abundance of indicated metabolites in MCF7 cells treated with 1 mM MOG, relative to the 0 h control treatment (n = 4 experimental replicates for each condition and time-point). Metabolites are ordered from highest to lowest fold-change value using the 8 h time point. b) Fraction of labelled carbons in TCA cycle metabolite pools in MCF7 cells after 4 h of labelling with [U-13C]-glucose or [U-13C]-glutamine in the presence or absence of 1 mM MOG. Data are shown as mean ± SD (n = 5 experimental replicates for each label). Significance was tested using 2-sided multiple t-tests with Holm-Sidak multiple comparisons correction. c) Isotopologue distribution of glutamate and αKG in MCF7 cells after 4 h of labelling with [U-13C]-glutamine in the presence or absence of 1 mM MOG. Data shown as mean ± SD (n = 5 experimental replicates). Significance was tested using 2-sided multiple t-tests with Holm-Sidak multiple comparisons correction. d) Change in respiration of MCF7 cells from basal after incubation with 0.1% DMSO or 1 mM MOG in RPMI medium. Data shown as mean ± SD (n = 3 experimental replicates). Significance was tested using a 2-sided, unpaired t-test. e) ATP levels in MCF7 cells treated with 0.1% DMSO or 1 mM MOG in RPMI medium for 4 h. Data are shown as mean ± SD of n = 3 experimental replicates and are representative of 3 independent experiments. Significance was tested using a 2-sided, unpaired t-test. f) IC50 curves of cell mass accumulation in MCF7 cells after incubation with increasing concentrations of MOG for 48 h in the absence or presence of 1 mM DM-αKG. Data are shown relative to vehicle-only control (0.2% DMSO) and represent mean ± SD (n = 3 experimental replicates). IC50 calculated using the [inhibitor] vs normalised response (variable slope) algorithm in GraphPad Prism.
Figure 5
Figure 5. Evidence that inhibition of GDH-mediated glutamine carbon flux accounts for MOG-induced metabolic changes associated with cytotoxicity
a) Isotopologue distribution of glutamate and αKG in MCF7 cells after 4 h of labelling with [U-13C]-glutamine in the presence or absence of 1 mM MOG or 1 mM aminooxyacetate (AOA) compared to 0.1% DMSO control. Data shown as mean ± SD (n = 4 experimental replicates) and significance was tested with 2-way ANOVA with Dunnett’s multiple comparisons correction. b) Scheme illustrating theoretical labelling pattern in the indicated metabolites, generated by incubation of cells with either [U-13C]-glutamine or DM-[13C5]-αKG (7). 13C-carbons are shown in red circles and 12C shown in white. c) Quantification citrate m+4 isotopologue (generated by TCA in the oxidative direction), or citrate m+5 isotopologues [generated by reductive carboxylation (RC) of αKG] in MCF7 cells incubated with [U-13C]-glutamine for 4 h in the presence of 0.1% DMSO or 1 mM MOG. Data shown as mean ± SD (n = 5 experimental replicates). Significance was tested with 2-sided multiple t-tests using Holm-Sidak’s correction for multiple comparisons. d) As in (c) but labelling was with tracer amounts (0.1 mM) of DM-[13C5]-αKG (n = 4 experimental replicates). e) As in (c) but labelling was with rescue amounts (1 mM) of DM-[13C5]-αKG (n = 4 experimental replicates).
Figure 6
Figure 6. NOG binds to GDH and inhibits its enzymatic activity
a) Normalised waterLOGSY signal intensities in the presence of increasing concentrations of either αKG or NOG. Kd values were determined by fitting a one-site specific binding curve in GraphPad Prism. Single replicates were taken at each ligand concentration; experiments were performed 3 times with similar results. b) GDH activity in MCF7 cell mitochondrial lysates pre-incubated for 15 min in the presence of increasing concentrations of NOG. Data shown as mean ± SD (n = 3 experimental replicates). IC50 determined by fitting a log[inhibitor] vs response (variable slope, 4 parameters) curve in GraphPad Prism. c) [NOG]ic in MCF7 cells incubated with 1 mM MOG for increasing durations. Data shown as mean ± SD (n = 4 experimental replicates). Dashed lines indicate the measured IC50NOG values of GDH from (a), and those reported for IDH and dioxygenases. d) Quantification of the citrate m+4 isotopologue (generated by TCA in the oxidative direction), and citrate m+5 isotopologue (generated by RC) in MCF7 cells incubated with [U-13C]-glutamine for 4 h in the presence of different concentrations of MOG. Data shown as mean ± SD (5 experimental replicates). Statistical significance tested by one-way ANOVA, and multiple comparisons to the 1 mM MOG control were corrected using Dunnet’s method. e) Frequency distribution graphs of Spearman’s rank correlation coefficient values from all genes vs. IC50DMOG, using all cells lines (850 different cell lines, grey) or only the top quartile of SLC16A7-expressing cell lines (213 cell lines, red) as in (f). The dashed lines represent the correlation coefficient for GDH (GLUD1) and DMOG IC50 in the analysis with all cell lines (850, black), and with only the top quartile of SLC16A7-expressing cell lines (red). f) Correlation coefficients from Spearman’s rank analysis of transcripts encoding proteins involved in glutamine metabolism and IC50DMOG. Black bars represent correlation coefficients when all cell lines are included in the analysis (850 different cell lines, as for Fig. 1d), while red bars represent coefficients when only the cell lines that express the highest levels of SLC16A7 (213 cell lines) are included.

References

    1. Zhang J, Pavlova NN, Thompson CB. Cancer cell metabolism: the essential role of the nonessential amino acid, glutamine. EMBO J. 2017;36:1302–1315. doi: 10.15252/embj.201696151. - DOI - PMC - PubMed
    1. Altman BJ, Stine ZE, Dang CV. From Krebs to clinic: glutamine metabolism to cancer therapy. Nat Rev Cancer. 2016;16:619–634. doi: 10.1038/nrc.2016.71. - DOI - PMC - PubMed
    1. Still ER, Yuneva MO. Hopefully devoted to Q: targeting glutamine addiction in cancer. Br J Cancer. 2017;116:1375–1381. doi: 10.1038/bjc.2017.113. - DOI - PMC - PubMed
    1. Zdzisinska B, Zurek A, Kandefer-Szerszen M. Alpha-Ketoglutarate as a Molecule with Pleiotropic Activity: Well-Known and Novel Possibilities of Therapeutic Use. Arch Immunol Ther Exp (Warsz) 2017;65:21–36. doi: 10.1007/s00005-016-0406-x. - DOI - PMC - PubMed
    1. Anastasiou D, Cantley LC. Breathless cancer cells get fat on glutamine. Cell Res. 2012;22:443–446. doi: 10.1038/cr.2012.5. - DOI - PMC - PubMed

Publication types

MeSH terms