. 2018 Oct;24(10):1536-1544.
doi: 10.1038/s41591-018-0205-5. Epub 2018 Oct 8.

Late-stage tumors induce anemia and immunosuppressive extramedullary erythroid progenitor cells

Affiliations

Late-stage tumors induce anemia and immunosuppressive extramedullary erythroid progenitor cells

Lintao Zhao et al. Nat Med. 2018 Oct.

Abstract

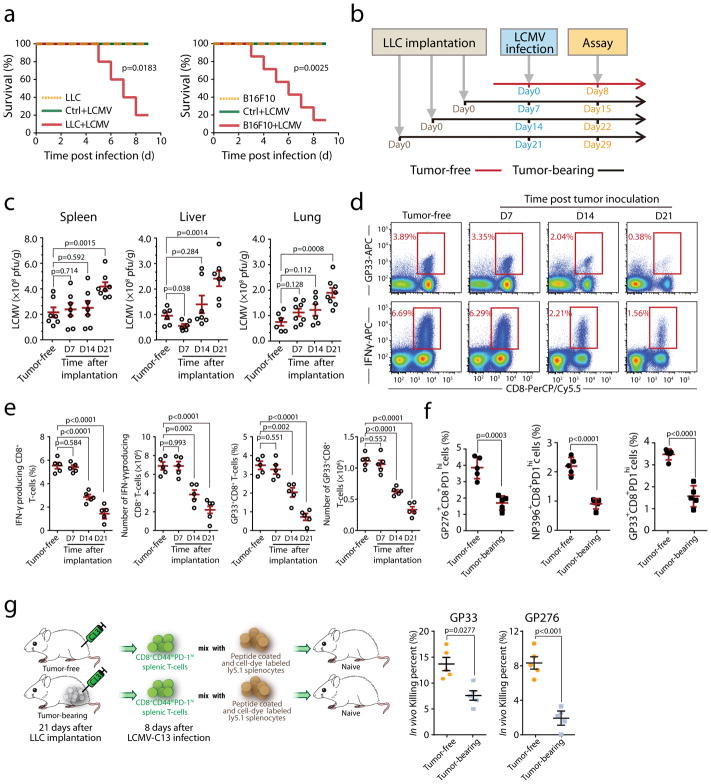
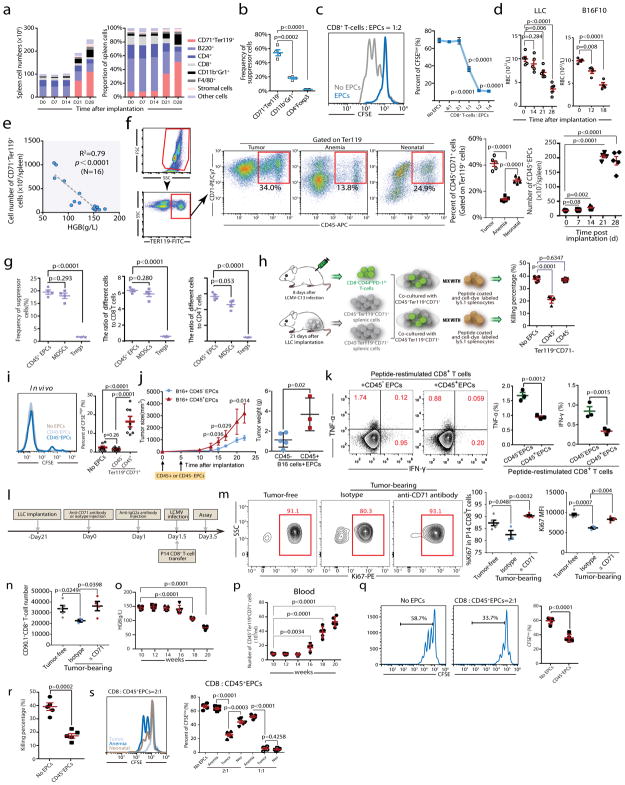
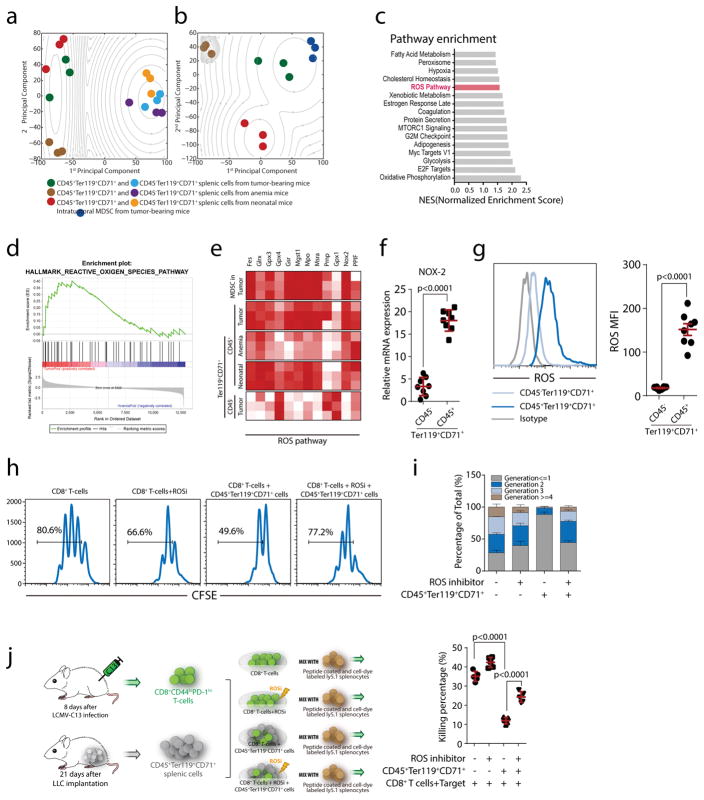
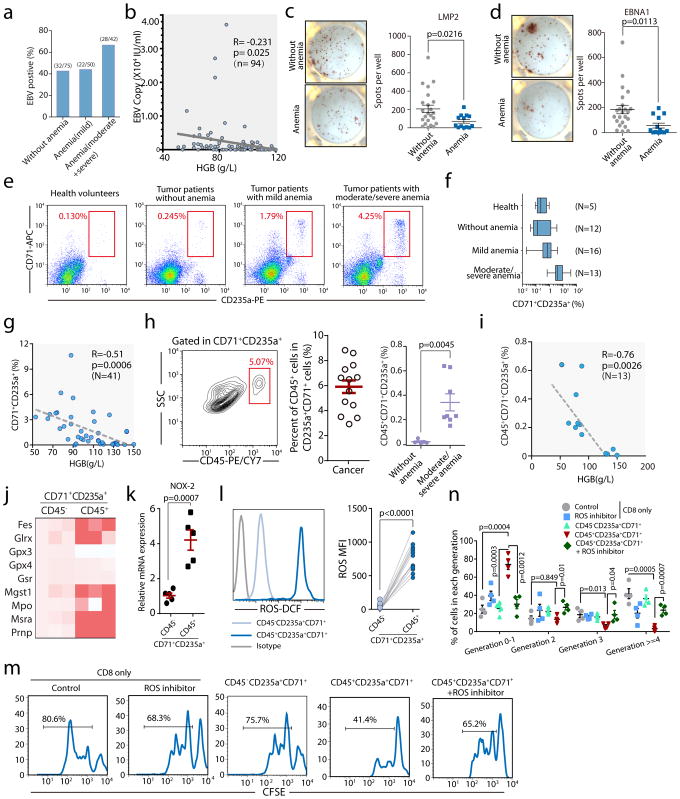
Impaired immunity in patients with late-stage cancer is not limited to antitumor responses, as demonstrated by poor vaccination protection and high susceptibility to infection1-3. This has been largely attributed to chemotherapy-induced impairment of innate immunity, such as neutropenia2, whereas systemic effects of tumors on hematopoiesis and adoptive immunity remain incompletely understood. Here we observed anemia associated with severe deficiency of CD8+ T cell responses against pathogens in treatment-naive mice bearing large tumors. Specifically, we identify CD45+ erythroid progenitor cells (CD71+TER119+; EPCs) as robust immunosuppressors. CD45+ EPCs, induced by tumor growth-associated extramedullary hematopoiesis, accumulate in the spleen to become a major population, outnumbering regulatory T cells (Tregs) and myeloid-derived suppressor cells (MDSCs). The CD45+ EPC transcriptome closely resembles that of MDSCs, and, like MDSCs, reactive oxygen species production is a major mechanism underlying CD45+ EPC-mediated immunosuppression. Similarly, an immunosuppressive CD45+ EPC population was detected in patients with cancer who have anemia. These findings identify a major population of immunosuppressive cells that likely contributes to the impaired T cell responses commonly observed in patients with advanced cancer.


Conflict of interest statement

Disclosure of potential conflict of interest

The authors declare no competing financial interests.

Figures

Fig. 1
Fig. 1. Increased susceptibility to LCMV-Cl13 infection and decreased immune responses by CD8+T cells in tumor-bearing mice
a, Survival of tumor-bearing mice (inoculated with LLC or B16F10 cells, n=10), tumor-free mice (n=10) after LCMV-Cl13 infection and uninfected tumor-bearing mice (n=10) was monitored. b–e, Mice were infected with LCMV-Cl13 at different times following LLC inoculation (0, 7, 14 and 21 days) and sacrificed on day 8 post-infection (b). Viral load in the indicated tissues including the spleen, liver and lung at 21 days after tumor implantation, (Tumor free, n=7(spleen), n=6(liver and lung); D7, n=7(spleen), n=6(liver), n=8(lung); D14, n=7(spleen and liver), n=6(lung); D21, n=8(spleen and lung), n=7(liver). (c). Antigen specific CD8+ T cells (top) and production of IFN-γ by splenic CD8+ T cells after stimulation with viral antigen (bottom) were determined by staining for intracellular IFN-γ and LCMV specific tetramers, the frequency and total number of IFN-γ producing and antigen-specific CD8+ T cells in the spleens of tumor-bearing mice (d–e, n=5). f, Mice were infected with LCMV-Cl13 at day21 following LLC inoculation and sacrificed on day 8 post-infection. Antigen specific CD8+CD44+PD-1hi cells recognizing each epitope were determined using LCMV epitope-specific tetramers (n=5). g, The ability of CD8+ T cells isolated from LCMV-Cl13-infected tumor-bearing or control mice to kill viral-peptide pulsed splenocytes in vivo was analyzed(n=5). Each point in (c) and (e) represents data from an individual mouse, and the data are representative of three independent experiments. Two-tailed Student’s t-tests were used for all comparisons, with the exception of survival curves, for which Gehan-Breslow-Wilcoxon tests were used. Two-tailed p-values were reported, Bar graphs denote mean values with SEM.
Fig. 2
Fig. 2. CD45+CD71+TER119+erythroid progenitor cells accumulate in tumor-bearing mice and exert immunosuppressive effects on CD8+T cells
a, The number (left) and frequency (right) of MDSCs (CD11b+Gr1+), erythroid progenitor cells (CD71+TER119+), stromal cells (CD45TER119), macrophages (F4/80+), CD4+T, CD8+T and B (B220+) cells in the spleens of C57BL/6 mice were quantified at different time points (0, 7, 14, 21 and 28 days) after LLC cell inoculation (n=4). b, The frequencies of MDSCs, CD71+TER119+ cells and Tregs in the spleen 28 days after LLC inoculation were determined (n=4). c, Representative flow cytometry (left) and cumulative composite data (right) showing the proliferation of CFSE-labeled CD8+ T cells after co-culture with CD71+TER119+erythroid progenitor cells isolated from the spleens of tumor-bearing mice at different CD8+ T cell: erythroid progenitor cell ratios (n=4). d, Mature red blood cell (RBC) counts were measured in tumor-bearing mice at different time points (n=4 or 5) after LLC or B16F10 inoculation. Each point represents data from an individual mouse, and the data are representative of at least three independent experiments. e, The correlation between the total number of CD71+TER119+ erythroid progenitor cells in the spleens of tumor-bearing mice and hemoglobin (HGB) concentration was analyzed by Pearson’s correlation coefficient. (n=16). f, Gating strategy: after excluding doublets or larger aggregates, DAPI-positive cells, which are likely membrane-permeable apoptotic cells, were excluded from further analysis. Next, very small events, likely nuclei or debris, were excluded. Finally, we selected TER119+ cells for further analysis. Representative flow cytometry and cumulative composite data show the frequency of CD45+CD71+ cells within the TER119+ population in the spleens of tumor-bearing (21d), anemic(4d) and neonatal mice. Right panel: cumulative composite data show the total number of CD45+CD71+TER119+ cells in the spleens of tumor-bearing mice at the indicated days after tumor inoculation (n=5). g, Cumulative composite data show the frequencies of CD45+CD71+TER119+ EPCs, MDSCs and Tregs in the spleen of mice with advanced tumors (28 days after LLC inoculation)(left). The ratio of immunosuppressive cells, CD45+CD71+TER119+ EPCs, MDSCs or Treg cells, against CD8+(middle) or CD4+(right) T cells in the spleen of mice with advanced tumors (28 days after LLC inoculation) (n=4). h, CD45+CD71+TER119+ or CD45CD71+TER119+erythroid progenitor cells isolated from the spleens of tumor-bearing mice were co-cultured with sorted CD8+T cells and the T cell ex vivo killing efficiency was determined after 6 h (n=5). i,2×105 CFSE-labeled P14 CD8+ T cells were mixed with 2×10⁶ sorted CD45+CD71+TER119+ or CD45CD71+TER119+ cells. The mixed cells were then adoptively transferred into naïve B6 mice immediately (n=8), which were subsequently infected with LCMV-Armstrong. These mice were sacrificed on day 3 post infection and CFSEhigh CD8+ T cells were analyzed by flow cytometry. j–k, A total of 2×10⁵ B16F10-Ova melanoma cells were subcutaneously injected into C57BL/6 mice on day 0. Next, 2×10⁶ CD45+CD71+TER119+ or CD45CD71+TER119+ cells were intravenously injected on days 0 and 5. j, Tumor growth was monitored every 2 or 3 days (left). Mice were sacrificed on day 22and tumors were collected and weighed (right). Each point represents data from an individual mouse (CD45+CD71+TER119+ group n=3, CD45CD71+TER119+ group n=5), and data were analyzed by two-tailed unpaired t-test. k, Tumor infiltrating leukocytes were enriched and loaded with the OVA257–264 (SIINFEKL) peptide in vitro for 24-hour restimulation. Frequencies of IFN-γ and TNF-α producing T cells were analyzed by intracellular cytokine staining. Each point represents data from an individual mouse (n=3), and data were analyzed by two-tailed unpaired t-test. l–n, A total of 1×10⁶ Lewis lung cancer cells were subcutaneously injected into C57BL/6 mice (PBS was used as control). Anti-CD71 antibody (1 mg/mouse) was intravenously injected at day 21 after tumor cell inoculation (IgG was used as control, 1 mg/mouse). To attenuate the anti-CD71 antibody, anti-IgG2a antibody (3 mg/mouse) was intravenously injected 24 h later. Finally, we adoptively transferred P14 CD8+ T cells (CD90.1, 2×10⁶ cells/mouse) into mice and infected with LCMV cl13 simultaneously 36 h after administration of anti-CD71 antibody. All mice were sacrificed at day 2 after LCMV infection (l). Representative flow cytometry (m, left) and cumulative composite data (m, middle) show the frequency of Ki67+ cells among P14 CD8+ T cells. Cumulative composite data show the Ki67 MFI in P14 CD8+ T cell (m, right). Cumulative composite data show the total number of CD90.1+CD8+ P14 cells in the spleen (n). o–q, The hemoglobin (HGB)concentration (o) and number of CD45+CD71+TER119+ cells (p) in the peripheral blood of MMTV-PyMT female mice which developed palpable mammary tumors at 12 weeks old were determined at the indicated weeks. The proliferative capacity of CFSE-labeled CD8+ T cells in response to anti-CD3 and anti-CD28 was analyzed after co-culture with CD45+CD71+TER119+ EPCs isolated from the spleens of 20 week old MMTV-PyMT female mice at a CD8+ T cell/EPC ratio of 1:2 (q); CD45+CD71+TER119+ EPCs isolated from spleens of 20 week old MMTV-PyMT females mice were co-cultured with sorted CD8+ T cells and the ex vivo T cell killing efficiency was determined after 6 h (r). s, The proliferative capacity of CFSE-labeled CD8+ T cells in response to anti-CD3 and anti-CD28 was analyzed after co-culture with CD45+CD71+TER119+ erythroid progenitor cells isolated from the spleens of tumor-bearing, anemic or neonatal mice at the indicated CD8+ T cell:EPC ratios (n=5). Each point in (b–e) and (h–m) represents data from an individual mouse. Data are representative of three independent experiments and were analyzed by two-tailed unpaired t-test. Two-tailed p-values were reported. Bar graphs denote mean values with SEM.
Fig. 3
Fig. 3. ROS play a dominant role in the immunosuppressive ability of CD45+CD71+TER119+ cells from tumor-bearing mice
a–b, Principal component analysis of RNA sequencing data reveals similarity among the CD45+CD71+TER119+ and CD45CD71+TER119+ cells (a) and similarity among MDSCs and CD45+CD71+TER119+cells (b) from tumor-bearing(n=3), anemic (n=3) and neonatal (n=3) mice. An expectation maximization algorithm was used to perform clustering under Gaussian mixture models. The contour shows the estimated probability density for each group. Log-likelihood is shown. c, Pathway enrichment analysis was performed using Gene Set Enrichment Analysis (GSEA). Significantly enriched (nominal p value <0.05) items in CD45+CD71+TER119+ cells derived from tumor-bearing mice compared with those from anemic mice are shown with enrichment scores (n=3). d, Enrichment plot of the HALLMARK ROS pathway for the comparison between CD45+CD71+TER119+ cells from tumor-bearing mice and anemic mice. e, Heat map illustrating the relative expression of ROS pathway genes in MDSCs and CD45CD71+TER119+ cells from spleens of tumor-bearing mice and CD45+CD71+TER119+ cells from the spleens of tumor-bearing, anemic and neonatal mice. f, Cybb (Nox2) mRNA expression in CD45+CD71+TER119+ and CD45CD71+TER119+ cells from tumor-bearing mice (n=8) was quantified by RT-qPCR. g, ROS production in CD45+CD71+TER119+ and CD45CD71+TER119+ cells from tumor-bearing mice was quantified by flow cytometry(n=8). h–i, CD45+CD71+TER119+erythroid progenitor cells isolated from the spleens of tumor-bearing mice(n=8) were co-cultured with CFSE-labeled CD8+ T cells at a ratio of 1:1 (CD8+ T cells:EPCs). CD8+T cell proliferation was evaluated in the presence or absence of apocynin (ROSi), an NADPH oxidase inhibitor that blocks ROS production. j, CD45+CD71+TER119+erythroid progenitor cells isolated from the spleens of tumor-bearing mice(n=5) were co-cultured with sorted CD8+ T cells in the presence or absence of apocynin, and, after 6 h, the ex vivo killing efficiency of sorted CD8+ T cells was determined. Each point in (f) represents data from an individual mouse. Data are representative of three independent experiments and were analyzed by two-tailed unpaired t-test. Two-tailed p-values were reported. Bar graphs denote the mean value with SEM.
Fig. 4
Fig. 4. Erythroid progenitor cells accumulate in cancer patients with anemia, and their inhibitory effects on CD8+T cells can be blocked by a ROS inhibitor
a–b, EBV DNA loads in the peripheral blood were detected. The percentage of EBV positive patients (EBV DNA>400 copies/mL) without anemia (male: HGB>120 g/L, female: HGB>110 g/L) or with varying degrees of anemia (mild HGB>90 g/L, moderate HGB 60–90 g/L, severe HGB 30–60 g/L) is shown (a). The correlation between hemoglobin (HGB) and EBV DNA loads in the peripheral blood of cancer patients was analyzed by Pearson’s correlation coefficient (b, n=94). c–d, Enzyme-linked immunospot assay (ELISPOT) results show the number of LMP2(c) or EBNA1(d) specific CD8+ T cells in 1×10⁶ PBMCs in cancer patients without (HB>110 g/L, n=23) or with anemia (<110g/L, n=13). e–f, Representative flow cytometry plots (e) and cumulative composite data (f) showing the percentages of CD71+CD235a+erythroid progenitor cells in the peripheral blood of healthy donors and cancer patients without (HB>110 g/L) or with varying degrees of anemia. g, The correlation between hemoglobin (HGB) and the frequency of CD71+CD235a+erythroid progenitor cells in the peripheral blood of cancer patients was analyzed by Pearson’s correlation coefficient (n=41). h, Representative flow cytometry plots and cumulative composite data showing the frequency of CD45+ cells in CD71+CD235a+ cells in the peripheral blood of cancer patients with or without anemia (n=13). Far right panel: frequency of CD45+CD71+TER119+ cells among PBMCs isolated from tumor patients without anemia (n=5) or with moderate and severe anemia (n=8). i, The correlation between hemoglobin (HGB) and the frequency of CD45+CD71+CD235a+erythroid progenitor cells in the peripheral blood of cancer patients was analyzed by Pearson’s correlation coefficient (n=13). j, mRNA expression levels of genes in the ROS pathway in CD45+CD71+CD235a+ and CD45CD71+CD235a+ cells from the peripheral blood of cancer patients were quantified by RT-qPCR. k, Cybb (Nox2) mRNA expression in CD45+CD71+CD235a+ and CD45CD71+CD235a+ cells from cancer patients was quantified by RT-qPCR (n=5). l, ROS production in CD45+CD71+CD235a+ and CD45CD71+CD235a+ cells from cancer patients was analyzed by flow cytometry (left), and the mean fluorescent intensity (MFI)of the fluorescent dye for detecting ROS was quantified (right) (n=11). m–n, CD8+ T cell proliferation after stimulation with anti-CD3 and anti-CD28 was measured using CFSE-labeled CD8+ T cells cultured alone or co-cultured with CD45+CD71+CD235a+or CD45CD71+CD235a+cells at a 1:1 ratio, with or without the ROS inhibitor apocynin. Representative FACS plat was shown in (m). Two-tailed unpaired t-test of four independent experiments was performed by measuring the distribution of CD8+ T cells in each division(n). Each point in (b–d) and (g–i) represents data from an individual patient. Data are representative of three independent experiments and were analyzed by a two-tailed unpaired t-test. Two-tailed p-values were reported. Error bars denote the SEM.

References

    1. Baden LR, et al. Prevention and Treatment of Cancer-Related Infections. Journal of the National Comprehensive Cancer Network. 2012;10:1412–1445. - PubMed
    1. Vento S, Cainelli F, Ternesgen Z. Lung infections after cancer chemotherapy. Lancet Oncology. 2008;9:982–992. - PubMed
    1. van der Burg SH, Arens R, Ossendorp F, van Hall T, Melief AJM. Vaccines for established cancer: overcoming the challenges posed by immune evasion. Nature Reviews Cancer. 2016;16:219–233. - PubMed
    1. Bodey GP. Infection in cancer patients. A continuing association. The American journal of medicine. 1986;81:11–26. - PubMed
    1. Kosmidis CI, Chandrasekar PH. Management of gram-positive bacterial infections in patients with cancer. Leukemia & Lymphoma. 2012;53:8–18. - PubMed

Publication types

MeSH terms