. 2018 Nov;50(11):1600-1607.
doi: 10.1038/s41588-018-0231-8. Epub 2018 Oct 8.

Functional architecture of low-frequency variants highlights strength of negative selection across coding and non-coding annotations

Affiliations

Functional architecture of low-frequency variants highlights strength of negative selection across coding and non-coding annotations

Steven Gazal et al. Nat Genet. 2018 Nov.

Abstract

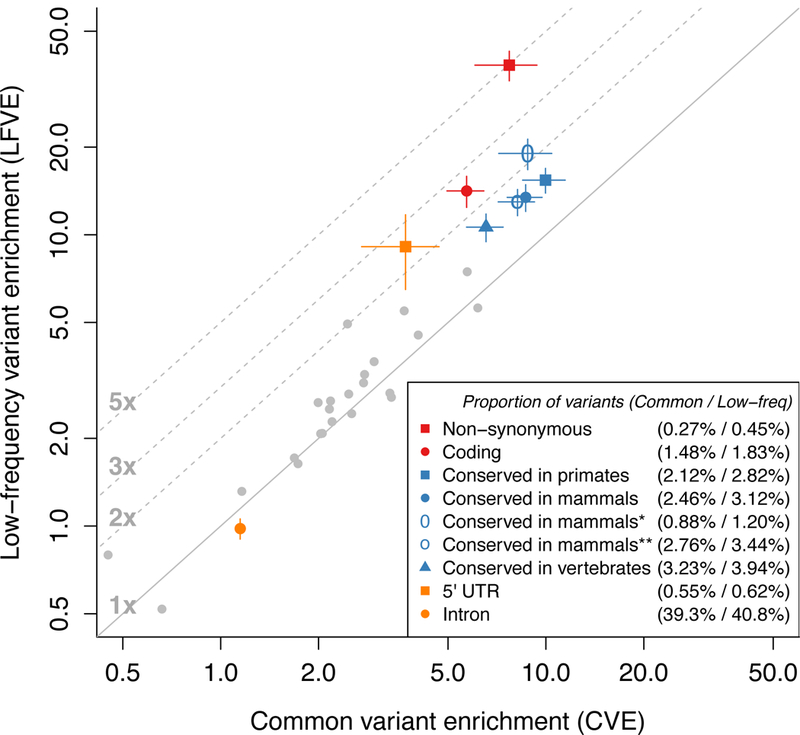
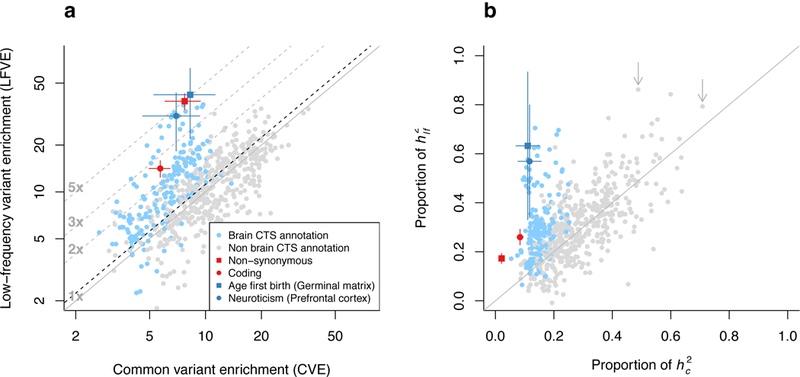
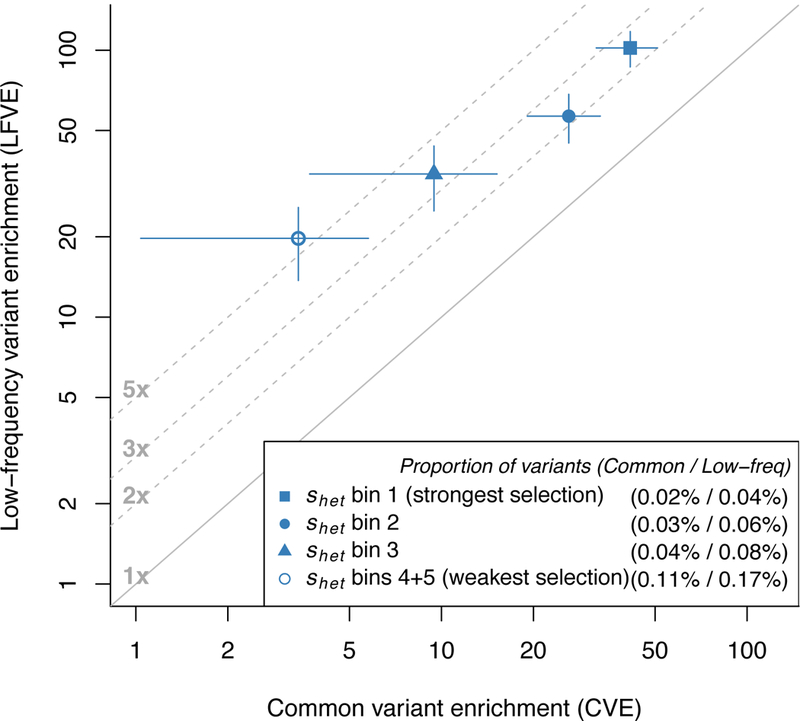
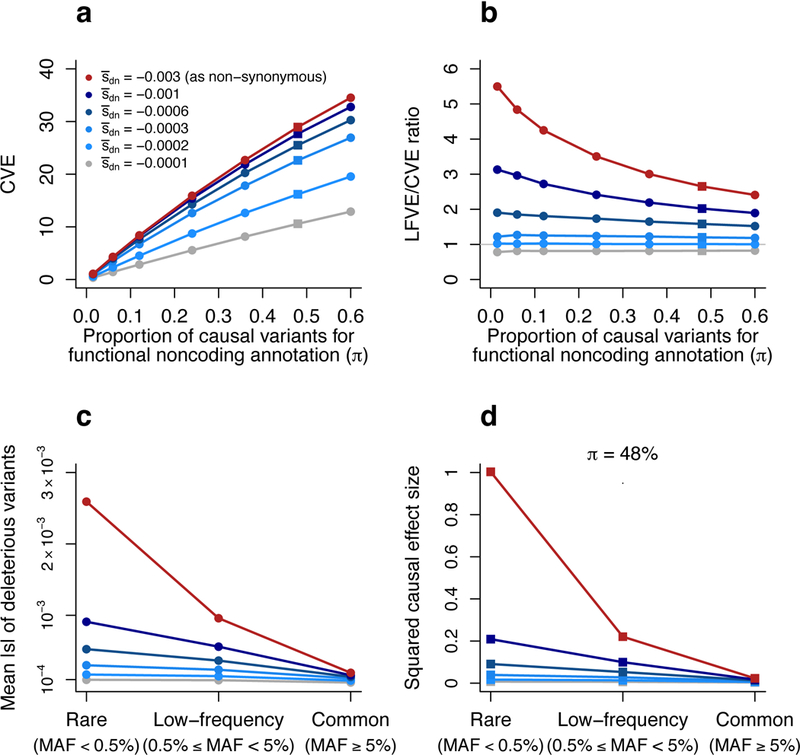
Common variant heritability has been widely reported to be concentrated in variants within cell-type-specific non-coding functional annotations, but little is known about low-frequency variant functional architectures. We partitioned the heritability of both low-frequency (0.5%≤ minor allele frequency <5%) and common (minor allele frequency ≥5%) variants in 40 UK Biobank traits across a broad set of functional annotations. We determined that non-synonymous coding variants explain 17 ± 1% of low-frequency variant heritability ([Formula: see text]) versus 2.1 ± 0.2% of common variant heritability ([Formula: see text]). Cell-type-specific non-coding annotations that were significantly enriched for [Formula: see text] of corresponding traits were similarly enriched for [Formula: see text] for most traits, but more enriched for brain-related annotations and traits. For example, H3K4me3 marks in brain dorsolateral prefrontal cortex explain 57 ± 12% of [Formula: see text] versus 12 ± 2% of [Formula: see text] for neuroticism. Forward simulations confirmed that low-frequency variant enrichment depends on the mean selection coefficient of causal variants in the annotation, and can be used to predict effect size variance of causal rare variants (minor allele frequency <0.5%).


Conflict of interest statement

Competing Financial Interests Statement

The authors declare no conflict of interest.

Figures

Figure 1:
Figure 1:. Simulations to assess low-frequency variant enrichment estimates.
We report estimates of LFVE and LFVE/CVE ratio in simulations under a coding-enriched architecture (first row) or enhancer-enriched architecture (second row). We considered four different simulation scenarios (see main text). S-LDSC was run either by restricting regression variants to accurately imputed variants (S-LDSC – INFO ≥ 0.99), or by including all variants (S-LDSC – All variants). We do not report LFVE/CVE ratio for the No Enrichment simulation (CVE=LFVE=1) due to unstable estimates; however, all analyses of real traits in this paper focus on annotations with significant CVE. Results are averaged across 1,000 simulations. Error bars represent 95% confidence intervals. Numerical results for hlf2, hc2, LFVE, CVE and LFVE/CVE ratio are reported in Supplementary Table 4.
Figure 2:
Figure 2:. Common variant heritability (hc2)and low-frequency variant heritability (hlf2)estimates for 40 UK Biobank traits.
We report hc2 and hlf2 estimated by S-LDSC with the baseline-LF model for 40 UK Biobank traits (for binary traits, estimates are on the liability scale), with 7 representative independent traits highlighted. Error bars represent 95% confidence intervals. The dashed black line represents the ratio between hlf2 and hc2 meta-analyzed across 27 independent traits (1/6.3). Grey lines represent expected ratios for different values of α (see main text). Error bars represent 95% confidence intervals. Numerical results are reported in Supplementary Table 5.
Figure 3:
Figure 3:. Functional low-frequency and common variant architectures across 27 independent UK Biobank traits.
We plot LFVE vs. CVE (log scale) for the 33 main functional annotations of the baseline-LF model (meta-analyzed across the 27 independent traits), highlighting annotations for which LFVE is significantly different from CVE. Numbers in the legend represent the proportion of common / low-frequency variants inside the annotation, respectively. The first three conserved annotations are based on phastCons elements, Conserved in mammals* is based on GERP RS scores (≥4), and Conserved in mammals** is based on Lindblad-Toh et al.. The promoter flanking annotation has (non-significantly) negative LFVE and is not displayed for visualization purposes. The solid line represents LFVE=CVE; dashed lines represent LFVE=constant multiples of CVE. Error bars represent 95% confidence intervals. Numerical results are reported in Supplementary Table 6.
Figure 4:
Figure 4:. Low-frequency and common variant architectures of cell-type-specific (CTS) annotations.
For 637 trait-annotation pairs with conditionally statistically significant common variant enrichment, we report (a) LFVE vs. CVE (log scale) and (b) proportion of hc2 vs. proportion of hlf2 explained. The dashed black line in (a) represents the regression slope for 25 critical CTS annotations for independent traits (see main text). Brain-specific annotations are denoted in blue. Two trait-H3K4me3 annotation pairs with LFVE significantly larger than CVE are denoted in dark blue (see main text); error bars represent 95% confidence intervals. The two arrows in (b) denote All autoimmune diseases (H3K4me1 in Regulatory T-cells; left arrow) and Monocyte count (H3K4me1 in Primary monocytes; right arrow) (see main text). Results for coding and non-synonymous annotations (meta-analysis across 27 independent traits) are denoted in red; error bars represent 95% confidence intervals. Numerical results are reported in Supplementary Table 10.
Figure 5:
Figure 5:. Low-frequency and common variant enrichments for non-synonymous variants vary with the strength of selection on the underlying genes.
We report LFVE vs. CVE (log scale) for non-synonymous variants in 5 bins of shet (see main text), meta-analyzed across 27 independent UK Biobank traits; bins 4+5 are merged for visualization purposes. Numbers in the legend represent the proportion of common / low-frequency variants inside the annotation, respectively. The solid line represents LFVE=CVE; dashed lines represent LFVE=constant multiples of CVE. Error bars represent 95% confidence intervals. Numerical results for each bin are reported in Supplementary Table 11.
Figure 6:
Figure 6:. Forward simulations enable inferences about negative selection and rare variant architectures.
Results are based on forward simulations involving an annotation mimicking functional noncoding variants, as well as other annotations (see text). (a,b) We report the CVE (a) and LFVE/CVE ratio (b) of the functional noncoding annotation as a function of the mean selection coefficient for de novo deleterious variants (s¯dn) and the probability of a de novo variant to be causal (π) for this annotation. s¯dn and π values for non-synonymous and ordinary noncoding annotations are described in the main text. (c) We report the mean absolute selection coefficient of deleterious variants in the functional noncoding annotation as a function of s¯dn and MAF (rare, low-frequency, common). (d) We report the mean squared per-allele effect size of causal variants in the functional noncoding annotation (normalized by the mean squared per-allele effect size of rare causal non-synonymous variants) as a function of s¯dn and MAF (rare, low-frequency and common). Red lines denote the value s¯dn=−0.003 used to simulate non-synonymous variants, grey lines denote the value s¯dn=−0.0001 used to simulate ordinary noncoding variants (see main text). The value π=48% used in (d) (see Methods) is denoted via squares in (a) and (b). Numerical results are reported in Supplementary Table 12.

References

    1. Maurano MT et al. Systematic Localization of Common Disease-Associated Variation in Regulatory DNA. Science 337, 1190–1195 (2012). - PMC - PubMed
    1. Trynka G et al. Chromatin marks identify critical cell types for fine mapping complex trait variants. Nat. Genet. 45, 124–130 (2013). - PMC - PubMed
    1. Gusev A et al. Partitioning heritability of regulatory and cell-type-specific variants across 11 common diseases. Am. J. Hum. Genet. 95, 535–552 (2014). - PMC - PubMed
    1. Pickrell JK Joint analysis of functional genomic data and genome-wide association studies of 18 human traits. Am. J. Hum. Genet. 94, 559–573 (2014). - PMC - PubMed
    1. Finucane HK et al. Partitioning heritability by functional annotation using genome-wide association summary statistics. Nat. Genet. 47, 1228–1235 (2015). - PMC - PubMed

Publication types