. 2018 Nov;50(11):1584-1592.
doi: 10.1038/s41588-018-0238-1. Epub 2018 Oct 8.

Integrative transcriptome analyses of the aging brain implicate altered splicing in Alzheimer's disease susceptibility

Affiliations

Integrative transcriptome analyses of the aging brain implicate altered splicing in Alzheimer's disease susceptibility

Towfique Raj et al. Nat Genet. 2018 Nov.

Abstract

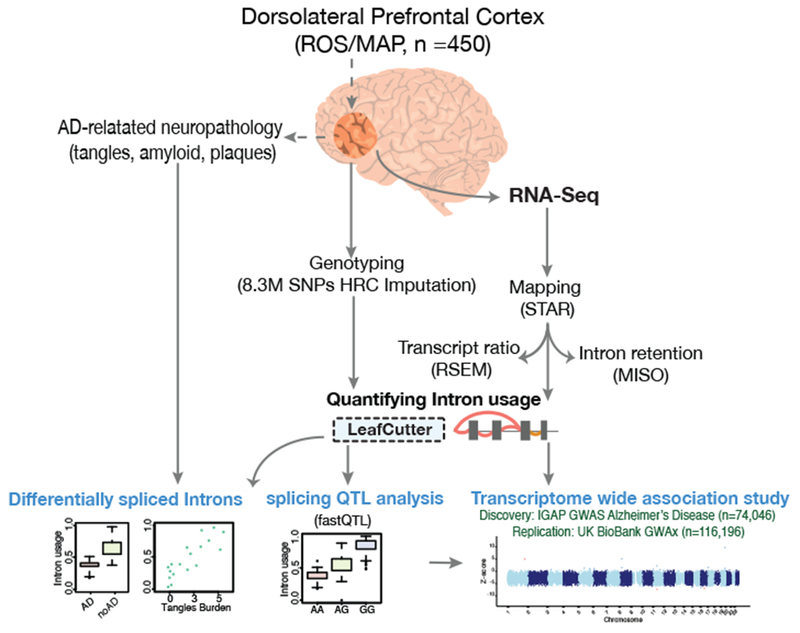
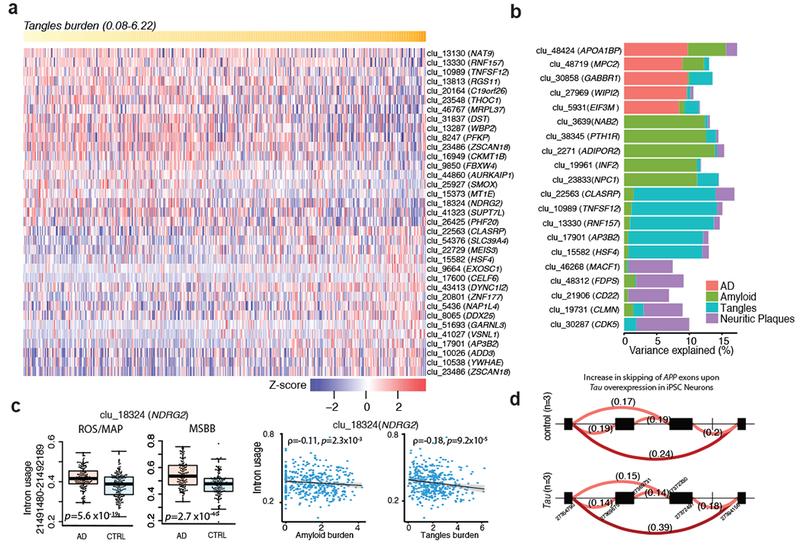
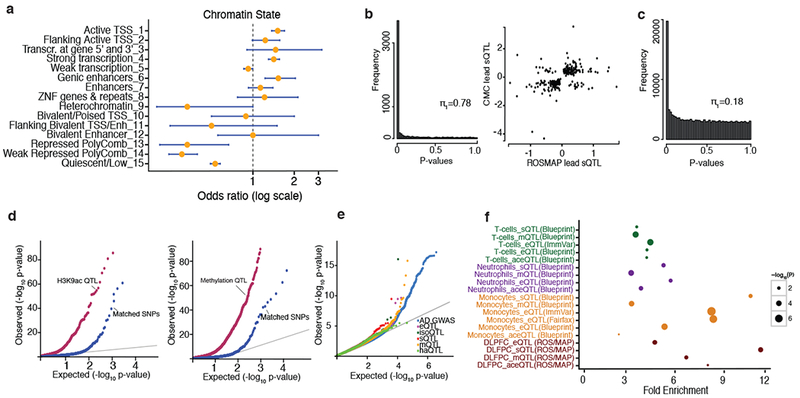
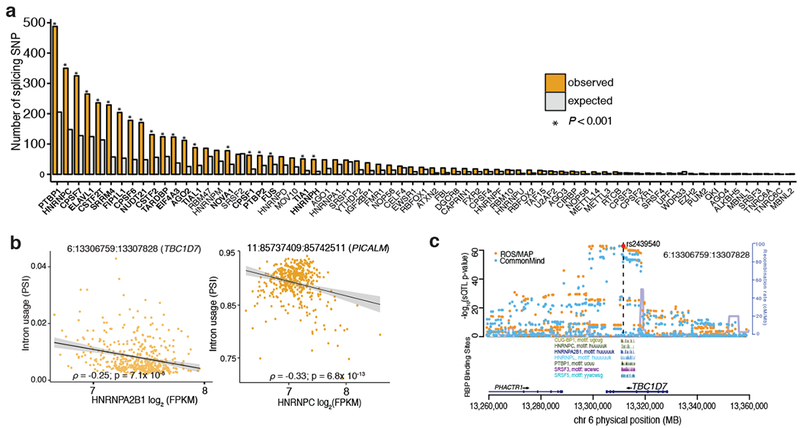
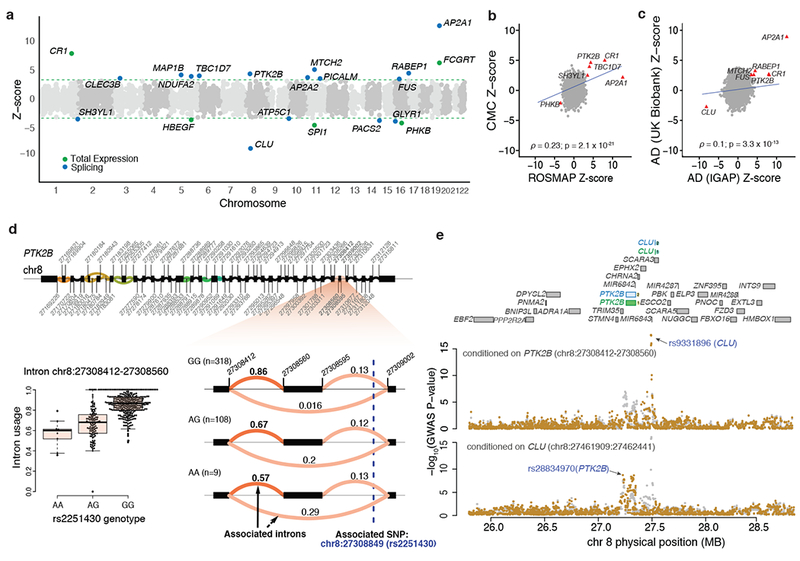
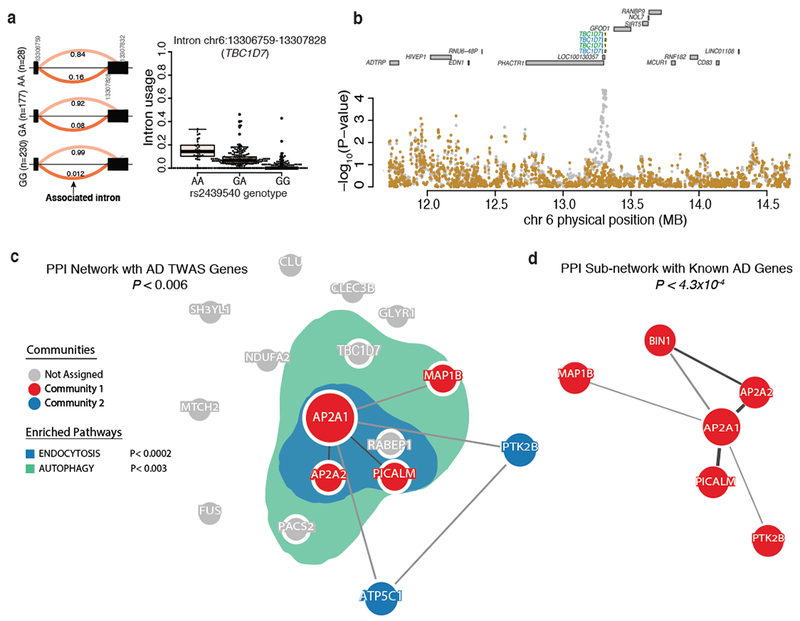
Here we use deep sequencing to identify sources of variation in mRNA splicing in the dorsolateral prefrontal cortex (DLPFC) of 450 subjects from two aging cohorts. Hundreds of aberrant pre-mRNA splicing events are reproducibly associated with Alzheimer's disease. We also generate a catalog of splicing quantitative trait loci (sQTL) effects: splicing of 3,006 genes is influenced by genetic variation. We report that altered splicing is the mechanism for the effects of the PICALM, CLU and PTK2B susceptibility alleles. Furthermore, we performed a transcriptome-wide association study and identified 21 genes with significant associations with Alzheimer's disease, many of which are found in known loci, whereas 8 are in novel loci. These results highlight the convergence of old and new genes associated with Alzheimer's disease in autophagy-lysosomal-related pathways. Overall, this study of the transcriptome of the aging brain provides evidence that dysregulation of mRNA splicing is a feature of Alzheimer's disease and is, in some cases, genetically driven.


Conflict of interest statement

Competing financial interests

The authors declare no competing financial interests.

Figures

Figure 1:
Figure 1:. Overview of the study.
RNA was sequenced from the gray matter of the dorsal lateral prefrontal cortex (DLPFC) of 542 samples (450 remained after QC and matching for genotype data) from the ROS/MAP cohort. RNA-Seq data were processed, aligned and quantified by our parallelized pipeline. The intronic usage ratios for each cluster were then computed using LeafCutter, standardized (across individuals) and quantile normalized. The intronic usage ratios were used for differential splicing analysis, for calling splicing QTLs, and for transcriptome-wide association studies (TWAS). TWAS was performed on summary statistics from IGAP Alzheimer’s disease GWAS of 74,046 individuals.
Figure 2:
Figure 2:. Differential splicing analysis in relation to Alzheimer’s disease diagnosis and neuropathology.
(a) Heat map of top 35 differently excised intron association with burden of tangles in ROSMAP. Each column is one subject, who are ordered by their tangles burden (yellow row at the top of the panel). The association’s Z-score strength and direction are denoted using the key at the bottom of the panel. (b) Variance explained (%) of top 5 differently excised introns association for four different traits. (c) The left two panels present the mean and distribution of intron usage for differently excised introns in NDRG2 in relation to a clinical diagnosis of Alzheimer’s disease in ROSMAP and in MSBB. The right two panels display the association of amyloid or tangle burden to intron usage in NDRG2. (d) Differentially excised intron in APP upon Tau overexpression in iPSC Neurons.
Figure 3:
Figure 3:. Enrichment of splicing QTLs in epigenomic marks and in Alzheimer’s disease GWAS.
(a) Splicing QTLs are enriched in regions (or chromatin states) associated with active transcription and genic enhancers, and they are depleted in polycomb regions that are transcriptionally repressed in the DLPFC. (b) Left: P-value distribution of ROSMAP sQTLs that are significant in CMC (FDR < 0.05). The majority (78%) of sQTLs in ROSMAP are also discovered in CMC. Right: The direction of effect is consistent for the majority (93%) of the significant (FDR < 0.05) lead sQTLs in CMC and in ROSMAP. (c) P-value distribution of ROSMAP eQTLs that are significant sQTLs (FDR < 0.05). (d) SNPs that drive QTLs in H3K9ac and DNA methylation data in the same ROSMAP brains are more likely to be sQTLs than matched SNPs within H3K9ac domains (left) and near DNA methylated CG (right). (e) QQ-plot for Alzheimer’s disease GWAS suggests that sQTLs are enriched among Alzheimer’s disease GWAS (IGAP study) compared to other types of QTLs. (f) Fold-enrichment of Alzheimer’s disease GWAS SNPs (GWAS P < 10−5) among QTL SNPs driving variation in gene expression, splicing, histone acetylation, and DNA methylation in primary monocytes,,, T-cells,, or DLFPC.
Figure 4:
Figure 4:. Enrichment of RNA-binding protein (RBP) binding sites among sQTLs.
(a) RBP enrichment (expected vs. observed) among the lead sQTLs. Significant RBSs are in bold and shown with an “*”.(b) Association of hnRNPA2B1 (left) and hnRNPC (right) gene expression levels with differential intron usage in TBC1D7 (left) and in PICALM (right). (c) Regional plot of sQTL results for SNPs in the vicinity of TBC1D7 (6:13306759:13307828). SNPs driving splicing QTLs for TBC1D7 overlap CLIP binding sites (from CLIPdb) for several splicing factors. The top SNP (rs2439540, red) overlaps motifs for a number of RBPs. Splicing QTL results are highly consistent between ROSMAP (orange) and CommonMind (blue) data.
Figure 5:
Figure 5:. Transcriptome-wide association study of Alzheimer’s Disease.
(a) Transcriptome-wide results using the IGAP GWAS summary statistics; each dot is one gene. The dotted green line denotes the threshold of significance (FDR 0.05). Genes for which there is evidence of significant differential intron usage are highlighted in blue. In green, we highlight those genes where the TWAS using total gene expression results are significant. (b) Replication of ROSMAP TWAS in CMC DLFPC data. The red triangles denote genes where the replication analysis is significant. (c) Replication of IGAP Alzheimer’s disease TWAS using the UK BioBank GWAS based on an independent set of subjects. (d) PTK2B gene structure (top): clusters of differential splicing events are noted with the colored curves. The panel then zooms to highlight differential intronic usage for chr8:27308412–27308560 stratified by rs2251430 genotypes (right). On the left, we show the same data use a box plot. (e) Conditional analysis of IGAP GWAS results for two splicing effects for PTK2B and CLU in Alzheimer’s disease GWAS data. As noted in the top aspect of the panel, these two Alzheimer’s disease genes are located close to one another. The intronic excision events for PTK2B and CLU are present in both ROSMAP (blue) and in CMC (green) dataset. When the Alzheimer’s disease GWAS is conditioned on the PTK2B (chr8:27308412–27308560) splicing effect, the CLU effect remained significant, demonstrating its independence from the PTK2B association. The reciprocal analysis conditioning on the CLU (chr8:27461909:27462441) effect, the PTK2B association remained significant.
Figure 6:
Figure 6:. TWAS prioritizes Alzheimer’s disease genes in endocytosis and autophagy-related pathway.
(a) Differential intronic usage for chr6: 13306759:13307828 (TBC1D7) stratified by rs2439540 genotypes (left). Box plot for the same data (right). (b) Regional plot showing the IGAP P-values in TBC1D7 locus. Two intronic excision events at TBC1D7 are present in both ROSMAP (blue) and in CMC (green) dataset. The Alzheimer’s disease GWAS effect is mostly explained by intronic usage of chr6:13306759:13307828. The AD GWAS at TBC1D7 is suggestive in the original IGAP study (p<10−5). (c) The product of three of the novel Alzheimer’s disease genes (AP2A2, AP2A1, and MAP1B) are members of the same PPI network (P < 0.006). The genes in this network and others not in the network (i.e., TBC1D7, PACS2, and RABEP1) are significantly enriched in genes annotated as being involved in endocytosis (blue; P < 0.0002) and autophagy-related pathways (green; P < 0.003). (d) The novel Alzheimer’s disease genes (AP2A2, AP2A1, and MAP1B) form a significant PPI sub-network (P < 4.3 ×10⁻⁴) with known Alzheimer’s disease genes (i.e., PICALM, BIN1, and PTK2B).

Comment in

References

    1. Wang ET et al. Alternative isoform regulation in human tissue transcriptomes. Nature 456, 470–6 (2008). - PMC - PubMed
    1. Kornblihtt AR et al. Alternative splicing: a pivotal step between eukaryotic transcription and translation. Nat Rev Mol Cell Biol 14, 153–65 (2013). - PubMed
    1. Barbosa-Morais NL et al. The evolutionary landscape of alternative splicing in vertebrate species. Science 338, 1587–93 (2012). - PubMed
    1. Wang GS & Cooper TA Splicing in disease: disruption of the splicing code and the decoding machinery. Nat Rev Genet 8, 749–61 (2007). - PubMed
    1. Dredge BK, Polydorides AD & Darnell RB The splice of life: alternative splicing and neurological disease. Nat Rev Neurosci 2, 43–50 (2001). - PubMed

Publication types

MeSH terms