. 2018 Sep 21:9:1385.
doi: 10.3389/fpls.2018.01385. eCollection 2018.

Discovering Causal Relationships in Grapevine Expression Data to Expand Gene Networks. A Case Study: Four Networks Related to Climate Change

Affiliations

Discovering Causal Relationships in Grapevine Expression Data to Expand Gene Networks. A Case Study: Four Networks Related to Climate Change

Giulia Malacarne et al. Front Plant Sci. .

Abstract

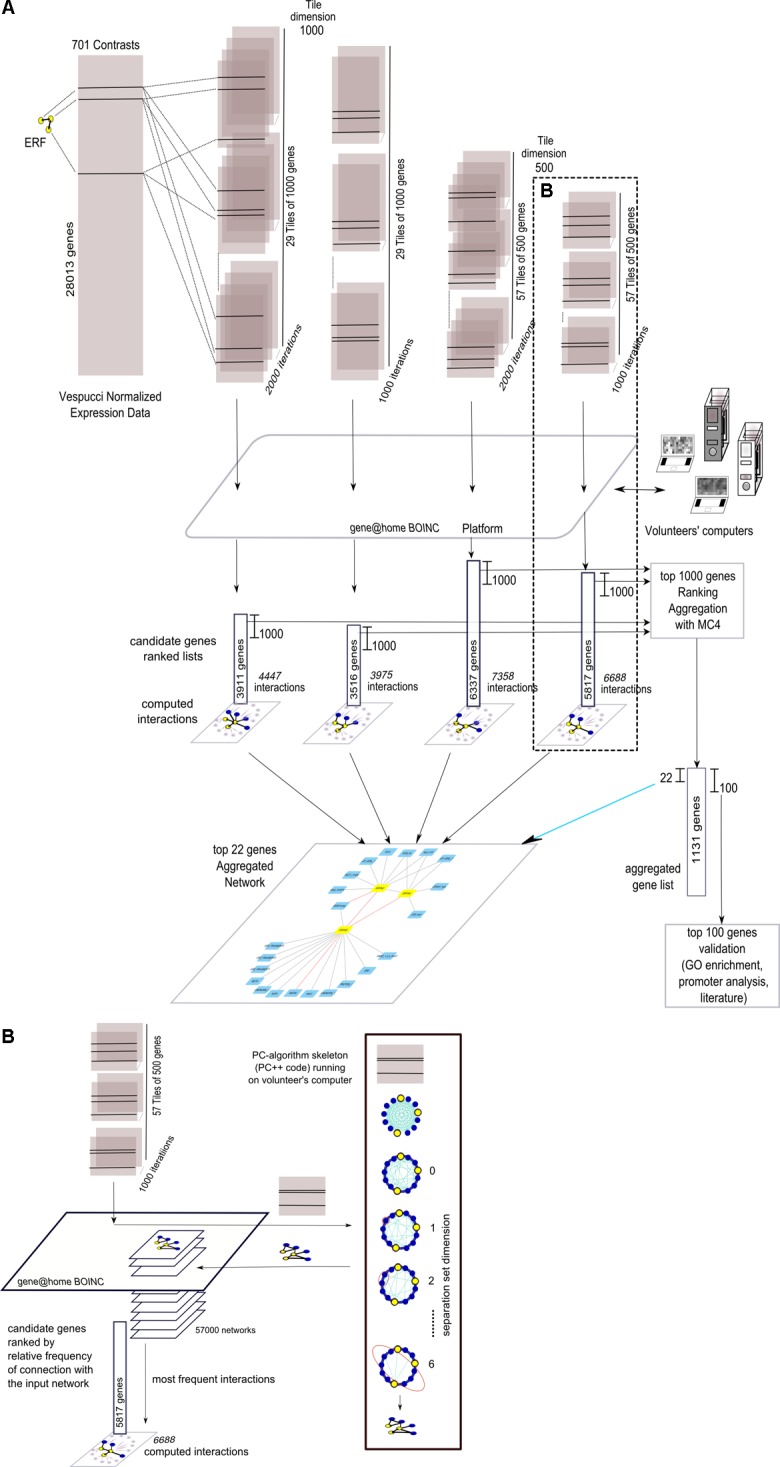
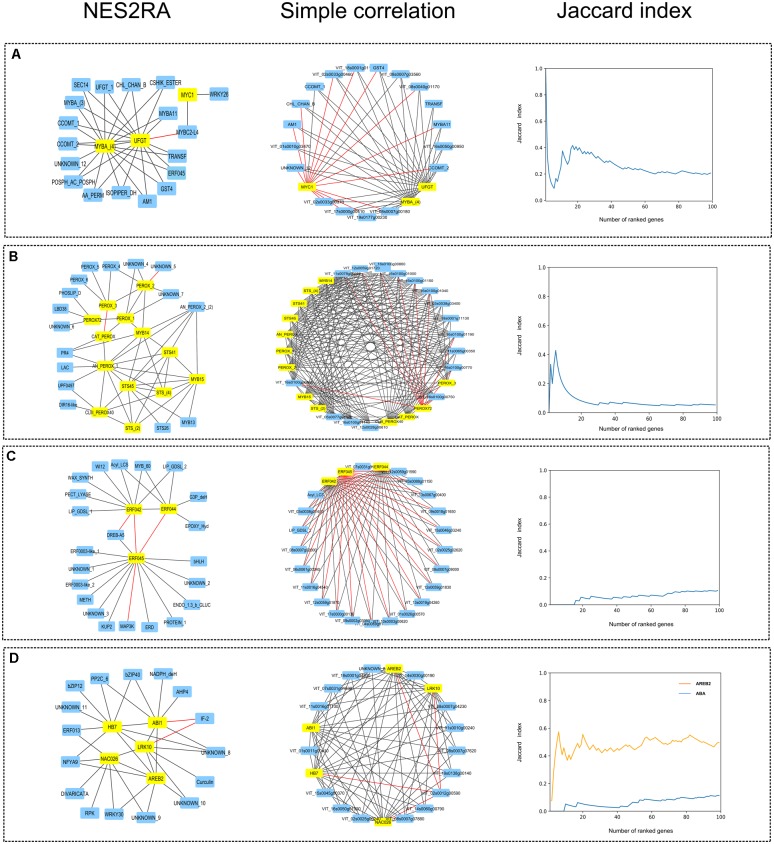
In recent years the scientific community has been heavily engaged in studying the grapevine response to climate change. Final goal is the identification of key genetic traits to be used in grapevine breeding and the setting of agronomic practices to improve climatic resilience. The increasing availability of transcriptomic studies, describing gene expression in many tissues and developmental, or treatment conditions, have allowed the implementation of gene expression compendia, which enclose a huge amount of information. The mining of transcriptomic data represents an effective approach to expand a known local gene network (LGN) by finding new related genes. We recently published a pipeline based on the iterative application of the PC-algorithm, named NES2RA, to expand gene networks in Escherichia coli and Arabidopsis thaliana. Here, we propose the application of this method to the grapevine transcriptomic compendium Vespucci, in order to expand four LGNs related to the grapevine response to climate change. Two networks are related to the secondary metabolic pathways for anthocyanin and stilbenoid synthesis, involved in the response to solar radiation, whereas the other two are signaling networks, related to the hormones abscisic acid and ethylene, possibly involved in the regulation of cell water balance and cuticle transpiration. The expansion networks produced by NES2RA algorithm have been evaluated by comparison with experimental data and biological knowledge on the identified genes showing fairly good consistency of the results. In addition, the algorithm was effective in retaining only the most significant interactions among the genes providing a useful framework for experimental validation. The application of the NES2RA to Vitis vinifera expression data by means of the BOINC-based implementation is available upon request (valter.cavecchia@cnr.it).

Keywords: ERF; NES2RA; Vitis vinifera; abscisic acid ABA; climate change; flavonoids; gene network; stilbenoids.


Figures

FIGURE 1
FIGURE 1
Visualization of the difference between the Pearson correlation [ρ(A,B)] of two genes A and B and their partial correlation given the gene C [ρ(A,B| C)] as computed by the PC-algorithm. The top plot reports the normalized raw signals of A and B, their windowed Pearson correlation (window-size of 31 experiments for visualization sake), and the value of their Pearson correlation coefficient in the legend. In the middle plot the signal of C is introduced as well as the windowed correlations between A,C and B,C and the values of correlation. The bottom plot shows the simple correlation between A,B and the partial correlation of A,B given C. In this case the PC-algorithm, that systematically search for variables for separating pair of variables, would have considered the correlation between A and B as completely explained in terms of C (a separation set of dimension one) and removed the interaction between them for the successive steps.
FIGURE 2
FIGURE 2
Overall view of the network expansion method. (A) Summary graphical visualization of the application (using four parameters settings) of NES2RA to the ERFs LGN using data from the Vespucci compendium. Each tile, including all the genes of the LGN, generated during the subsetting step, is analysed using the PC-algorithm that runs on the volunteers’ computers, made available through the gene@home BOINC project. The post-processing takes as input all the resulting networks and ranks the genes using their relative frequency, measured as the number of times a gene was found connected to the input LGN. In the final expansion network, the nodes are the LGN (in yellow) and the top-ranking genes of the aggregated list (in light blue), whereas the edges derive from the union of all the found interactions. (B) Details on the internal steps of the PC-algorithm that, starting from a complete graph, iteratively searches separation sets that allows the cut of an edge. For each tile, the result of the application of the PC-algorithm is a network.
FIGURE 3
FIGURE 3
Comparison between expansion networks obtained with NES2RA and simple correlation. First column: visualization of the four gene networks obtained with NES2RA. Second column: visualization of the four gene networks obtained by computing simple correlation. Input genes have a yellow background, expansion genes a blue one. Gene names are abbreviations (see Supplementary Table S4 for the complete description). Edges represent gene interactions: black and red lines link positively and negatively correlated genes, respectively. Third column: graphical representation of the Jaccard similarity index, calculated between the top-100 genes of the NES2RA and simple correlation expansion lists. (A) “Anthocyanins”, (B) “Stilbenoids,” (C) “ERFs,” and (D) “ABA” (and AREB2, in the Jaccard graph, orange line) networks.

Similar articles

Cited by

References

    1. Aharoni A., Dixit S., Jetter R., Thoenes E., van Arkel G., Pereira A. (2004). The SHINE clade of AP2 domain transcription factors activates wax biosynthesis, alters cuticle properties, and confers drought tolerance when overexpressed in Arabidopsis. Plant Cell 16 2463–2480. 10.1105/tpc.104.022897 - DOI - PMC - PubMed
    1. Albieri V., Didelez V. (2014). Comparison of statistical methods for finding network motifs. Stat. Appl. Genet. Mol. Biol. 13 403–422. 10.1515/sagmb-2013-0017 - DOI - PubMed
    1. Alexa A., Rahnenfuehrer J. (2015). Gene Set Enrichment Analysis With topGO. Available at: https://www.bioconductor.org/packages/devel/bioc/vignettes/topGO/inst/do...
    1. Amato A., Cavallini E., Zenoni S., Finezzo L., Begheldo M., Ruperti B., et al. (2017). A grapevine TTG2-like WRKY Transcription factor is involved in regulating vacuolar transport and flavonoid biosynthesis. Front. Plant Sci. 7:1979 10.3389/fpls.2016.01979 - DOI - PMC - PubMed
    1. Anderson D. P. (2004). “BOINC: a system for public-resource computing and storage,” in Proceedings of the 5th IEEE/ACM International Workshop on Grid Computing GRID ’04, (Washington, DC: IEEE Computer Society), 4–10. 10.1109/GRID.2004.14 - DOI

LinkOut - more resources