. 2018 Oct 9;13(10):e0205180.
doi: 10.1371/journal.pone.0205180. eCollection 2018.

A type 2 diabetes disease module with a high collective influence for Cdk2 and PTPLAD1 is localized in endosomes

Affiliations

A type 2 diabetes disease module with a high collective influence for Cdk2 and PTPLAD1 is localized in endosomes

Martial Boutchueng-Djidjou et al. PLoS One. .

Abstract

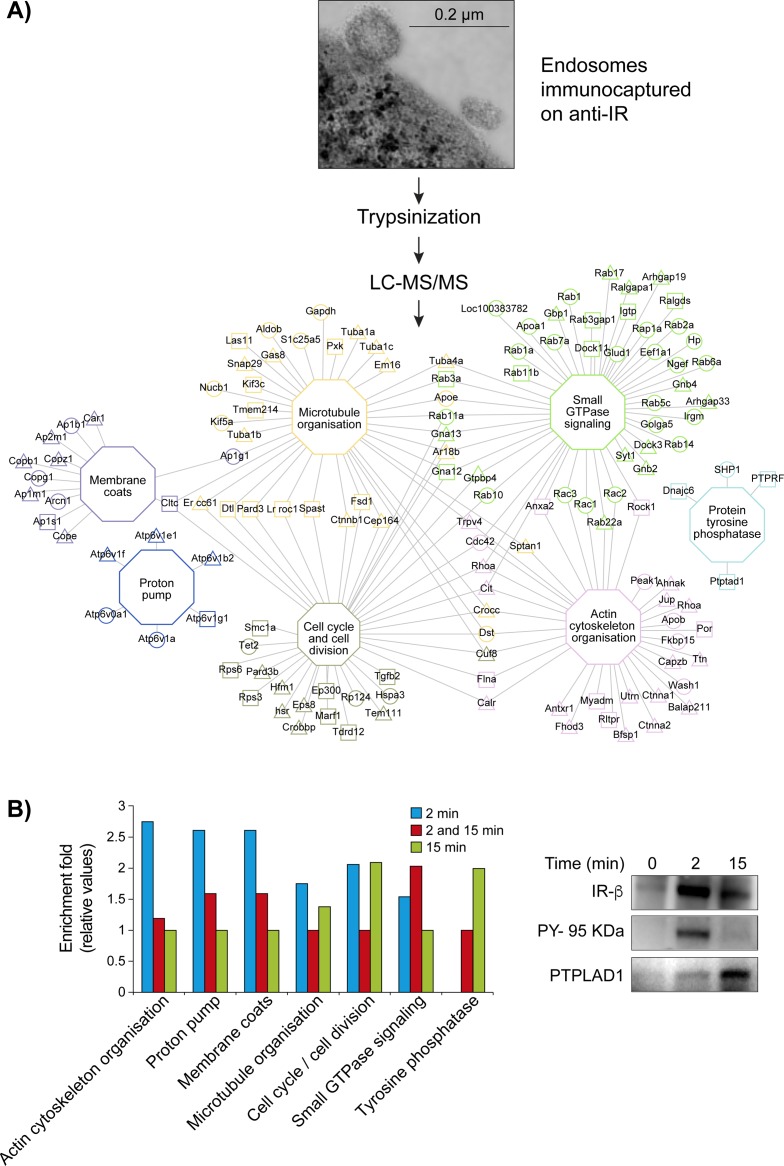
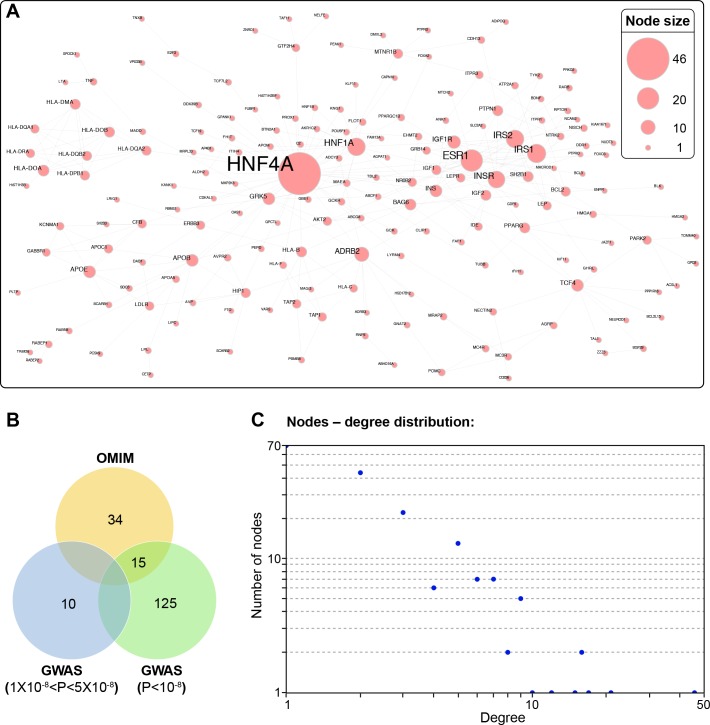
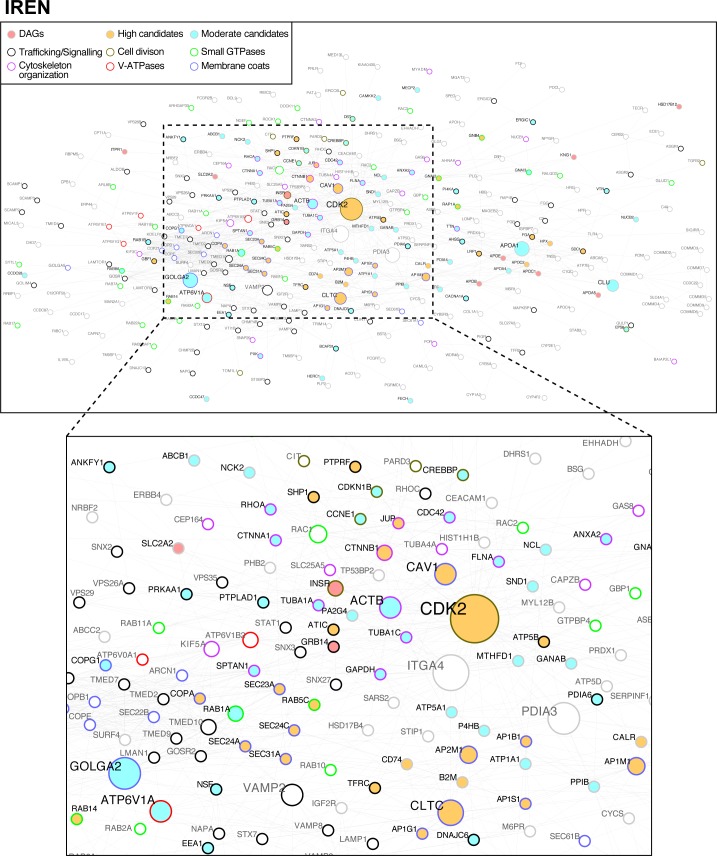
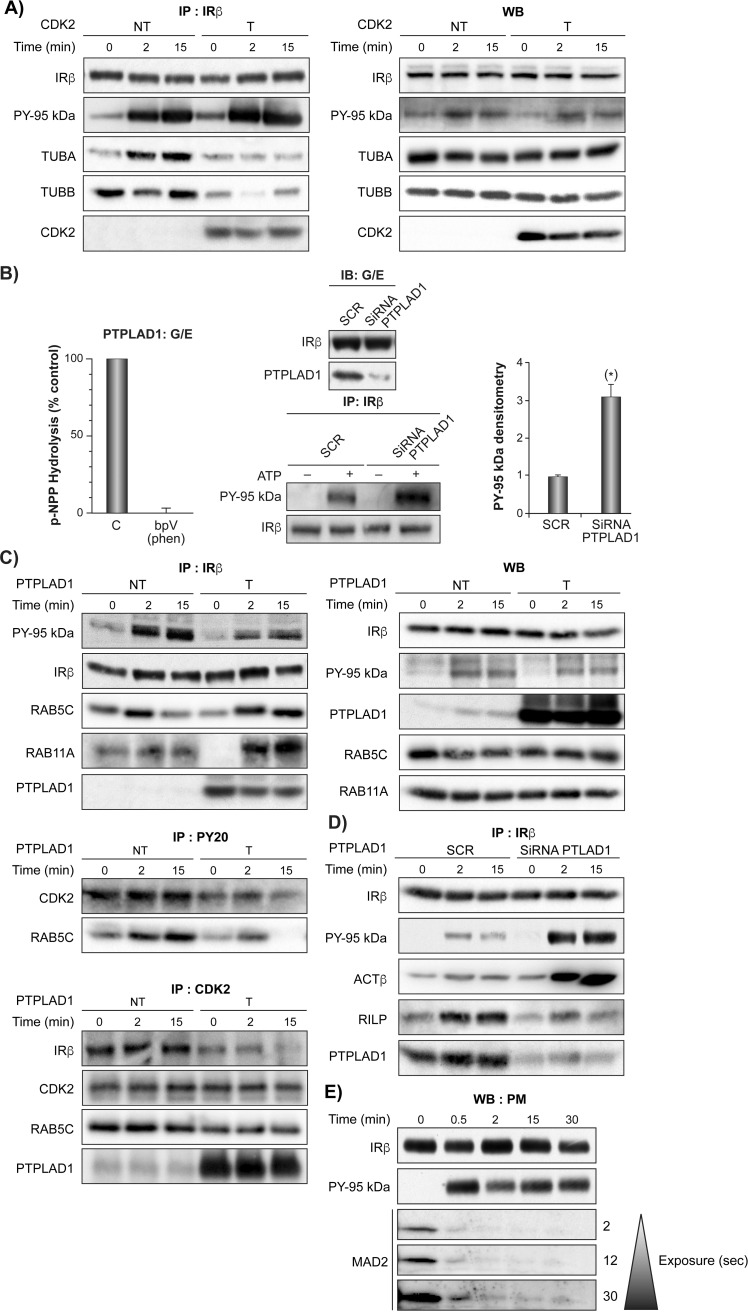
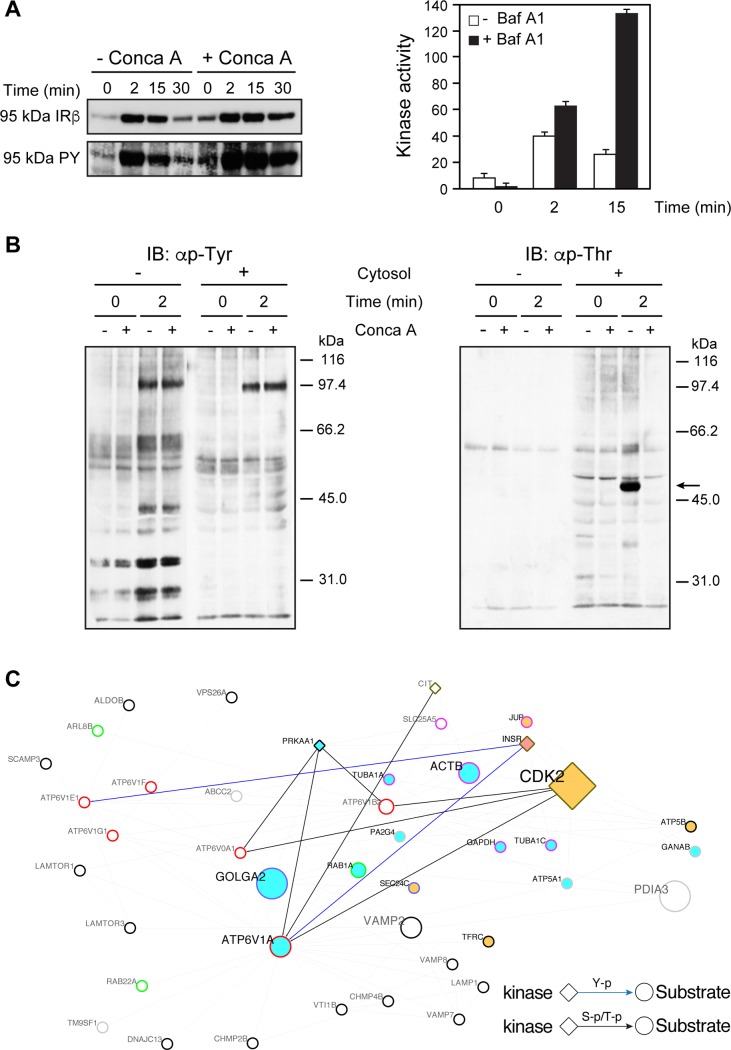
Despite the identification of many susceptibility genes our knowledge of the underlying mechanisms responsible for complex disease remains limited. Here, we identified a type 2 diabetes disease module in endosomes, and validate it for functional relevance on selected nodes. Using hepatic Golgi/endosomes fractions, we established a proteome of insulin receptor-containing endosomes that allowed the study of physical protein interaction networks on a type 2 diabetes background. The resulting collated network is formed by 313 nodes and 1147 edges with a topology organized around a few major hubs with Cdk2 displaying the highest collective influence. Overall, 88% of the nodes are associated with the type 2 diabetes genetic risk, including 101 new candidates. The Type 2 diabetes module is enriched with cytoskeleton and luminal acidification-dependent processes that are shared with secretion-related mechanisms. We identified new signaling pathways driven by Cdk2 and PTPLAD1 whose expression affects the association of the insulin receptor with TUBA, TUBB, the actin component ACTB and the endosomal sorting markers Rab5c and Rab11a. Therefore, the interactome of internalized insulin receptors reveals the presence of a type 2 diabetes disease module enriched in new layers of feedback loops required for insulin signaling, clearance and islet biology.


Conflict of interest statement

The authors declare that they have no competing interests.

Figures

Fig 1
Fig 1. Network of enriched cellular processes in IR-containing endosomes.
(A) Workflow of network construction: Inbound endosomal proteins (IREP) were classified into major functional groups according to the MGI database and using the tool BINGO. The triangles (2 minutes) and the squares (15 minutes) are indicative of the insulin post-injection time before endosomal preparation. The circles indicate proteins identified at both times. The hexagonal nodes and their respective border paints represent the functional groups associated linked proteins. Proteins associated with more than one functional group have the border paints of the most statistically significant functional group (S1 Table). (B) (left panel), Comparative enrichment profiles of trafficking proteins according to the insulin post-injection time. (right panel), the bound fraction (equal amount of starting material, see methods, S1 Fig) was blotted and pieces were incubated with antibodies against IR (95 kDA β-subunit), phosphotyrosine (PY-20, PY-95 kDA) and PTPLAD1.
Fig 2
Fig 2. Diabetes-associated genes form a protomodule.
(A) Overall, 452 diabetes-associated gene (DAGs; GWAS p value < 5 x 10⁻⁸ and OMIM) products form a PPIN of 184 proteins and 309 interactions termed T2D-protomodule. (B) In total, 10% (11/102) of the high-confidence DAGs with a probability less than 5 x 10⁻⁸, 53% of the DAGs with a probability less than 1 x 10⁻⁸ (141/266) and 49% of the OMIM genes (49/84) are recovered in the proto-T2D module, showing a tendency to select the highest level of reliability. (C) Nodes–degree distribution: More than 38% of nodes (70 nodes) in the proto-T2D module are peripheral with a minority of hubs from transcription factor families. The general topology of the protomodule is characteristic of a disease network with the presence of few central hubs of large size, surrounded by numerous peripheral hubs of smaller size (S3 Table).
Fig 3
Fig 3. The physical protein interaction network of IR-containing endosomes (IREN) has a Cdk2 centrality and is highly associated with type 2 diabetes risk.
The 557 IREP proteins were grouped and linked according to their physical association. The resulting network is formed by 313 nodes and 1147 edges (56% of IREP proteins). The general topology of IREN is based on few major hubs, with the kinase Cdk2 displaying the highest centrality (S3 Table). Candidates (yellow and blue colors and black characters; Tables 1 and Table A in S4 Table) and DAGs (pink color and black characters) form a single-connected disease module of 94 nodes (33% of IREN nodes) with 330 interactions (28,7% of IREN interactions). An expansion to the first level of adjacent nodes results in a connected subnetwork of 272 nodes (88% of nodes) covering 92% of interactions (1070 out of 1147 IREN interactions). The functional groups are represented according to the colors of the borders indicated in the legends.
Fig 4
Fig 4. Cdk2 and PTPLAD1 interact with IR complex organization.
(A) HEK293 cells were transfected with pcDNA3-Cdk2 (T) or pcDNA3 (NT) for 48 hours. They were preincubated in serum-free medium for 5 hours and then stimulated for the indicated times with insulin (35 nM). Proteins were resolved by SDS-PAGE and were blotted for the indicated proteins. The autoradiograms depict data from a typical experiment. Statistical values for salient time points are mean ± s.d. of % of initial densitometric values (two-tailed unpaired Student’s t-test). Left panel: IR immunoprecipitation (IP: IRβ), IR autophosphorylation (PY 95 kDa) and Cdk2, TUBA and TUBB presence. TUBA: NT 0 vs 2 min: Fold increase, 45 ± 7.5, n = 3, p ≤ 0.001; TUBB: NT 0 vs 2 min: Fold decrease, 55 ± 8, n = 3, p ≤ 0.001). Right panel: Immunoblots (WB) of CDK2, IR-β-subunit, TUBA, B (pieces of the same membrane except PY-95 kDa (PY20 antibody); 3 independent experiments). (B) IR autophosphorylation increases in isolated endosomes depleted of PTPLAD1. Right panel: Rats were injected with a scrambled (SCR) or siRNA oligonucleotide targeting PTPLAD1 for 48 hours. The G/E fractions were then prepared from livers at their IR concentration time-peak (2 minutes after insulin injection; 1.5 μg/100 g, b.w.). The presence of IR and PTPLAD1 was verified by immunoblot (IB: G/E, input 50 μg of protein, pieces of the same membrane). IR immunoprecipitation (IP: IR0β) and IR autophosphorylation (PY 95 kDa) were measured after suspending endosomes in a cell-free system in the presence of ATP for 2 minutes at 37 oC. After stopping the reaction, autophosphorylation was detected by immunoblotting using an anti-phosphotyrosine antibody (PY20). Normalized values shown in the right panel are means ± s.d. (* P<0.001 n = 3). Left panel: PTPLAD1 was immunoprecipitated from the same fractions (input 30 mg protein of solubilized G/E) and incubated with p-NPP in the presence or absence of 50 μM bpV(phen). The measured activity was expressed as a percentage of 0.55 +/- 0.8 mmoles/min/mg of cell extract, n = 4. (C) Cells were transfected with PTPLAD1-pcDNA3 (T) or pcDNA3 (NT) for 48 hours, incubated in serum-free medium for 5 hours and then stimulated for the indicated times with insulin (35 nM). The panel on the right shows immunoblots from the total cell lysates. Left panel, IPs of IRβ, phosphotyrosine (PY20 antibody, middle left), and Cdk2 (bottom left). IPs IRβ: Rab5c: NT, 0 vs 2 min: Fold increase, 250 ± 45, n = 3, p ≤ 0.001; 0 NT vs 0 T: Fold decrease 45 ± 9.5, n = 3, p ≤ 0.01); 15 NT vs 15 T: Fold increase 310 ± 35, n = 3, p ≤ 0.001). IPs Cdk2, Rab5c: 0 NT vs) T: Fold decrease 52 ± 7.5 n = 3, p ≤ 0.01). (D) PTPLAD1 siRNA knockdown. IPs of the IR β, ACTβ: 0 vs 2 min Si RNA PTPLAD1, Fold increase 420 ± 47, n = 3, p ≤ 0.001; RILP: 0 vs 2 min SCR, Fold increase 325 ± 35, n = 3, p ≤ 0.001 (E) The plasmamembrane (PM) fractions were prepared from rat liver at the indicated time following the injection of insulin (1.5 μg/100 g b.w.). Fractions were monitored for the PM-associated MAD2 by immunoblotting (50 μg proteins).
Fig 5
Fig 5. The pharmacological inhibition of V-ATPase affects the time peak of IR accumulation in endosomes.
Rats that were treated with concanamycin A (Conca A, 4.0 μg/100 g, b.w.) or were left untreated, were then stimulated with insulin (1.5 μg/100 g, b.w.) for the indicated time and the G/E fractions were isolated. (A) Left panel, immunoblot of IR using the anti-IRβ subunit or αPY20 (95 kDa PY) antibodies (50 μg of protein). Right panel, rats were left untreated or treated with bafilomycin A1 (Baf A1, 0.5 μg/100 g, b.w.). IRs from G/E fractions prepared at the noted time following insulin administration (1.5 μg/100 g, body weight) were partially purified by WGA-sepharose affinity chromatography and subjected to exogenous kinase assay. 32P incorporation into poly Glu-Tyr (4:1) is expressed as pmol/μg protein. Values shown are means ± s.d. (P<0.0001, 2 minutes and 15 minutes, n = 3). (B) G/E liver fractions were prepared at their IR concentration time peak (2 minutes after insulin injection; 1.5 μg/100 g b.w.) and immediately suspended in the cell-free system for 0 and 2 minutes at 37 oC and in the presence of ATP and the absence or presence of fresh cytosol (diluted 1/10) and Conca A. After stopping the reaction (0 and 2 minutes), the fractions were immunoblotted (input 50 μg of protein; 12% resolving gels) with the anti-phosphotyrosine (anti-p-Tyr, left panel) or anti-phosphothreonine (anti-pThr, right panel) antibodies. (C) Subnetwork extracted from IREN (Fig 3) depicting the connectivity of V-ATPase subunits. The V-ATPase subunits ATP6V1A, ATP6V1E1, ATP6VDA1 and ATP6V1B2 containing high confidence IR-tyrosine kinase phosphorylation and Ser/Thr kinases Cdk2, PRKAA1 (AMPK) and Citron phosphorylation motifs (S9 Table) are marked according to the legend.

References

    1. Boucher J, Kleinridders A, Kahn CR. Insulin receptor signaling in normal and insulin-resistant states. Cold Spring Harb Perspect Biol. 2014;6(1). Epub 2014/01/05. doi: 6/1/a009191 [pii] 10.1101/cshperspect.a009191 ; PubMed Central PMCID: PMC3941218. - DOI - PMC - PubMed
    1. Haeusler RA, McGraw TE, Accili D. Biochemical and cellular properties of insulin receptor signalling. Nat Rev Mol Cell Biol. 2017. 10.1038/nrm.2017.89 . - DOI - PMC - PubMed
    1. Bergeron JJ, Di Guglielmo GM, Dahan S, Dominguez M, Posner BI. Spatial and Temporal Regulation of Receptor Tyrosine Kinase Activation and Intracellular Signal Transduction. Annu Rev Biochem. 2016. Epub 2016/03/30. 10.1146/annurev-biochem-060815-014659 . - DOI - PubMed
    1. Villasenor R, Kalaidzidis Y, Zerial M. Signal processing by the endosomal system. Curr Opin Cell Biol. 2016;39:53–60. 10.1016/j.ceb.2016.02.002 . - DOI - PubMed
    1. Zeigerer A, Wuttke A, Marsico G, Seifert S, Kalaidzidis Y, Zerial M. Functional properties of hepatocytes in vitro are correlated with cell polarity maintenance. Exp Cell Res. 2016. 10.1016/j.yexcr.2016.11.027 . - DOI - PubMed

Publication types

Substances