. 2018 Oct 8;34(4):549-560.e9.
doi: 10.1016/j.ccell.2018.08.019.

Integrated Analysis of Genetic Ancestry and Genomic Alterations across Cancers

Affiliations

Integrated Analysis of Genetic Ancestry and Genomic Alterations across Cancers

Jiao Yuan et al. Cancer Cell. .

Abstract

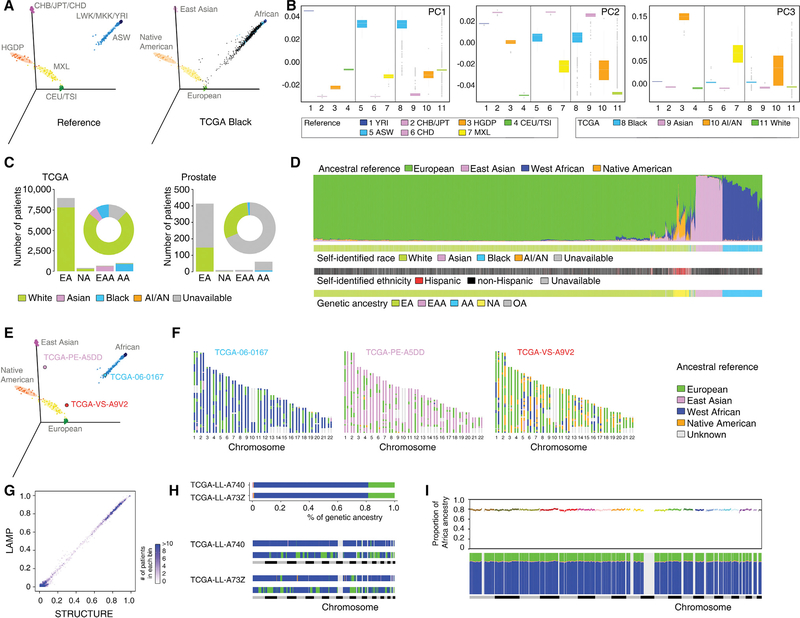
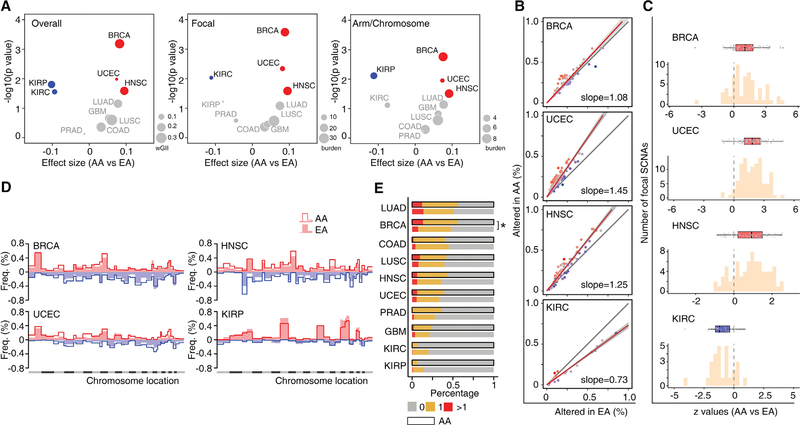
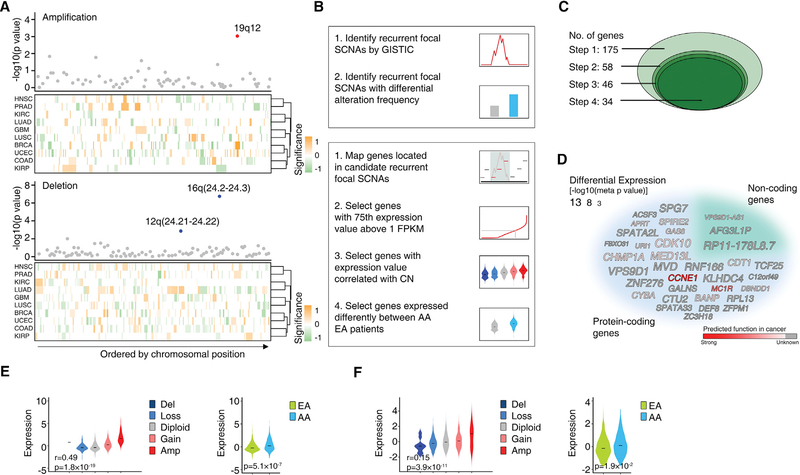
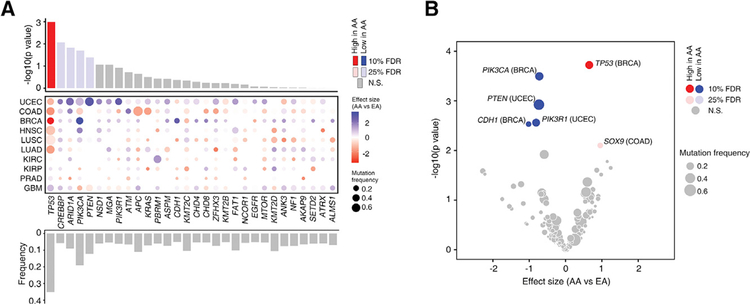
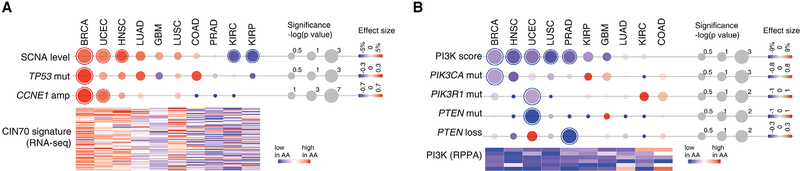
Disparities in cancer care have been a long-standing challenge. We estimated the genetic ancestry of The Cancer Genome Atlas patients, and performed a pan-cancer analysis on the influence of genetic ancestry on genomic alterations. Compared with European Americans, African Americans (AA) with breast, head and neck, and endometrial cancers exhibit a higher level of chromosomal instability, while a lower level of chromosomal instability was observed in AAs with kidney cancers. The frequencies of TP53 mutations and amplification of CCNE1 were increased in AAs in the cancer types showing higher levels of chromosomal instability. We observed lower frequencies of genomic alterations affecting genes in the PI3K pathway in AA patients across cancers. Our result provides insight into genomic contribution to cancer disparities.

Keywords: cancer disparities; cancer genetics; cancer genomics.


Conflict of interest statement

DECLARATION OF INTERESTS

The authors declare no competing interests.

Figures

Figure 1.
Figure 1.. Estimation of Genetic Ancestry across TCGA
(A) Three-dimensional visualization of genetic variation of individuals from the HapMap and HGDP reference populations (left) or self-identified Black patients of TCGA (right) on the first three principal components (PCs) calculated by EIGENSTRAT. The ellipse defines the 95% confidence interval for each genetically related group. (B) Genetic variation on each PC stratified by reference populations and TCGA self-identified racial identity. Reference populations were selected and classified according to geographical location and genetic origin. Boxplot lines reflect lower quartile, median, and upper quartile of PC scores. Whiskers extend 1.5 times the interquartile range from the upper and lower quartiles, with points outside representing outliers. (C) Bar plot showing the numbers of TCGA patients categorized into each of the four genetic ancestry groups (EA, NA, EAA, and AA) by EIGENSTRAT across the TCGA cohort (left) and in the prostate cancer cohort (right). SIRE information is color-coded by green (White), pink (Asian), blue (Black), orange (AI/AN), and gray (unavailable). The proportion of SIRE is also represented with a circle plot. (D) Individual ancestry of TCGA patients inferred by STRUCTURE. Each color represents one of the ancestry reference groups. Each patient is represented by a column partitioned into different colors corresponding to the genetic ancestry composition. Patients are ordered following a hierarchical clustering by Ward’s methods on distance matrix calculated as cosine dissimilarity of genetic composition. SIRE and genetic ancestry categorization as estimated by EIGENSTRAT for each patient are shown in the same order at the bottom. (E) Three-dimensional visualization of reference populations with three patients (TCGA-06–0167, TCGA-PE-A5DD, and TCGA-VS-A9V2) used as examples for genetic ancestry (AA, EAA, and NA, respectively). (F) Local ancestry across SNPs on 22 autosomes inferred by LAMP for these three patients. Each patient was treated as a diploid admixed genome. The colors represent ancestral reference groups, and light gray marks genomic regions unassigned because they are missing from SNPs shared by reference populations. (G) Comparison of the percent of West African ancestry inferred from LAMP (based on distribution of local ancestry) versus STRUCTURE. TCGA patients are grouped into bins, each of which represents an interval of 1% range. The intensity of a bin represents the number of patients in the given interval group. (H) Global (top) and local ancestry (bottom) of two unrelated admixed AA patients. To visualize local ancestry, SNPs on 22 autosomes are ordered according to genomic location. Each color represents one of the ancestry reference groups. Same color code as in (F). (I) Genome-wide distribution of average ancestry proportion at each ancestral segment in AA patients of TCGA. Top, average proportion of West African ancestry plotted against genomic position along the 22 autosomal chromosomes (colors indicate different chromosomes). Bottom, average contribution from the four ancestral groups. Each color represents one of the ancestry reference groups. Same color code as in (F). See also Figures S1–S3; Tables S1 and S2.
Figure 2.
Figure 2.. The Cancer Genetic Ancestry Atlas
(A) Summary of analysis and integration strategies for genotype data. The global and local genetic ancestry for each patient of TCGA was estimated by three algorithms (EIGNSTRAT, STRUCTURE, and LAMP). Unrelated individuals from the HapMap and HGDP projects were used as reference populations. The genetic ancestry information was integrated with genomic profiles and provided through the TCGAA data portal. N, the number of cancer types (TCGA) or reference populations (HapMap and HGDP); n, the number of individuals. (B) Overview of TCGAA data portal. The TCGAA database contains integrated information for 11,122 primary cancer specimens across 27 primary sites (33 cancer types). The global and local genetic ancestry information for 1,251 established cancer cell lines with a detailed genetic and pharmacologic characterization is also provided via a sub-database (CCGAA). (C) The TCGAA and CCGAA provide six modules (Summary, Search, Analysis, Visualization, Integration, and Download) by integrating genetic ancestry, clinical annotations, and genomic profiles of the TCGA project.
Figure 3.
Figure 3.. The Genetic Ancestry of TCGA Patients
(A) Summary of genetic ancestry of TCGA patients across 33 cancer types. The size of each circle corresponds to the number of samples of a given cancer type, and the proportion of each genetic ancestry is indicated by color. A color-coded square indicates that the sample number of a given minority genetic ancestry group is larger than 20. (B) Summary of the patient numbers of each minority genetic ancestry group. The cancer types in each minority group are ranked by the number of minority patients in the group. The cancer types that show evidence for racial disparities are labeled by a color-coded circle in each minority group. See also Tables S3 and S4.
Figure 4.
Figure 4.. AA Genetic Ancestry and Global Somatic Copy-Number Alterations
(A) Volcano plot of log10 (p value) against effect size (AA versus EA), representing the difference in SCNA scores between AA and EA patients across 10 cancer types. Each circle corresponds to a cancer type with size proportional to median burden of SCNA: weighted genomic instability index at overall level, weighted sum of SCNA events at the focal level or the arm/chromosomal level. Significance (y axis) and effect size (x axis) were calculated by linear regression adjusting for a clinical factors-derived propensity score. SCNA scores were rank-scaling transformed as a conservative measure to avoid results driven by outliers. Positive effect size corresponded to elevation of SCNA score in AA patients and negative values to reduction. The cancer types with significantly elevated or reduced SCNA scores in AA patients (FDR < 10%) are shown in red or blue, respectively. Cancer types with non-significant results are colored in gray. (B) Comparison of the alteration frequency for recurrent focal SCNAs in AA versus EA patients of BRCA, UCEC, HNSC, and KIRC, respectively. Dots represent recurrent focal SCNAs (peak regions) identified by GISTIC. The y and x axes represent the alteration frequency for a peak region in AA and EA patients, respectively. The gray line indicates the null hypothesis (y = x) that AA patients are affected at an equal rate with EA patients at each peak region. A fitted line on all dots is plotted, with slope indicating the overall difference in alteration rate at peak regions. The fitted line is colored red if the slope is greater than one and blue if the slope is less than one. (C) Histogram of Z values by logistic regression comparing alteration frequency of recurrent focal SCNAs between AA and EA patients, with clinical factors adjusted. For each cancer type, boxplot lines reflect lower quartile, median, and upper quartile of Z values. Whiskers extend 1.5 times the interquartile range from the upper and lower quartiles, with points outside representing outliers. Each point represents a recurrent focal SCNA. Boxes are colored red if the lower quartile is above zero and blue if the upper quartile is below zero. (D) Comparison of the alteration frequency of arm-level SCNAs across the whole genome in BRCA, UCEC, HNSC, and KIRP. An arm-level value of the log2 copy-number change ratio larger than 0.25 was considered an arm copy-number alteration. For each chromosome arm in a certain cancer type, the frequency of gain (red, above horizontal line) or loss (blue, under horizontal line) was calculated and plotted separately. Alteration frequency of each chromosome arm in a given cancer type is plotted as lines or filled bars for AA or EA patients, respectively. (E) Frequency of genome doubling stratified by genetic ancestry (AA versus EA) in each cancer type. The cancer types with significantly different odds of WGD event in AA patients (FDR < 10%) are marked with an asterisk. See also Figure S3.
Figure 5.
Figure 5.. AA Genetic Ancestry and Focal Copy-Number Alterations
(A) Three recurrent focal SCNAs with significantly different alteration frequencies between AA and EA patients were identified by a pan-cancer meta-analysis across 10 cancer types. The top dot plots show the significance (y axis) of the meta-analysis. Dots represent recurrent focal SCNAs (peak regions) identified in at least two cancer types, ordered by genomic location. The red or blue dots represent the recurrent focal SCNAs identified to be altered at significantly different rates in AA patients compared with EA patients (with FDR < 10%) by a pan-cancer meta-analysis across ten cancer types (red represent amplification and blue represent deletions, respectively). The bottom heatmaps show schematic boundaries of peak regions identified by GISTIC in each cancer type. Cancer types are clustered by similarity of independent significance upon analysis on the cancer-specific level by controlled permutation test. Significance for each recurrent focal SCNA on the cancer-specific level is colored with intensity (a higher-intensity color represents a more significant difference; orange represents higher alteration rate in AA patients and green represents lower alteration rate in AA patients, respectively). (B) Simplified workflow of the computational approaches used to identify recurrent focal SCNAs with significantly different alteration frequencies between AA and EA patients (top), and genes potentially contributing to disparity through SCNAs (bottom). (C) Diagram shows the number of candidate genes during the stepwise filtering depicted in (B). (D) Word cloud of the genes potentially contributing to disparity through SCNAs identified by pan-cancer analysis. The size of the font indicates the significance (p value on a negative log scale) of differential expression between AAs and EAs after adjusting for clinical factors. Gray indicates the function of the gene in cancer is unknown and the intensity of red color indicates prediction score of gene function in cancer. (E and F) Violin plots showing the cancer type-adjusted RNA expression levels of CCNE1 (E) and VPS9D1-AS1 (F) across given cancer types, with samples grouped based on gene copy number (left) or genetic ancestry (right). The central line within each violin represents the median value. Correlations between RNA expression and predicted gene copy numbers (left) were calculated by meta-analysis. Tests for differential expression between AA and EA tumors (right) were calculated by meta-analysis adjusting for clinical factors. See also Figure S3; Tables S5–S8.
Figure 6.
Figure 6.. AA Genetic Ancestry and Somatic Mutation
(A) Summary of pan-cancer meta-analysis on recurrently mutated genes between AA and EA patients across 10 cancer types. The top bar plot shows the significance (y axis) of the meta-analysis for each recurrently mutated gene. Red and blue bars represent the genes whose mutation frequencies are significantly higher and lower in AAs compared with EA, respectively. The middle dot plot shows independent differences in mutation frequency in each cancer type. The intensity of color corresponds to effect size of AA ancestry compared with EAs (red and blue indicate higher and lower frequencies in AA, respectively). The size corresponds to overall mutation frequency of a given gene in a specific cancer type. Cancer types are ordered by similarity between statistical measures (Z score based) observed at the individual cancer type level and at the pan-cancer level. The bottom bar plot shows the mutation frequency of the recurrently mutated genes across 10 cancer types. (B) Summary of the cancer type-specific analysis on recurrently mutated genes between AA and EA patients in ten cancer types. The volcano plot of −log10 (p value) against effect size (AA versus EA) represents the difference in mutation frequency between AA and EA patients for a given cancer type after adjusting for clinical factors. Each circle corresponds to a gene tested in a specific cancer type with size proportional to overall mutation frequency. Red and blue circles represent the genes whose mutation frequencies are significantly higher and lower in AAs compared with EA, respectively. See also Tables S9, S10, and S11.
Figure 7.
Figure 7.. Integrated Analysis of Genomic Alterations on Patients with AA Genetic Ancestry
(A) Chromosomal instability and associated genes in AA patients. The upper dot plot shows the overall SCNA score and genomic alterations (TP53 mutation and CCNE1 amplification) for each cancer type. The intensity of circles represents the relative difference between AA and EA patients in the individual cancer type, with the size proportional to the significance of the association. A circle with an outline indicates a statistically significant difference (FDR < 0.1). Red, increased in AA; blue, decreased in AA. The heatmap at the bottom shows normalized significance levels (−log[p value]) for the association between AA ancestry and the expression of 70 genes correlated with chromosomal instability (CIN70 signature). For all statistical tests, clinical factors were considered. (B) PI3K activity and associated genes in AA patients. The dot plot at the top shows the PI3K score and genomic alterations (PIK3CA, PIK3R1, and PTEN mutations; PTEN deletion) for each cancer type. The intensity of circle represents the relative difference between AA and EA patients in the individual cancer type, with the size proportional to the significance of the association. A circle with an outline indicates a statistically significant difference (FDR < 0.1). Red, increased in AA; blue, decreased in AA. The heatmap at the bottom shows normalized significance levels (−log[p value]) for the association between AA ancestry and expression of proteins (reverse-phase protein array [RPPA]) correlated with PI3K activity. For all statistical tests, clinical factors were considered.

Comment in

References

    1. Ademuyiwa FO, Tao Y, Luo J, Weilbaecher K, and Ma CX (2017). Differences in the mutational landscape of triple-negative breast cancer in African Americans and Caucasians. Breast Cancer Res. Treat 161, 491–499. - PMC - PubMed
    1. Alexandrov LB, Jones PH, Wedge DC, Sale JE, Campbell PJ, Nik-Zainal S, and Stratton MR (2015). Clock-like mutational processes in human somatic cells. Nat. Genet 47, 1402–1407. - PMC - PubMed
    1. Alexandrov LB, Nik-Zainal S, Wedge DC, Aparicio SA, Behjati S, Biankin AV, Bignell GR, Bolli N, Borg A, Borresen-Dale AL, et al. (2013). Signatures of mutational processes in human cancer. Nature 500, 415–421. - PMC - PubMed
    1. Angeloni SV, Martin MB, Garcia-Morales P, Castro-Galache MD, Ferragut JA, and Saceda M (2004). Regulation of estrogen receptor-alpha expression by the tumor suppressor gene p53 in MCF-7 cells. J. Endocrinol 180, 497–504. - PubMed
    1. Araujo LH, Timmers C, Bell EH, Shilo K, Lammers PE, Zhao W, Natarajan TG, Miller CJ, Zhang J, Yilmaz AS, et al. (2015). Genomic characterization of non-small-cell lung cancer in African Americans by targeted massively parallel sequencing. J. Clin. Oncol 33, 1966–1973. - PMC - PubMed

Publication types