. 2018 Oct 8;34(4):626-642.e8.
doi: 10.1016/j.ccell.2018.08.015.

The Oncogenic Transcription Factor RUNX1/ETO Corrupts Cell Cycle Regulation to Drive Leukemic Transformation

Affiliations

The Oncogenic Transcription Factor RUNX1/ETO Corrupts Cell Cycle Regulation to Drive Leukemic Transformation

Natalia Martinez-Soria et al. Cancer Cell. .

Erratum in

  • The Oncogenic Transcription Factor RUNX1/ETO Corrupts Cell Cycle Regulation to Drive Leukemic Transformation.
    Martinez-Soria N, McKenzie L, Draper J, Ptasinska A, Issa H, Potluri S, Blair HJ, Pickin A, Isa A, Chin PS, Tirtakusuma R, Coleman D, Nakjang S, Assi S, Forster V, Reza M, Law E, Berry P, Mueller D, Osborne C, Elder A, Bomken SN, Pal D, Allan JM, Veal GJ, Cockerill PN, Wichmann C, Vormoor J, Lacaud G, Bonifer C, Heidenreich O. Martinez-Soria N, et al. Cancer Cell. 2019 Apr 15;35(4):705. doi: 10.1016/j.ccell.2019.03.012. Cancer Cell. 2019. PMID: 30991028 Free PMC article. No abstract available.

Abstract

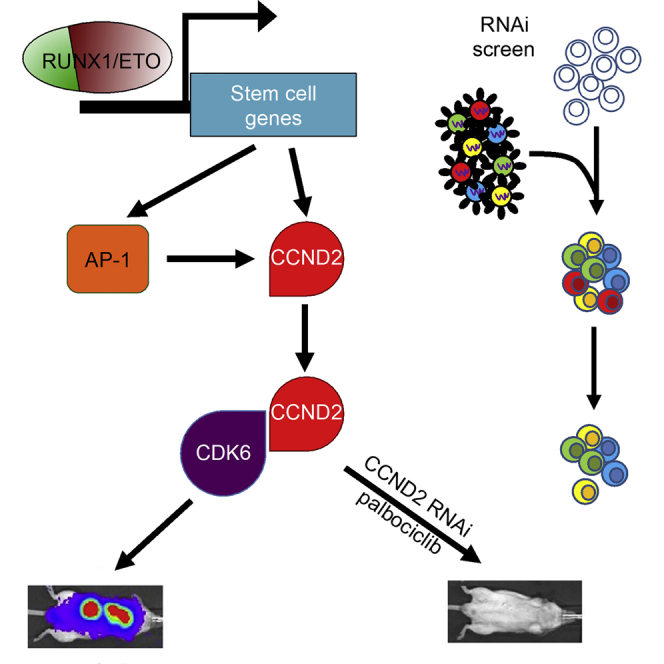
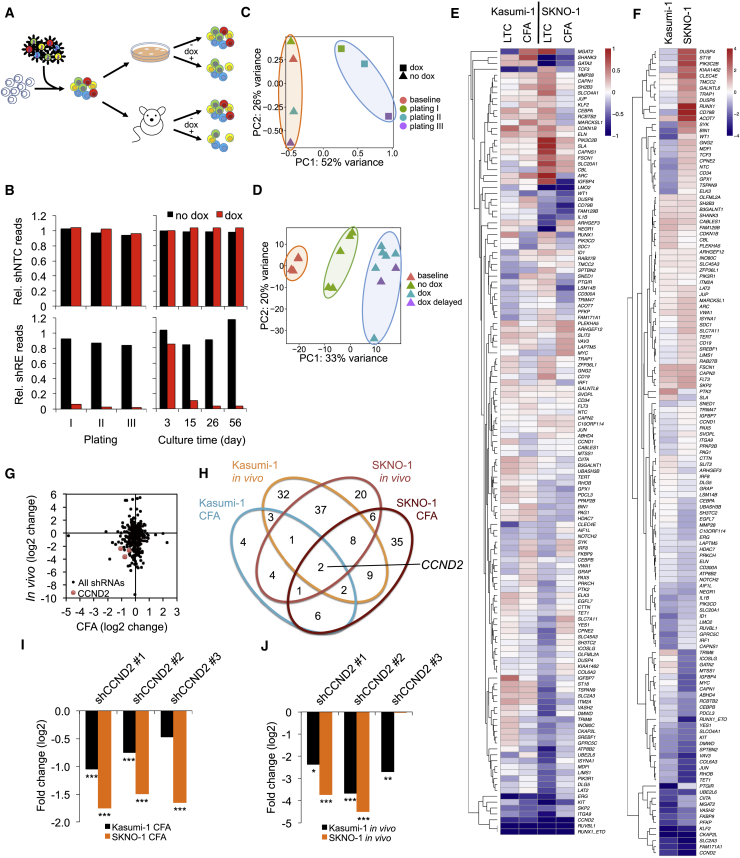
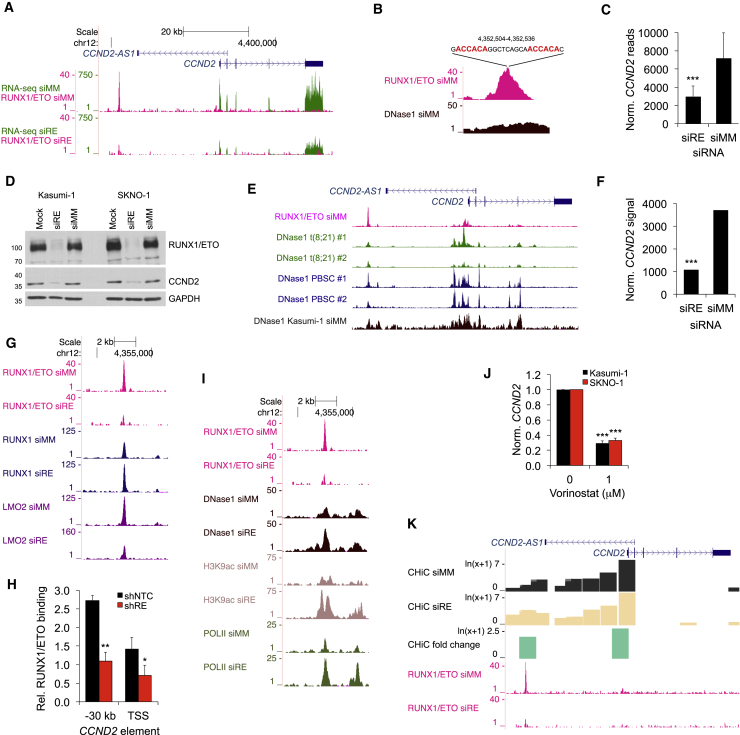
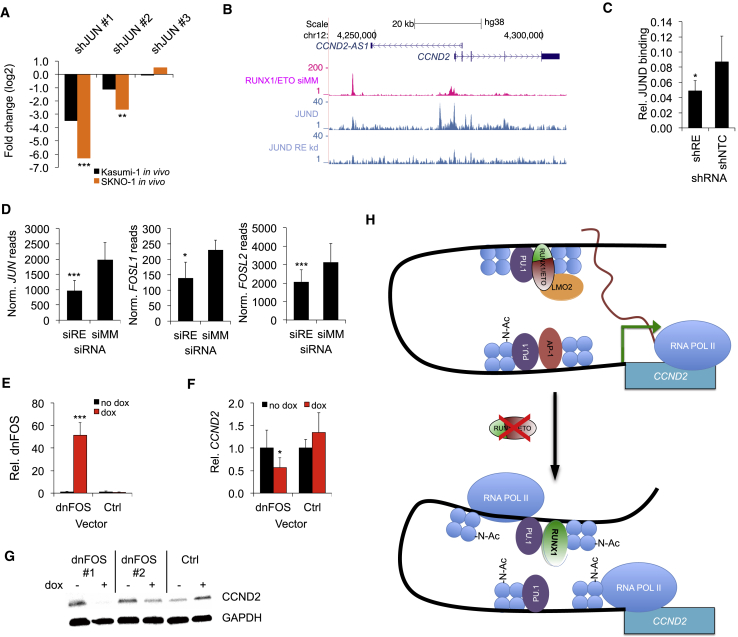
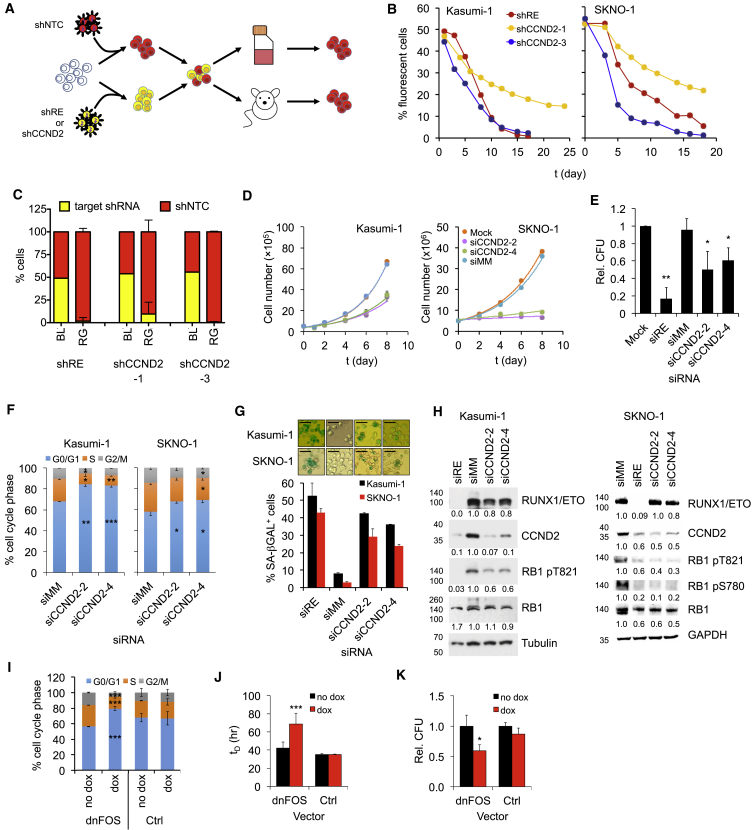
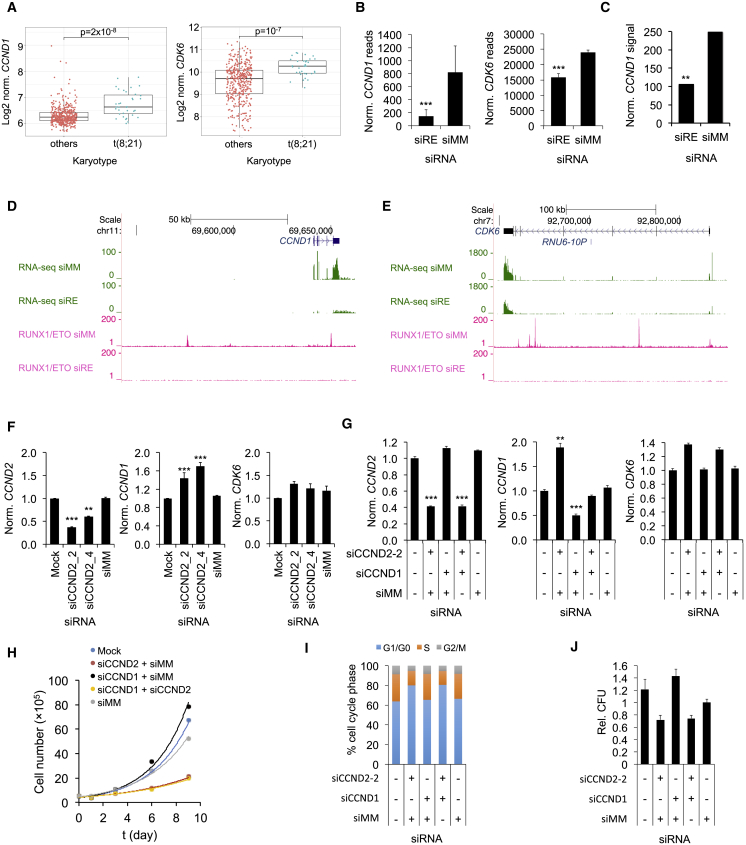
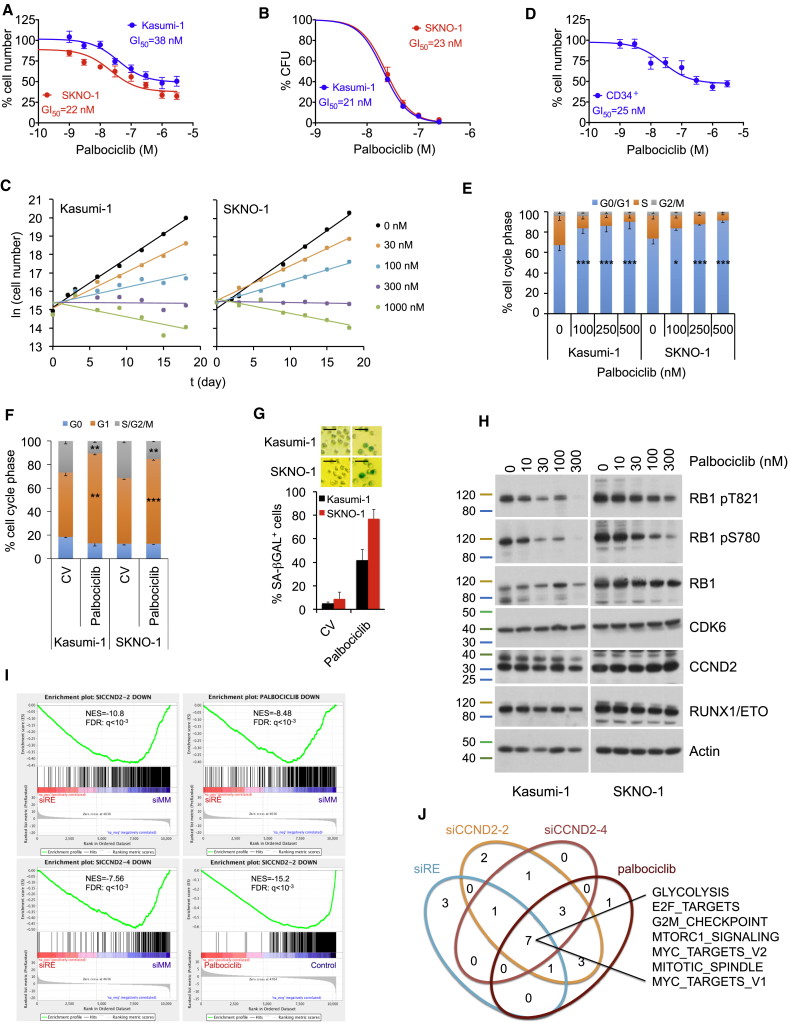
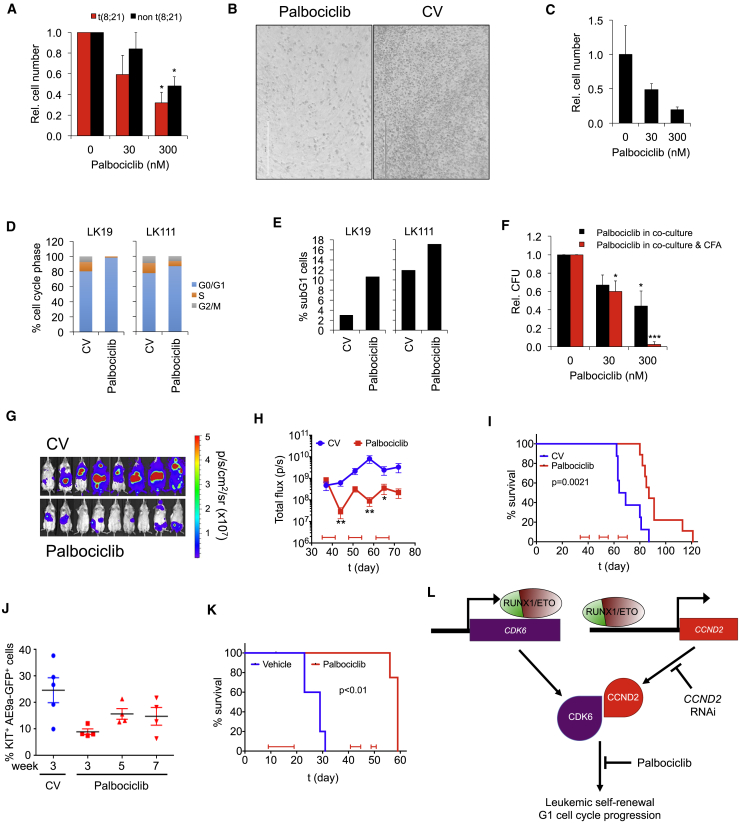
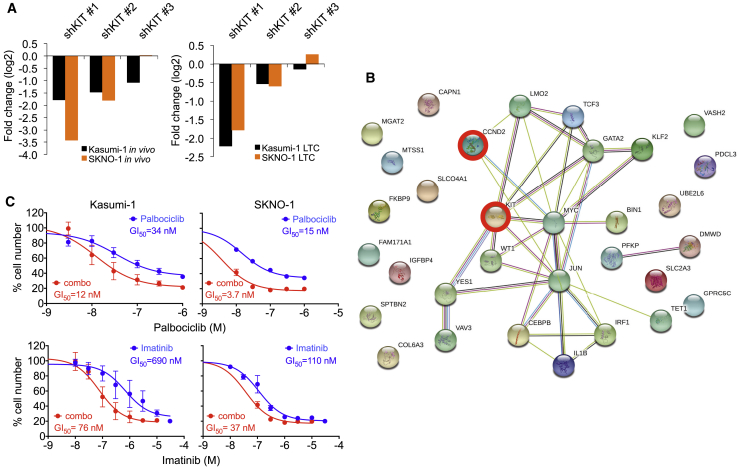
Oncogenic transcription factors such as the leukemic fusion protein RUNX1/ETO, which drives t(8;21) acute myeloid leukemia (AML), constitute cancer-specific but highly challenging therapeutic targets. We used epigenomic profiling data for an RNAi screen to interrogate the transcriptional network maintaining t(8;21) AML. This strategy identified Cyclin D2 (CCND2) as a crucial transmitter of RUNX1/ETO-driven leukemic propagation. RUNX1/ETO cooperates with AP-1 to drive CCND2 expression. Knockdown or pharmacological inhibition of CCND2 by an approved drug significantly impairs leukemic expansion of patient-derived AML cells and engraftment in immunodeficient murine hosts. Our data demonstrate that RUNX1/ETO maintains leukemia by promoting cell cycle progression and identifies G1 CCND-CDK complexes as promising therapeutic targets for treatment of RUNX1/ETO-driven AML.

Keywords: CCND2; CDK6 inhibition; KIT mutation; RNAi screen; RUNX1/ETO; acute myeloid leukemia; cell-cycle control; fusion gene; imatinib; palbociclib.


Figures

None
Graphical abstract
Figure 1
Figure 1
A Combined In Vitro/In Vivo RNAi Screen Identifies CCND2 as Crucial Mediator of RUNX1/ETO Function (A) Scheme of the RNAi screen. t(8;21) cell lines were transduced with the lentiviral shRNA library and propagated with and without shRNA induction by doxycycline either in vitro in three consecutive replatings (12–14 days per plating) and long-term suspension culture for up to 56 days (LTC) or in vivo by xenotransplantation of immunodeficient mice killed upon reaching clinical endpoints. (B) Changes in relative (Rel.) sequencing read levels of proviral non-targeting control shRNA (shNTC) and RUNX1/ETO shRNA (shRE). (C) PCA of shRNA pools in Kasumi-1 colony formation assay (CFA) cells during replating. PC, principal component. (D) PCA of shRNA pools from Kasumi-1 transplanted NSG mice. dox, dox treatment initiated immediately after transplantation; dox delayed, doxycycline treatment initiated 28 days after transplantation. (E and F) Clustered heatmaps showing fold changes for genes in the in vitro (E) and the in vivo (F) arms of the RNAi screen. Fold changes were calculated based on collapsed changes of shRNAs using the RRA approach of MAGeCK. (G) Comparison of changes in shRNA construct levels in vivo and after the third replating. (H) Venn diagram identifying depleted shRNA constructs shared between the different RNAi screen conditions. (I and J) Fold change of all CCND2 shRNA constructs after third replatings (I) and in vivo engraftment (J). ∗∗∗p < 0.001; ∗∗p < 0.01; p < 0.05 compared with no dox controls. See also Figure S1 and Tables S1, S2, and S3.
Figure 2
Figure 2
RUNX1/ETO Controls CCND2 Expression via an Upstream Regulatory Element (A) University of California, Santa Cruz (UCSC) genome browser screenshot displaying changes in transcript levels (green) based on RNA sequencing (RNA-seq) and RUNX1/ETO binding (pink) based on ChIP-seq at the CCND2 locus in Kasumi-1 cells. siRE, RUNX1/ETO small interfering RNA (siRNA); siMM, mismatch control siRNA. Scale and nucleotide positions are indicated at the top. (B) Screenshot of RUNX1/ETO binding and DNase1 hypersensitive sites (DNase1) at the −30 kb region of CCND2 in Kasumi-1 cells treated with siMM. The location and sequence are shown on top with the RUNX1 consensus sites indicated in red. (C) Change in CCND2 transcript levels between Kasumi-1 cells treated with siMM and siRE, as determined by RNA-seq. ∗∗∗p < 0.001 compared with siMM. (D) Immunoblots of CCND2 protein levels in Kasumi-1 and SKNO-1 cells following RUNX1/ETO knockdown. Mock, electroporated without siRNA. (E) Chromatin accessibility at CCND2 for two t(8;21) AML patients (t(8;21) #1 and #2), normal CD34+ PBSCs from two donors (PBSC #1 and #2) and Kasumi-1 cells as judged by DHS-seq. Top panel, RUNX1/ETO binding by ChIP-seq. (F) CCND2 transcript levels in primary AML (patient sample L852) with (siRE) and without (siMM) RUNX1/ETO knockdown as analyzed by Illumina bead arrays with probe ILMN_2067656. ∗∗∗p < 0.001 (Illumina custom false discovery rate [FDR]) compared with siMM. (G) Effect of RUNX1/ETO knockdown on transcription factor binding at the CCND2 locus in Kasumi-1 cells. (H) Assessment of RUNX1/ETO in control (shNTC) or RUNX1/ETO knockdown (shRE) Kasumi-1 cells at the −30 kb element of CCND2 by manual ChIP. n = 3; mean ± SD; p < 0.05; ∗∗p < 0.01 compared with shNTC. (I and J) (I) Assessment of epigenetic changes by ChIP-seq and DHS-seq in chromatin structure, histone K9 acetylation, and RNA Pol II occupation at the −30 kb element upon RUNX1/ETO knockdown (siRE) in comparison with siMM in Kasumi-1 cells. (J) Impact of the HDAC inhibitor vorinostat on CCND2 RNA expression normalized to GAPDH (norm. CCND2) in t(8;21) AML cell lines. n = 3; mean ± SD; ∗∗∗p < 0.001 compared with shNTC. (K) Genome browser screenshot of promoter capture CHiC in Kasumi-1 cells visualizing the impact of RUNX1/ETO depletion on the interaction of the −30 kb element with the CCND2 TSS. Control siRNA treatment, CHiC siMM; RUNX1/ETO knockdown, CHiC siRE. CHiC fold change, fold difference in interaction between RUNX1/ETO knockdown and control. See also Figure S2.
Figure 3
Figure 3
RUNX1/ETO Regulates CCND2 Expression by Promoting AP-1 Activity (A) Log fold change of three JUN shRNA construct levels in in vivo screens in Kasumi-1 and SKNO-1 cells. ∗∗∗p < 0.001; ∗∗p < 0.01 compared with no dox controls. (B) UCSC screenshot showing JUND and RUNX1/ETO binding to the CCND2 locus with and without RUNX1/ETO knockdown in Kasumi-1 cells. (C–E) (C) Manual ChIP validation of JUND binding at the CCND2 promoter with and without RUNX1/ETO knockdown in Kasumi-1 cells. shRE, RUNX1/ETO shRNA; shNTC, non-targeting control shRNA. n = 3; mean ± SD; p < 0.05 compared with shNTC. (D) Changes in transcript levels of JUN and FOS members upon RUNX1/ETO knockdown in Kasumi-1 cells as assessed by RNA-seq. Mean ± SD; n = 3. ∗∗∗p < 0.001; p < 0.05 compared with shNTC. (E) Expression of dnFOS transcript in Kasumi-1 cells lentivirally transduced with dnFOS or control (Ctrl) vector. Cells were incubated for 5 days with and without dox. n = 3; mean ± SD; ∗∗∗p < 0.001. (F) Impact of dnFOS induction by doxycycline in Kasumi-1 cells on relative CCND2 transcript levels measured by qPCR normalized to GAPDH. n = 3; mean ± SD; p < 0.05. (G) Immunoblot showing CCND2 protein levels in Kasumi-1 cells upon dnFOS induction for 5 days. dnFOS#1 and dnFOS#2, FOS overexpressing clones 1 and 2, respectively; Ctrl, normal Kasumi-1 cells. (H) Scheme depicting a model for the regulation of CCND2 by RUNX1/ETO. Depletion of RUNX1/ETO enhances interaction between −30 kb and TSS, increases H3K9 acetylation and occupation of the −30 kb element by RUNX1 and RNA Pol II, impairs AP1 binding at the promoter, and stalls RNA Pol II at the TSS, leading to reduced CCND2 transcription. See also Figure S3.
Figure 4
Figure 4
RUNX1/ETO-Expressing AML Cells Are Addicted to CCND2 (A) Scheme of the competitive co-culture and transplantation approaches. t(8;21) cells were lentivirally transduced with either a vector linking RPF657 to a non-targeting control shRNA (shNTC) or dTomato to an shRNA targeting either RUNX1/ETO (shRE) or CCND2 (shCCND2-1, −3). Control and knockdown cells were mixed 50:50 followed by co-culture (Kasumi-1 and SKNO-1) or intrahepatic transplantation into newborn RG mice (Kasumi-1). shRE, RUNX1/ETO shRNA; shCCND2, CCND2 shRNA; shNTC, non-targeting control shRNA. (B) Graph showing percentage of shRE-, shCCND2-1- or shCCND2-3 expressing Kasumi-1 and SKNO-1 cells compared with snNTC expressing cells during LTC. (C) Percentage of Kasumi-1 cells with indicated shRNA in transplanted RG mice. BL, starting pool prior to transplantation; RG, cells harvested from transplanted RG mice humanely killed at clinical endpoints. Mean ± SD, n = 5. (D) Proliferation curves for Kasumi-1 and SKNO-1 cells electroporated sequentially every two days with the indicated siRNAs. Mock; non-siRNA electroporated cells; siCCND2, CCND2 siRNA; siMM, mismatch control siRNA. Kasumi-1, n = 3, mean ± SD; SKNO-1, n = 1. (E) Colony formation of Kasumi-1 cells transduced with the indicated siRNA constructs at 12 days post plating. CFU, colony-forming unit. Mean ± SD; Kasumi-1, n = 3; ∗∗p < 0.01; p < 0.05 compared with Mock. (F) Cell cycle distribution of Kasumi-1 and SKNO-1 cells with and without CCND2 knockdown. Mean ± SD; n = 3. Counts at 12 days post plating. Mean ± SD; Kasumi-1, n = 3; ∗∗∗p < 0.001; ∗∗p < 0.01; p < 0.05 compared with siMM. (G) Senescence in Kasumi-1 and SKNO-1 cells as indicated by staining for senescence-associated β-galactosidase (SA-βGAL) after two sequential electroporations with the indicated siRNAs. Top panels, stained cells; bottom panel, quantitation of SA-βGAL+ cell numbers. n = 2 technical replicates; mean ± range. Standard bar, 50 μm. (H) Immunoblots showing the effect of RUNX1/ETO and CCND2 knockdown in Kasumi-1 and SKNO-1 cells on phosphorylation of RB1. Numbers indicate fold changes. (I) Cell cycle distribution of Kasumi-1 cells after 5 days with and without dnFOS induction by doxycycline. Ctrl, empty vector control; dnFOS, dnFOS vector-containing cells. Mean ± SD; n = 3. ∗∗∗p < 0.001 compared with no dox. (J) Impact of dnFOS inductions on cell doubling times (tD). Mean ± SD; n = 3. ∗∗∗p < 0.001 compared with no dox. (K) Impact of dnFOS induction on clonogenicity of Kasumi-1 cells. Colonies were counted 12 days post plating relative to no dox. Mean ± SD; n = 3. p < 0.05 compared with no dox. See also Figure S4.
Figure 5
Figure 5
G1 Cell Cycle Components Are Regulated by RUNX1/ETO but Do Not Compensate for CCND2 Loss (A) Comparison of CCND1 and CDK6 expression between patients with t(8;21)-positive and -negative AML. Line, median; horizontal box, interquartile range; whiskers, 1.5× interquartile range. p value was determined by Mann-Whitney U test. Data were obtained from GEO GSE6891. (B) CCND1 and CDK6 expression with and without RUNX1/ETO knockdown in Kasumi-1 cells as indicated by RNA-seq. siRE, RUNX1/ETO siRNA; siMM, mismatch control siRNA. Mean ± SD; n = 3. ∗∗∗p < 0.001. (C) CCND1 transcript levels in primary t(8;21) AML blasts upon RUNX1/ETO knockdown as analyzed by Illumina bead arrays with probe ILMN_1688480. ∗∗p < 0.01 compared with siMM. (D and E) RUNX1/ETO knockdown-induced changes in transcript levels and RUNX1/ETO binding at the CCND1 (D) and CDK6 (E) loci in Kasumi-1 cells as indicated by RNA-seq (green) and ChIP-seq (pink), respectively. Top, scale and base pair position on chromosome. (F) Impact of CCND2 knockdown by two different siRNAs on indicated mRNA levels. Kasumi-1 cells were sequentially electroporated every 2 days with the indicated siRNAs. Transcript levels were determined on day 8 by qPCR. Mock, non-siRNA electroporated cells; siCCND1, siCCND2, CCND1, and CCND2 siRNA. Mean ± SD; n = 3. ∗∗∗p < 0.001; ∗∗p < 0.01 compared with siMM. (G) Effects of single and combined siRNA treatment on CCND2, CCND1, and CDK6 RNA levels in Kasumi-1 cells. Transcript levels were analyzed in triplicates 48 hr after electroporation by qPCR and normalized to GAPDH. Mean ± SD, n = 3. ∗∗∗p < 0.001; ∗∗p < 0.01 compared with siMM. (H) Proliferation curves for Kasumi-1 cells electroporated sequentially every 2 days with the indicated siRNA combinations. (I) Cell cycle distribution of Kasumi-1 cells 48 hr after electroporation with the indicated shRNA combinations. n = 1. (J) Colony formation of Kasumi-1 cells electroporated with the indicated sRNA combinations. Colonies were counted after 12 days post plating and normalized to siMM. Mean ± SD; n = 4 technical replicates. See also Figure S5.
Figure 6
Figure 6
The CDK4/6 Inhibitor Palbociclib Inhibits Growth of RUNX1/ETO-Expressing Leukemic Cells (A) Dose-response curve for proliferation of SKNO-1 and Kasumi-1 cells treated for 72 hr with the indicated palbociclib concentrations. Mean ± SD; n = 6. (B) Dose-response curve for inhibition of colony formation by palbociclib. Colonies formed in presence of palbociclib were counted 14 days after seeding. Mean ± SD; n = 3. (C) Growth curves of t(8;21) cell lines during long-term treatment with palbociclib. Mean ± SD; n = 3. (D) Dose-response curve for proliferation of CD34+ cord blood cells expressing truncated RUNX1/ETO9a treated with palbociclib for 72 hr. Mean ± SD; n = 3. (E) Cell cycle distribution of Kasumi-1 and SKNO-1 cells after 72 hr treatment with the indicated palbociclib doses. Mean ± SD; n = 3. ∗∗∗p < 0.001; p < 0.05 compared with no palbociclib (CV). (F) Cell cycle distribution as indicated by Pyronin Y and Hoechst33342 staining of Kasumi-1 and SKNO-1 cells with and without 50 nM palbociclib for 24 hr. ∗∗∗p < 0.001; ∗∗p < 0.01 compared with no palbociclib (CV). (G) Impact of CDK4/6 inhibition on senescence in Kasumi-1 and SKNO-1 cells as indicated by staining for SA-βGAL. Top panels, stained cells after 7 days with 50 nM palbociclib; bottom panel, quantitation of SA-βGAL-positive cell numbers. Mean ± SD; n = 5 technical replicates. Scale bar, 50 μm. (H) Immunoblots showing dose-dependent impact of 72 hr palbociclib treatment on indicated protein levels in Kasumi-1 and SKNO-1 cells. (I) GSEA for correlation between palbociclib, RUNX1/ETO, and CCND2 knockdown signatures derived from RNA-seq. NES, normalized enrichment score. (J) Hallmarks of cancer pathways shared between palbociclib treatment, CCND2, and RUNX1/ETO knockdown. Enriched pathways were identified by GSEA. See also Figure S6.
Figure 7
Figure 7
CDK4/6 Inhibition Impairs Proliferation of Primary AML Cells and Increases Median Survival In Vivo (A) Impact of palbociclib on proliferation of primary AML blasts. Blasts were co-cultured on MSC feeder layers with and without 300 nM palbociclib for 72 hr. Mean ± SD; n = 3 for both t(8;21) and non-t(8;21) AML patient samples. p < 0.05 compared with no palbociclib. (B) Phase contrast photographs showing primary t(8;21) AML blasts from patient sample LK111 in co-culture with MSCs with and without (CV) palbociclib. Standard bar, 200 μm. (C) Proliferation of a t(8;21) AML sample from a relapsed patient on MS-5 feeders upon palbociclib treatment for 72 hr. Mean ± SD; n = 3 technical replicates. (D and E) Cell cycle distribution (D) and changes in apoptotic subG1 cell fractions (E) of primary AML blasts obtained from two t(8;21) patients (patient samples LK19 and LK111) on MSC after 96 hr incubation with and without (CV) palbociclib. (F) Clonogenic growth of three different t(8;21) patient samples after MSC co-culture for 96 hr. Indicated palbociclib concentrations were added either only to co-culture medium (Palbociclib in co-culture) or to both co-culture and semisolid medium (Palbociclib in co-culture & CFA). Colony numbers are relative to no palbociclib. Mean ± SD; n = 3. ∗∗∗p < 0.001; p < 0.05 compared with no palbociclib. (G) Bioluminescent images of RG mice transplanted with luciferase-expressing (luc+) Kasumi-1 cells after 21 days of treatment with control vehicle (CV) or palbociclib. (H) Luminal flux of bioluminescence for CV (n = 8) or palbociclib-treated animals (n = 9). Treatment blocks are indicated at the bottom of the graph. ∗∗p < 0.01; p < 0.05 compared with no palbociclib by one-way ANOVA using a D'Agostino and Pearson test; mean ± SEM. (I) Survival curve for RG mice transplanted with luc+ Kasumi-1 cells. Significance was tested by log rank test. (J) Percentage of Kit+ RUNX1/ETO9a (AE9a) GFP+ cells in mice after CV or palbociclib treatment as determined by fluorescence-activated cell sorting (FACS). (K) Survival curve for Bl6 mice transplanted with KIT+ AE9a GFP+ cells. Significance was tested by log rank test. n = 5 for both groups with one censored animal in the palbociclib group due to death unrelated to palbociclib treatment. (L) Model depicting the RUNX1/ETO-promoted G1 cell cycle progression and leukemic propagation by direct transcriptional activation of CCND2 and CDK6, which can be blocked by either CCND2 knockdown or by pharmacologic inhibition of CDK4/6-CCND complexes. See also Figure S7.
Figure 8
Figure 8
CDK4/6 Interference Sensitizes AML Cells toward Inhibition of Mutated KIT (A) Fold change of all KIT shRNA constructs in RNAi screens after third replatings (top) and in vivo engraftment (bottom) in t(8;21) cell lines. (B) String-generated gene network showing interactions between genes indicated by the in vivo RNAi screen. Nodes represent genes indicated by at least two shRNAs in combined SKNO-1 and Kasumi-1 screens. (C) Dose-response curves for proliferation of Kasumi-1 and SKNO-1 cells with palbociclib, imatinib (blue curves), or a combination with a fixed molar ratio of palboclib:imatinib of 1:10 (red curves). Top and bottom x axes show the corresponding palbociclib and imatinib concentrations. Cell numbers were counted after 72 hr of drug treatment. Mean ± SD; n = 4. See also Figure S8.

References

    1. Anders S., Pyl P.T., Huber W. HTSeq–a Python framework to work with high-throughput sequencing data. Bioinformatics. 2015;31:166–169. - PMC - PubMed
    1. Banker D.E., Radich J., Becker A., Kerkof K., Norwood T., Willman C., Appelbaum F.R. The t(8;21) translocation is not consistently associated with high Bcl-2 expression in de novo acute myeloid leukemias of adults. Clin. Cancer Res. 1998;4:3051–3062. - PubMed
    1. Becker H., Pfeifer D., Afonso J.D., Nimer S.D., Veelken H., Schwabe M., Lubbert M. Two cell lines of t(8;21) acute myeloid leukemia with activating KIT exon 17 mutation: models for the ‘second hit’ hypothesis. Leukemia. 2008;22:1792–1794. - PubMed
    1. Ben-Porath I., Thomson M.W., Carey V.J., Ge R., Bell G.W., Regev A., Weinberg R.A. An embryonic stem cell-like gene expression signature in poorly differentiated aggressive human tumors. Nat. Genet. 2008;40:499–507. - PMC - PubMed
    1. Benjamini Y., Hochberg Y. Controlling the false discovery rate: a practical and powerful approach to multiple testing. J. R. Statist. Soc. B. 1995;57:289–300.

Publication types