. 2018 Oct 8;47(1):38-52.e6.
doi: 10.1016/j.devcel.2018.09.013.

Combining Developmental and Perturbation-Seq Uncovers Transcriptional Modules Orchestrating Neuronal Remodeling

Affiliations

Combining Developmental and Perturbation-Seq Uncovers Transcriptional Modules Orchestrating Neuronal Remodeling

Idan Alyagor et al. Dev Cell. .

Abstract

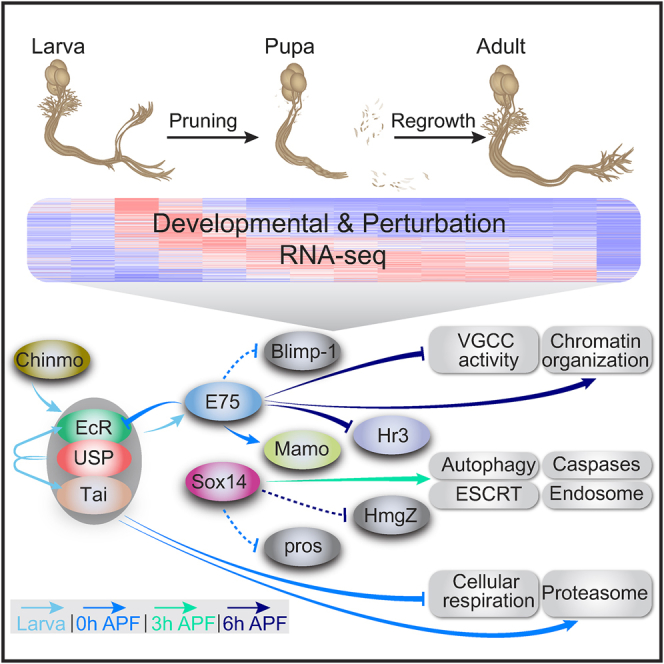
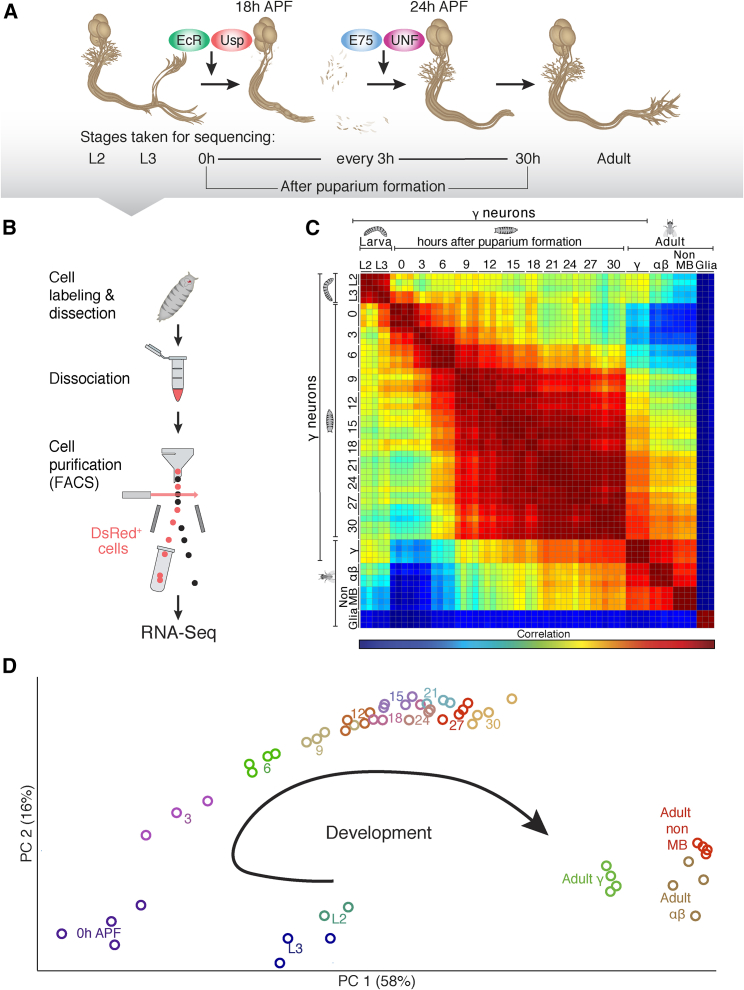
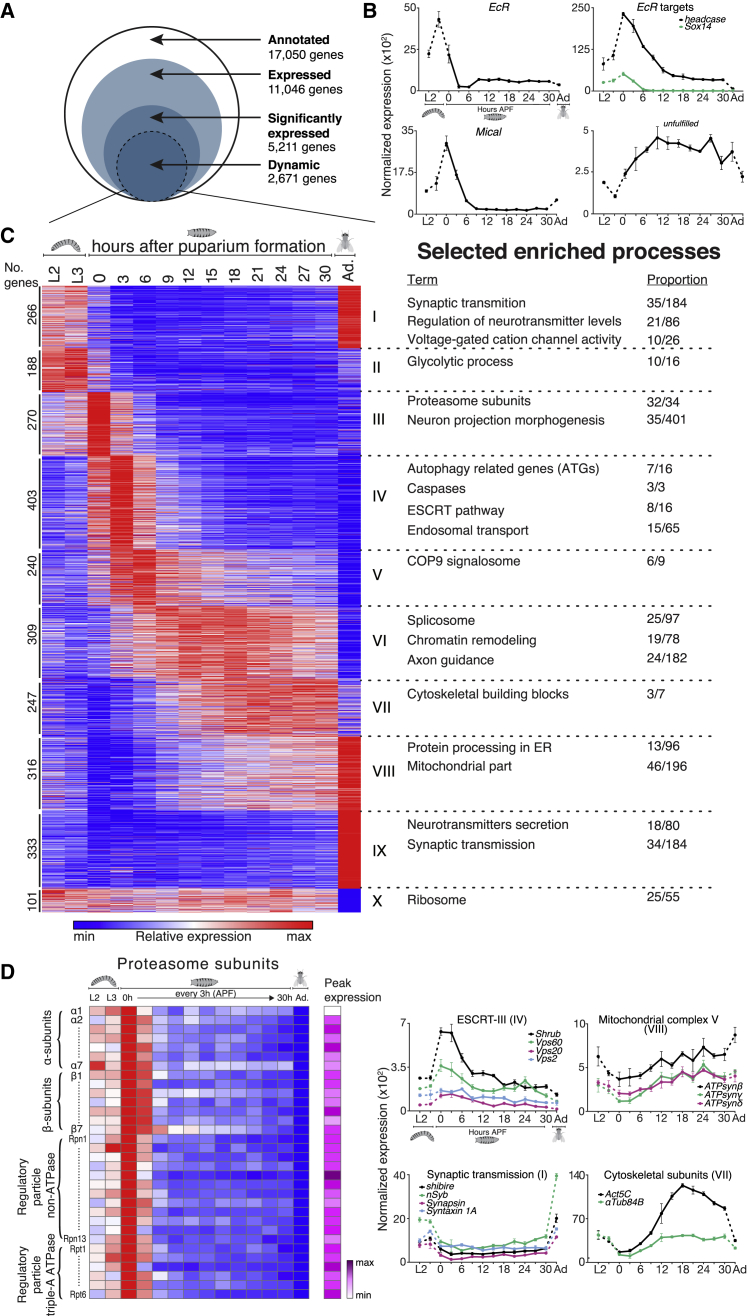
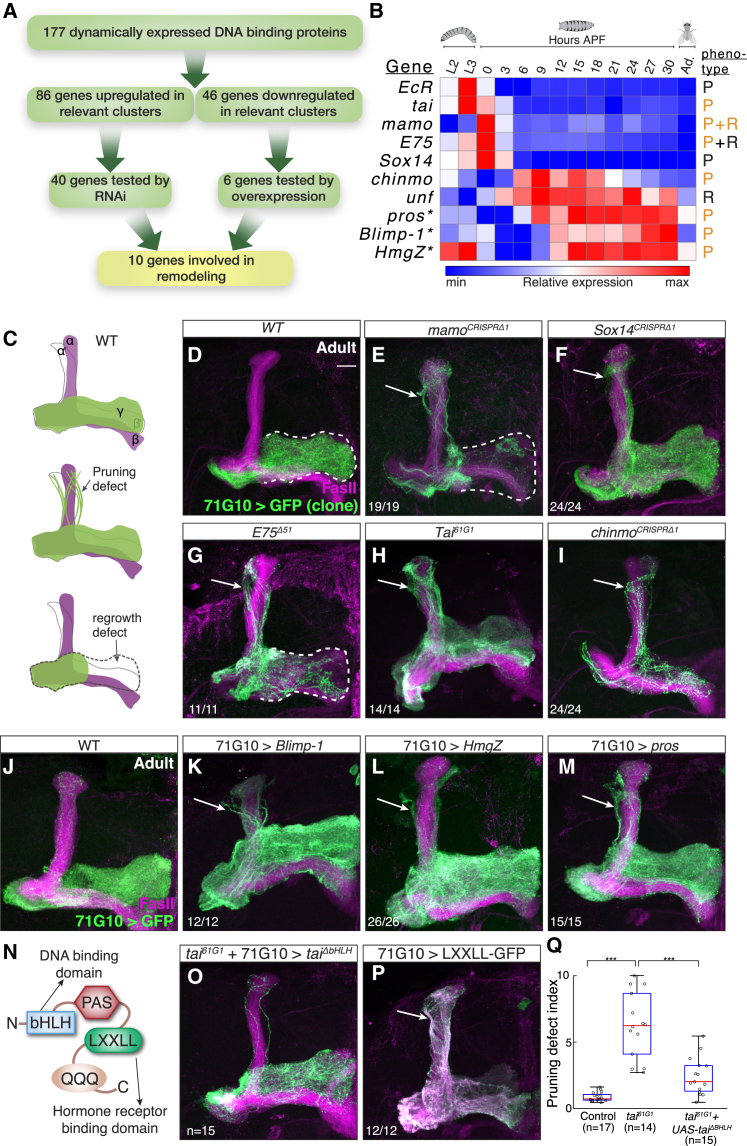
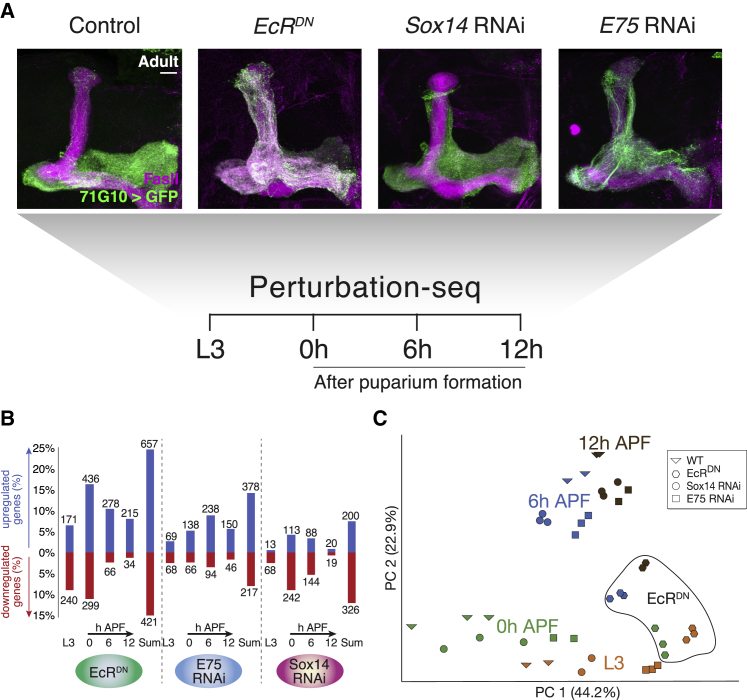
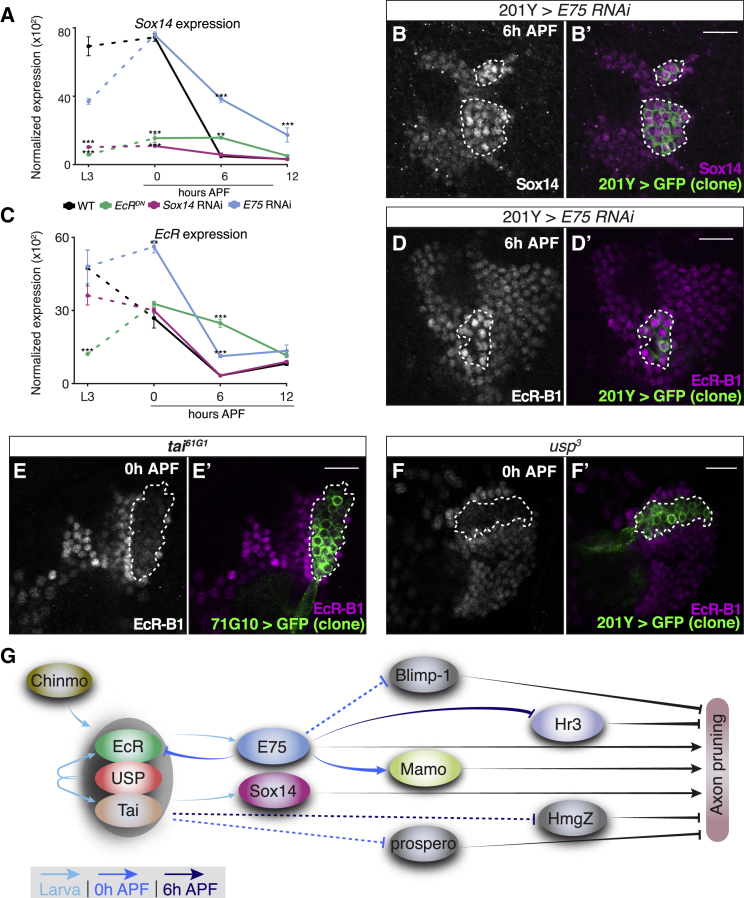
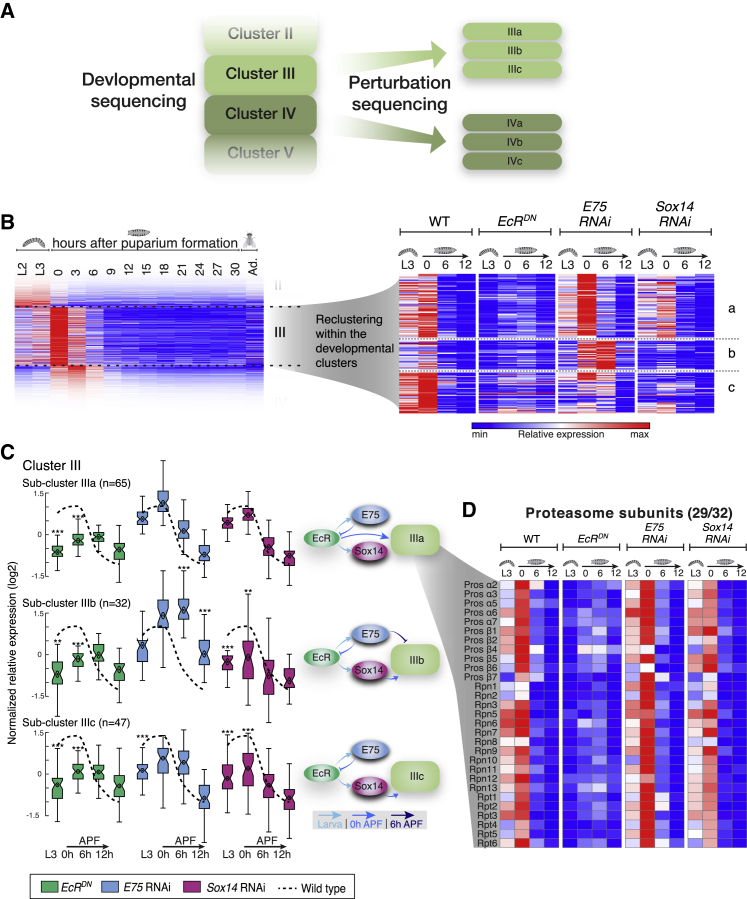
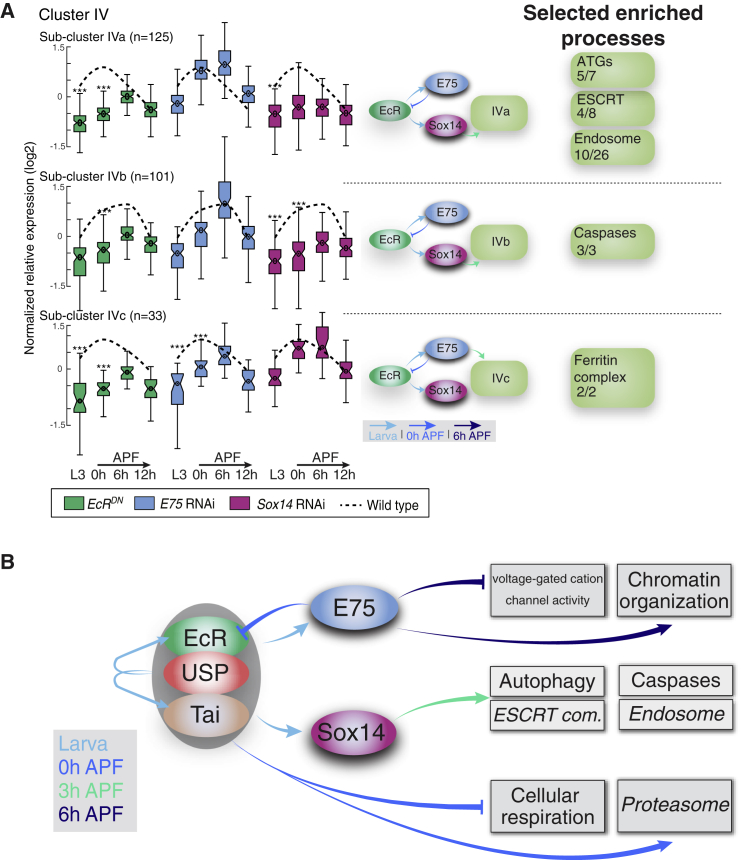
Developmental neuronal remodeling is an evolutionarily conserved mechanism required for precise wiring of nervous systems. Despite its fundamental role in neurodevelopment and proposed contribution to various neuropsychiatric disorders, the underlying mechanisms are largely unknown. Here, we uncover the fine temporal transcriptional landscape of Drosophila mushroom body γ neurons undergoing stereotypical remodeling. Our data reveal rapid and dramatic changes in the transcriptional landscape during development. Focusing on DNA binding proteins, we identify eleven that are required for remodeling. Furthermore, we sequence developing γ neurons perturbed for three key transcription factors required for pruning. We describe a hierarchical network featuring positive and negative feedback loops. Superimposing the perturbation-seq on the developmental expression atlas highlights a framework of transcriptional modules that together drive remodeling. Overall, this study provides a broad and detailed molecular insight into the complex regulatory dynamics of developmental remodeling and thus offers a pipeline to dissect developmental processes via RNA profiling.

Keywords: RNA-seq; axon pruning; developmental-seq; mushroom body; neuronal remodeling; γ-neurons.


Figures

None
Graphical abstract
Figure 1
Figure 1
Expression Profiles of Developing Neurons Reveal a Dynamic Transcriptional Landscape (A) Schematic representation of MB γ neuron remodeling and its regulation by the nuclear receptor (NR) complexes. The time-points taken for RNA-seq are indicated below. L2 and L3 refer to 2nd and 3rd instar larva, respectively. (B) Schematic representation of the strategy we employed to isolate γ neurons from fly brains at different developmental stages. (C) Global correlation matrix of the expression profiles indicated. We sequenced MB γ neurons at 14 developmental stages, as well as adult α/β MB neurons (labeled using NP3061-Gal4), non-MB neurons (labeled by c155-Gal4 combined with MB247-Gal80), and astrocyte-like cells (labeled by alrm-Gal4; marked as Glia). (D) Principal-component analysis (PCA) of the neural expression profiles shown in (C). Numbers indicate hours after puparium formation (APF).
Figure 2
Figure 2
Developmental Expression Atlas Highlights Axon Remodeling Gene Network (A) Schematic description of the developmental RNA-seq gating analysis. See details in STAR Methods. (B) Normalized expression of key remodeling related genes across γ neuron development (x axis, only every second time point is labeled due to space limitations; Ad, Adult). Error bars indicate SEM; units on the y axis are arbitrary. (C) Heatmap showing k-means clustering (k = 10) of 2,671 dynamically expressed genes across MB γ neuron development. Each horizontal line describes the relative expression of a single gene. Cluster numbers are indicated using Roman numerals. Selected enriched processes within each cluster are described on the right (for a full analysis, see Tables S2 and S3). Enrichment is described here as the proportion of genes within the cluster/total number of genes belonging to the functional group and that are significantly expressed. (D) Examples of functional groups of genes that are expressed in a similar, and interesting, pattern. Heatmap depicting the relative expression patterns of the proteasome subunits (left). The magenta scale depicts the peak expression of each gene relative to that of other genes in the group. Graphs showing the normalized expression levels of selected genes and gene groups throughout development (x axis, every second time point is labeled due to space limitations; Ad, Adult). Error bars indicate SEM; units on the y axis are arbitrary. Cluster numbers are indicated in parenthesis using Roman numerals.
Figure 3
Figure 3
Dynamic Expression of DNA Binding Proteins Highlight New Genes Required for Remodeling (A) Scheme of the rationale for the DNA binding protein screen, including the number of genes in each step. (B) Heatmap showing the relative expression pattern of the 10 positive hits in the DNA binding protein screen. The expression patterns of all 46 genes experimentally tested are shown in Figure S3. Genes were perturbed by RNAi or overexpression (asterisk) experiments. P and R stand for pruning or regrowth phenotypes, respectively. While genes known to be required for remodeling are labeled in black, new findings from this study are labeled in orange. (C) Schematic representation of WT and defective MBs depicting pruning and regrowth defects. Green represents the γ lobe(s) and magenta represents FasII staining, which in the adult strongly labels α/β neurons, weakly labels γ neurons (not shown for clarity), and does not label αʹ/βʹ neurons. (D–I) Confocal Z-projections of adult MBs containing WT (D), mamoCRISPRΔ1 (E), Sox14CRISPRΔ1 (F), E75Δ51 (G), Tai61G1 (H), and chinmoCRISPRΔ1 (I) MARCM clones labeled with membrane bound mCD8-GFP (GFP) driven by 71G10-GAL4 (71G10). (J–M) Confocal Z-projections of adult MBs labeled by 71G10-Gal4 driven mCD8-GFP (GFP) additionally expressing Blimp-1 (K), HmgZ (L), and pros (M). (N) Schematic diagram of Tai depicting the basic-helix-loop-helix (bHLH) domain required for DNA binding, the LXXLL domain required for binding hormone receptors, the PAS domain, and the poly Q activation domain. (O) Confocal Z-projections of adult tai61G1 MB MARCM neuroblast clones labeled by 71G10-Gal4 driven mCD8-GFP additionally expressing a tai rescue transgene lacking its bHLH domain (ΔbHLH). (P) Confocal Z-projection of an adult MB with 71G10-Gal4 driving the expression of mCD8-GFP and as well as the hormone receptor binding domain of Tai fused to GFP. (Q) Quantification of the pruning severity in (D), (H), and (O). We automatically designated a pruning index to each brain based on image analysis (see STAR Methods). Box centers indicate the median, and the bottom and top edges indicate the 25th and 75th percentiles, respectively. The whiskers extend to the most extreme data points not considered outliers (99.3% coverage if the data is normally distributed). ∗∗∗p < 0.001; see Figure S6B for a parallel, blind ranking quantification. Pruning defects, evident by dorsally projecting γ neurons, are marked by arrows, while a regrowth defect, evident by incomplete innervation of the adult γ lobe, is demarcated by a white dashed line. Green is mCD8-GFP driven by 71G10-Gal4; magenta is FasII staining; scale bar represents 15 μm. The numbers (x/n) on the lower left corners depict the number of times the phenotype was observed out of the total hemispheres examined.
Figure 4
Figure 4
EcR Mediates Larval to Pupal Transition as Identified by Perturbation Sequencing (A) Schematic overview of the genotypes and time points taken for perturbation sequencing. The images are confocal Z-projections of adult MB γ neurons labeled with mCD8-GFP (GFP) driven by 71G10-GAL4 (71G10) additionally expressing the indicated transgenes and counterstained with FasII antibody (magenta). Scale bar represents 15 μm. (B) Quantification showing the number of genes affected by each TF perturbation at each developmental time point as compared to WT. (C) Principal-component analysis (PCA) of the expression profiles of WT and perturbed MB γ neurons throughout development. Colors demarcate the developmental time, while the shape of each icon represents its genotype.
Figure 5
Figure 5
Hierarchical TF Networks Regulate Axon Pruning (A and C) Normalized expression of Sox14 (A) or EcR (C) in WT MB γ neurons and in those expressing the indicated transgene (∗∗p < 0.01; ∗∗∗p < 0.001). Error bars indicate SEM; units on the y axis are arbitrary. (B and D–F) Confocal single slices of the cell body region of MBs containing neuroblast clones labeled with 201Y-GAL4 (B, D, and F) or 71G10-GAL4 (E) driven mCD8-GFP (green), additionally driving the expression of E75 RNAi (B, n = 5; D, n = 4), or mutant for tai61G1 (E, n = 6) or usp3 (F, n = 5). Brains are stained with anti-Sox14 (B) or anti-EcR-B1 (D–F) (magenta) at the indicated time points. Clones are demarcated by dashed lines. The Sox14 antibody staining was increased by 2.2-fold (p < 0.001) within clones expressing E75 RNAi. Expression levels of EcR exhibited a 2.5-fold increase (p < 0.01) within the clone expressing E75 RNAi and a 2.9-fold (p < 0.001) and 3-fold (p < 0.001) decrease within the usp3 and tai61G1 clones, respectively. Scale bars represent 15 μm. (G) Schematic model based on data presented here and in Figure S6, describing the hierarchical regulation of axon pruning by regulatory factors as uncovered in this study. The gray ellipse encompassing EcR, Usp, and Tai represents the NR complex. The temporal dimension is represented by the blue color tones of the arrows. While full lines were validated by antibody expressed experiments, dashed lines indicated regulation interpreted only from the RNA-seq data.
Figure 6
Figure 6
Combining Developmental Clustering with Perturbation Sequencing Is a Powerful Strategy to Reveal Functional Groups of Genes Co-regulated by TF Modules (A) Schematic representation of the sub-cluster analysis. Each developmental cluster was further divided into sub-clusters with a unique pattern of response to the TF perturbations (by k-means clustering; k = 2–4 for each cluster). The sub-clusters contain only genes whose expression significantly changed in at least one perturbation (see STAR Methods for more information). (B) Heatmaps of developmental cluster III (left) and the three sub-clusters IIIa–c in the perturbation-seq (right) as an example. Similar analyses were conducted for all developmental clusters (see Table S5). (C) Boxplot analyses of sub-clusters IIIa–c. The average normalized relative gene expression of the WT samples within each sub-cluster is depicted by the dashed line. Boxplots of the normalized relative gene expression for each one of the perturbations in each time point are shown. Box centers indicate the median, and the bottom and top edges indicate the 25th and 75th percentiles, respectively. The whiskers extend to the most extreme data points not considered outliers (99.3% coverage if the data are normally distributed). Statistical significance was determined (∗∗p < 0.01; ∗∗∗p < 0.001; see STAR Methods) but shown only in cases where the average fold change >2 and thus more likely to also be biologically significant. The hierarchal regulation of each sub-cluster, as inferred from the data, is presented schematically where the temporal dimension is represented by the shades of blue of the arrows. (D) Heatmap depicting the relative expression patterns of the proteasome subunits, belonging to cluster IIIa, in the different perturbations. Number (x/y) represent the number of genes from the functional group within the sub-cluster (x) / the number of genes from the functional group within the parent cluster (y).
Figure 7
Figure 7
Toward a Temporal Understanding of the Expression Landscape that Underlies Neuronal Remodeling of MB γ Neurons (A) Boxplot analyses of sub-clusters IVa–c. The average normalized relative gene expression of the WT samples is depicted by the dashed line. Boxplots of the normalized relative gene expression for each one of the perturbations in each time point are shown. Box centers indicate the median, and the bottom and top edges indicate the 25th and 75th percentiles, respetively. The whiskers extend to the most extreme data points not considered as outleirs (99.3% coverage if the data is noramlly distributed). Statistical significance was determined (∗∗∗p < 0.001; see STAR Methods) but only shown in cases where the average fold change >2 and thus more likely to also be biologically significant. The hierarchal regulation of each sub-cluster, as inferred from the data, is presented schematically where the temporal dimension is represented by the shades of blue of the arrows. On the right, we label selected groups of genes that are functionally related and enriched within the sub-cluster. Numbers (x/y) represent the number of genes from the functional group within the sub-cluster / the number of genes from the functional group within the parent cluster. (B) A schematic model based on data presented and analyzed in Figures 6 and 7 and Table S5, describing the temporal regulation or specific transcription modules by the indicated TFs. GO terms with genes that have a known function in remodeling are highlighted in italics. The temporal dimension is represented by the color of the arrows.

References

    1. Awasaki T., Tatsumi R., Takahashi K., Arai K., Nakanishi Y., Ueda R., Ito K. Essential role of the apoptotic cell engulfment genes draper and ced-6 in programmed axon pruning during Drosophila metamorphosis. Neuron. 2006;50:855867. - PubMed
    1. Bai J., Uehara Y., Montell D.J. Regulation of invasive cell behavior by taiman, a Drosophila protein related to AIB1, a steroid receptor coactivator amplified in breast cancer. Cell. 2000;103:1047–1058. - PubMed
    1. Barkai N., Leibler S. Circadian clocks limited by noise. Nature. 2000;403:267–268. - PubMed
    1. Biggin M.D., Tjian R. Transcription factors and the control of Drosophila development. Trends Genet. 1989;5:377–383. - PubMed
    1. Bischof J., Björklund M., Furger E., Schertel C., Taipale J., Basler K. A versatile platform for creating a comprehensive UAS-ORFeome library in Drosophila. Development. 2013;140:2434–2442. - PubMed

Publication types

MeSH terms